Council elections
| Year | Labour | Conservative | Liberal Democrats [a] | Reform | UKIP | Ashfield Ind. | Mansfield Ind. | Independents & Others | Council control after election | |
|---|---|---|---|---|---|---|---|---|---|---|
| Local government reorganisation; council established (89 seats) | ||||||||||
| 1973 [2] | 54 | 35 | 0 | – | – | – | – | 0 | Labour | |
| 1977 [2] | 20 | 66 | 1 | – | – | – | – | 2 [b] | Conservative | |
| New division boundaries; seats decreased from 89 to 88 | ||||||||||
| 1981 [2] | 55 | 32 | 0 | – | – | – | – | 1 [c] | Labour | |
| 1985 [2] | 48 | 37 | 2 | – | – | – | – | 1 | Labour | |
| 1989 [2] | 50 | 34 | 4 | – | – | – | – | 0 | Labour | |
| 1993 [2] | 58 | 24 | 6 | – | – | – | – | 0 | Labour | |
| Nottingham becomes a unitary authority; seats decreased from 88 to 63 | ||||||||||
| 1997 [2] | 42 | 17 | 4 | – | 0 | – | – | 0 | Labour | |
| 2001 [2] | 40 | 20 | 3 | – | 0 | – | – | 0 | Labour | |
| New division boundaries; seats increased from 63 to 67 | ||||||||||
| 2005 [2] | 38 | 25 | 4 | – | 0 | – | – | 0 | Labour | |
| 2009 [2] | 13 | 35 | 9 | – | 1 | – | 6 | 3 [d] | Conservative | |
| 2013 [3] | 34 | 21 | 8 | – | 0 | – | 2 | 2 [e] | Labour | |
| New division boundaries; seats decreased from 67 to 66 [4] | ||||||||||
| 2017 [5] | 23 | 31 | 1 | – | 0 | 5 | 4 | 2 [f] | No overall control | |
| 2021 [6] | 15 | 37 | 1 | 0 | 0 | 10 | 0 | 3 | Conservative | |
| 2025 [7] | 4 | 17 | 0 | 40 | 0 | 1 | 0 | 2 [g] | Reform UK | |
County result maps
 2025 results map
 2021 results map
 2017 results map
 2013 results map
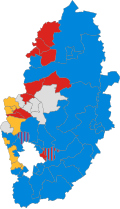 2009 results map
 2005 results map
 2001 results map
 1997 results map
 1993 results map
 1989 results map
 1985 results map
 1981 results map


