| |||||||||||||||||||||||||||||||||
All 63 seats to Nottinghamshire County Council 32 seats needed for a majority | |||||||||||||||||||||||||||||||||
---|---|---|---|---|---|---|---|---|---|---|---|---|---|---|---|---|---|---|---|---|---|---|---|---|---|---|---|---|---|---|---|---|---|
Turnout | 60.5% | ||||||||||||||||||||||||||||||||
| |||||||||||||||||||||||||||||||||
Map of the results of the election in each division. Colours denote the winning party, as shown in the main table of results. | |||||||||||||||||||||||||||||||||
|
The 2001 Nottinghamshire County Council election was held on Thursday, 7 June 2001. The whole council was up for election and the result was the Labour Party retaining its control of the council. [1] [2]
Overall Turnout | ||||
---|---|---|---|---|
Registered electors | 581,836 | |||
Votes cast | 352,237 | |||
Turnout | 60.5% |
2001 Nottinghamshire County Council election | ||||||||||
---|---|---|---|---|---|---|---|---|---|---|
Party | Candidates | Seats | Gains | Losses | Net gain/loss | Seats % | Votes % | Votes | +/− | |
Labour | 63 | 40 | 44.2 | 155,587 | ||||||
Conservative | 63 | 20 | 36.1 | 127,039 | ||||||
Liberal Democrats | 41 | 3 | 14.7 | 51,647 | ||||||
Independent | 16 | 0 | 3.8 | 13,252 | ||||||
Green | 12 | 0 | 1.2 | 4,328 | ||||||
Socialist Alliance (England) | 1 | 0 | 0.1 | 262 | ||||||
BNP | 1 | 0 | 0.1 | 122 |
(9 seats, 9 electoral divisions)
Ashfield District | |||||||||||||||
---|---|---|---|---|---|---|---|---|---|---|---|---|---|---|---|
Party | Candidates | Votes | |||||||||||||
Stood | Elected | Gained | Unseated | Net | % of total | % | No. | Net % | |||||||
Labour | 9 | 9 | 0 | 0 | 57.8 | 26,706 | |||||||||
Conservative | 9 | 0 | 0 | 0 | 27.6 | 12,771 | |||||||||
Independent | 5 | 0 | 0 | 0 | 11.0 | 5,097 | |||||||||
Green | 3 | 0 | 0 | 0 | 2.8 | 1,284 | |||||||||
Socialist Alliance | 1 | 0 | 0 | 0 | 0.6 | 262 | |||||||||
BNP | 1 | 0 | 0 | 0 | 0.3 | 122 |
Ashfield Turnout | ||||
---|---|---|---|---|
Registered electors | 86,806 | |||
Votes cast | 46,242 | |||
Turnout | 53.3% |
Party | Candidate | Votes | % | ±% | |
---|---|---|---|---|---|
Labour | Chris Baron | 3,080 | 56.4 | ||
Conservative | M Spencer | 1,332 | 24.4 | ||
Independent | R Gow | 1,052 | 19.3 | ||
Turnout | 5,464 | 54.7 | |||
Registered electors | 9,995 |
Party | Candidate | Votes | % | ±% | |
---|---|---|---|---|---|
Labour | Nellie Smedley | 4,902 | 64.6 | ||
Conservative | S Robbins | 2,686 | 35.4 | ||
Turnout | 7,588 | 56.9 | |||
Registered electors | 13,327 |
Party | Candidate | Votes | % | ±% | |
---|---|---|---|---|---|
Labour | Richard Needham | 2,787 | 54.0 | ||
Independent | Robert Hook | 1,025 | 19.9 | ||
Conservative | Sylvia Baker | 1,001 | 19.4 | ||
Green | Justin Smith | 350 | 6.8 | ||
Turnout | 5,163 | 49.5 | |||
Registered electors | 10,424 |
Party | Candidate | Votes | % | ±% | |
---|---|---|---|---|---|
Labour | Yvonne Davidson | 2,665 | 46.4 | ||
Conservative | A Hobson | 1,829 | 31.8 | ||
Independent | N Woolley | 640 | 11.1 | ||
Green | M Harrison | 615 | 10.7 | ||
Turnout | 5,749 | 55.6 | |||
Registered electors | 10,340 |
Party | Candidate | Votes | % | ±% | |
---|---|---|---|---|---|
Labour | Joan Taylor | 2,579 | 48.5 | ||
Independent | Gail Turner | 1,502 | 28.2 | ||
Conservative | Roma Cox | 1,242 | 23.3 | ||
Turnout | 5,323 | 54.5 | |||
Registered electors | 9,769 |
Party | Candidate | Votes | % | ±% | |
---|---|---|---|---|---|
Labour | Edward Llewellyn-Jones | 2,341 | 56.7 | ||
Independent | W Shaw | 878 | 21.3 | ||
Conservative | T Chandran | 787 | 19.1 | ||
BNP | A Johnson | 122 | 3.0 | ||
Turnout | 4,128 | 49.8 | |||
Registered electors | 8,295 |
Party | Candidate | Votes | % | ±% | |
---|---|---|---|---|---|
Labour | Steve Carroll | 2,760 | 73.3 | ||
Conservative | Eugene Di Villa | 1,005 | 26.7 | ||
Turnout | 3,765 | 49.9 | |||
Registered electors | 7,543 |
Party | Candidate | Votes | % | ±% | |
---|---|---|---|---|---|
Labour | Dick Anthony | 2,553 | 57.7 | ||
Conservative | John Baker | 1,291 | 29.2 | ||
Green | Daniela Perschke | 319 | 7.2 | ||
Socialist Alliance | Jeffrey Tucker | 262 | 5.9 | ||
Turnout | 4,425 | 53.3 | |||
Registered electors | 8,296 |
Party | Candidate | Votes | % | ±% | |
---|---|---|---|---|---|
Labour | David Kirkham | 3,039 | 65.5 | ||
Conservative | Christine Vernon | 1,598 | 34.5 | ||
Turnout | 4,637 | 52.6 | |||
Registered electors | 8,817 |
(9 seats, 9 electoral divisions)
Bassetlaw District | |||||||||||||||
---|---|---|---|---|---|---|---|---|---|---|---|---|---|---|---|
Party | Candidates | Votes | |||||||||||||
Stood | Elected | Gained | Unseated | Net | % of total | % | No. | Net % | |||||||
Labour | 9 | 7 | 0 | 0 | 50.0 | 23,671 | |||||||||
Conservative | 9 | 2 | 0 | 0 | 38.6 | 18,292 | |||||||||
Liberal Democrats | 4 | 0 | 0 | 0 | 9.7 | 4,588 | |||||||||
Independent | 1 | 0 | 0 | 0 | 1.0 | 470 | |||||||||
Green | 1 | 0 | 0 | 0 | 0.7 | 309 |
Bassetlaw Turnout | ||||
---|---|---|---|---|
Registered electors | 81,562 | |||
Votes cast | 47,330 | |||
Turnout | 58.0% |
Party | Candidate | Votes | % | ±% | |
---|---|---|---|---|---|
Labour | Sheila Place | 3,361 | 71.8 | ||
Conservative | J Rickells | 1,318 | 28.2 | ||
Turnout | 4,679 | 52.3 | |||
Registered electors | 8,949 |
Party | Candidate | Votes | % | ±% | |
---|---|---|---|---|---|
Conservative | Kenneth Bullivant | 3,376 | 51.9 | ||
Liberal Democrats | Sean Kerrigan | 1,714 | 26.3 | ||
Labour | Laurence West | 1,109 | 17.0 | ||
Green | Paul Thorpe | 309 | 4.7 | ||
Turnout | 6,508 | 64.1 | |||
Registered electors | 10,145 |
Party | Candidate | Votes | % | ±% | |
---|---|---|---|---|---|
Labour | James Napier | 2,187 | 41.1 | ||
Conservative | Jean Bush | 2,054 | 38.6 | ||
Liberal Democrats | Graham Read | 1,082 | 20.3 | ||
Turnout | 5,323 | 64.4 | |||
Registered electors | 8,264 |
Party | Candidate | Votes | % | ±% | |
---|---|---|---|---|---|
Labour | Mick Storey | 2,455 | 51.5 | ||
Conservative | James Holland | 1,542 | 32.4 | ||
Liberal Democrats | John Bragger | 766 | 16.1 | ||
Turnout | 4,763 | 58.8 | |||
Registered electors | 8,097 |
Party | Candidate | Votes | % | ±% | |
---|---|---|---|---|---|
Conservative | John Hempsall | 3,153 | 52.6 | ||
Labour | J Shephard | 1,818 | 30.3 | ||
Liberal Democrats | P Horton | 1,026 | 17.1 | ||
Turnout | 5,997 | 65.3 | |||
Registered electors | 9,189 |
Party | Candidate | Votes | % | ±% | |
---|---|---|---|---|---|
Labour | Glynn Gilfoyle | 3,661 | 67.3 | ||
Conservative | John Ogle | 1,782 | 32.7 | ||
Turnout | 5,443 | 56.0 | |||
Registered electors | 9,727 |
Party | Candidate | Votes | % | ±% | |
---|---|---|---|---|---|
Labour | Roy Barsley | 3,627 | 62.9 | ||
Conservative | D Hare | 2,137 | 37.1 | ||
Turnout | 5,764 | 56.4 | |||
Registered electors | 10,211 |
Party | Candidate | Votes | % | ±% | |
---|---|---|---|---|---|
Labour | Vicki Smailes | 1,844 | 62.1 | ||
Conservative | A Dibb | 655 | 22.1 | ||
Independent | B Malacrida | 470 | 15.8 | ||
Turnout | 2,969 | 51.4 | |||
Registered electors | 5,775 |
Party | Candidate | Votes | % | ±% | |
---|---|---|---|---|---|
Labour | Alan Davison | 3,609 | 61.3 | ||
Conservative | J Smith | 2,275 | 38.7 | ||
Turnout | 5,884 | 52.5 | |||
Registered electors | 11,205 |
(9 seats, 9 electoral divisions)
Broxtowe District | |||||||||||||||
---|---|---|---|---|---|---|---|---|---|---|---|---|---|---|---|
Party | Candidates | Votes | |||||||||||||
Stood | Elected | Gained | Unseated | Net | % of total | % | No. | Net % | |||||||
Labour | 9 | 6 | 40.8 | 22,352 | |||||||||||
Conservative | 9 | 2 | 33.4 | 18,281 | |||||||||||
Liberal Democrats | 9 | 1 | 22.8 | 12,516 | |||||||||||
Green | 3 | 0 | 0 | 0 | 2.0 | 1,082 | |||||||||
Independent | 1 | 0 | 0 | 0 | 1.0 | 546 |
Broxtowe Turnout | ||||
---|---|---|---|---|
Registered electors | 84,576 | |||
Votes cast | 54,777 | |||
Turnout | 64.8% |
Party | Candidate | Votes | % | ±% | |
---|---|---|---|---|---|
Labour | Maureen Tewson | 1,888 | 41.1 | ||
Conservative | Joan Moodie | 1,337 | 29.1 | ||
Liberal Democrats | Stephen Carr | 1,113 | 24.2 | ||
Green | Sylvia Rule | 259 | 5.6 | ||
Turnout | 4,597 | 63.2 | |||
Registered electors | 7,270 |
Party | Candidate | Votes | % | ±% | |
---|---|---|---|---|---|
Labour | Michael Warner | 2,524 | 48.1 | ||
Conservative | Daniel Walton | 1,360 | 25.9 | ||
Liberal Democrats | Paul Fox | 840 | 16.0 | ||
Green | Paul Anderson | 524 | 10.0 | ||
Turnout | 5,248 | 61.2 | |||
Registered electors | 8,581 |
Party | Candidate | Votes | % | ±% | |
---|---|---|---|---|---|
Liberal Democrats | Stan Heptinstall | 2,988 | 46.6 | ||
Conservative | A Ford | 1,939 | 30.2 | ||
Labour | P Lally | 1,491 | 23.2 | ||
Turnout | 6,418 | 71.5 | |||
Registered electors | 8,973 |
Party | Candidate | Votes | % | ±% | |
---|---|---|---|---|---|
Labour | Gordon Skinner | 2,655 | 42.8 | ||
Conservative | Richard Jackson | 2,320 | 37.4 | ||
Liberal Democrats | Jacqueline Williams | 931 | 15.0 | ||
Green | Richard Eddleston | 299 | 4.8 | ||
Turnout | 6,205 | 69.1 | |||
Registered electors | 8,985 |
Party | Candidate | Votes | % | ±% | |
---|---|---|---|---|---|
Labour | Eleanor Lodziak | 3,266 | 55.3 | ||
Conservative | M Brown | 1,720 | 29.1 | ||
Liberal Democrats | R Charlesworth | 919 | 15.6 | ||
Turnout | 5,905 | 56.1 | |||
Registered electors | 10,526 |
Party | Candidate | Votes | % | ±% | |
---|---|---|---|---|---|
Conservative | David Taylor | 3,726 | 42.5 | ||
Labour | D Hedderly | 3,542 | 40.4 | ||
Liberal Democrats | P Ogden | 954 | 10.9 | ||
Independent | G Green | 546 | 6.2 | ||
Turnout | 8,768 | 65.8 | |||
Registered electors | 13,331 |
Party | Candidate | Votes | % | ±% | |
---|---|---|---|---|---|
Labour | Richard Robinson | 2,287 | 38.1 | ||
Liberal Democrats | Ken Rigby | 2,131 | 35.5 | ||
Conservative | L Ball | 1,589 | 26.5 | ||
Turnout | 6,007 | 65.1 | |||
Registered electors | 9,229 |
Party | Candidate | Votes | % | ±% | |
---|---|---|---|---|---|
Labour | John Bell | 2,364 | 45.6 | ||
Liberal Democrats | M Rich | 1,720 | 33.2 | ||
Conservative | S Bell | 1,096 | 21.2 | ||
Turnout | 5,180 | 60.7 | |||
Registered electors | 8,528 |
Party | Candidate | Votes | % | ±% | |
---|---|---|---|---|---|
Conservative | Tom Pettengell | 3,194 | 49.5 | ||
Labour | F Prince | 2,335 | 36.2 | ||
Liberal Democrats | C Wombwell | 920 | 14.3 | ||
Turnout | 6,449 | 70.5 | |||
Registered electors | 9,153 |
(9 seats, 9 electoral divisions)
Gedling District | |||||||||||||||
---|---|---|---|---|---|---|---|---|---|---|---|---|---|---|---|
Party | Candidates | Votes | |||||||||||||
Stood | Elected | Gained | Unseated | Net | % of total | % | No. | Net % | |||||||
Labour | 9 | 5 | 42.9 | 23,499 | |||||||||||
Conservative | 9 | 3 | 39.6 | 21,687 | |||||||||||
Liberal Democrats | 7 | 1 | 13.4 | 7,359 | |||||||||||
Independent | 2 | 0 | 0 | 0 | 3.1 | 1,676 | |||||||||
Green | 2 | 0 | 0 | 0 | 0.9 | 507 |
Gedling Turnout | ||||
---|---|---|---|---|
Registered electors | 86,824 | |||
Votes cast | 54,728 | |||
Turnout | 63.0% |
Party | Candidate | Votes | % | ±% | |
---|---|---|---|---|---|
Conservative | Rod Kempster | 2,669 | 48.7 | ||
Labour | Paul Feeney | 2,249 | 41.1 | ||
Liberal Democrats | Christopher Pratt | 560 | 10.2 | ||
Turnout | 5,478 | 65.3 | |||
Registered electors | 8,393 |
Party | Candidate | Votes | % | ±% | |
---|---|---|---|---|---|
Conservative | Veronica Pepper | 2,778 | 42.3 | ||
Labour | Barrie Bowker | 2,519 | 38.3 | ||
Liberal Democrats | Janice Lambert | 697 | 10.6 | ||
Independent | Don Stickland | 337 | 5.1 | ||
Green | Henry Wheeler | 238 | 3.6 | ||
Turnout | 6,569 | 64.2 | |||
Registered electors | 10,237 |
Party | Candidate | Votes | % | ±% | |
---|---|---|---|---|---|
Labour | James Woodward | 2,014 | 42.0 | ||
Conservative | Melvyn Shepherd | 1,959 | 40.8 | ||
Liberal Democrats | Andrew Swift | 826 | 17.2 | ||
Turnout | 4,799 | 65.3 | |||
Registered electors | 7,345 |
Party | Candidate | Votes | % | ±% | |
---|---|---|---|---|---|
Labour | John Stocks | 3,294 | 49.6 | ||
Conservative | Graham Kilbourne | 2,005 | 30.2 | ||
Independent | Grant Withers | 1,339 | 20.2 | ||
Turnout | 6,638 | 63.6 | |||
Registered electors | 10,444 |
Party | Candidate | Votes | % | ±% | |
---|---|---|---|---|---|
Labour | Christopher Preston | 2,725 | 49.5 | ||
Conservative | Eric Collin | 1,927 | 35.0 | ||
Liberal Democrats | Anthony Gillam | 848 | 15.4 | ||
Turnout | 5,500 | 61.5 | |||
Registered electors | 8,943 |
Party | Candidate | Votes | % | ±% | |
---|---|---|---|---|---|
Liberal Democrats | Raymond Poynter | 2,815 | 43.3 | ||
Conservative | Alan Bexon | 2,206 | 33.9 | ||
Labour | Jim Creamer | 1,480 | 22.8 | ||
Turnout | 6,501 | 67.5 | |||
Registered electors | 9,638 |
Party | Candidate | Votes | % | ±% | |
---|---|---|---|---|---|
Labour | John Clarke | 3,644 | 49.7 | ||
Conservative | Richard Robinson | 2,525 | 34.4 | ||
Liberal Democrats | Andrew Dunkin | 901 | 12.3 | ||
Green | Jean Katimertzis | 269 | 3.7 | ||
Turnout | 7,339 | 57.2 | |||
Registered electors | 12,837 |
Party | Candidate | Votes | % | ±% | |
---|---|---|---|---|---|
Labour | Darrell Pulk | 2,794 | 49.5 | ||
Conservative | G Clarke | 2,137 | 37.9 | ||
Liberal Democrats | P Hughes | 712 | 12.6 | ||
Turnout | 5,643 | 62.5 | |||
Registered electors | 9,031 |
Party | Candidate | Votes | % | ±% | |
---|---|---|---|---|---|
Conservative | Joe Lonergan | 3,481 | 55.6 | ||
Labour | John Knight | 2,780 | 44.4 | ||
Turnout | 6,261 | 62.9 | |||
Registered electors | 9,956 |
(9 seats, 9 electoral divisions)
Mansfield District | |||||||||||||||
---|---|---|---|---|---|---|---|---|---|---|---|---|---|---|---|
Party | Candidates | Votes | |||||||||||||
Stood | Elected | Gained | Unseated | Net | % of total | % | No. | Net % | |||||||
Labour | 9 | 8 | 53.0 | 22,096 | |||||||||||
Conservative | 9 | 1 | 26.7 | 11,135 | |||||||||||
Liberal Democrats | 6 | 0 | 12.1 | 5,043 | |||||||||||
Independent | 3 | 0 | 0 | 0 | 5.4 | 2,268 | |||||||||
Green | 3 | 0 | 0 | 0 | 2.7 | 1,146 |
Mansfield Turnout | ||||
---|---|---|---|---|
Registered electors | 76,074 | |||
Votes cast | 41,688 | |||
Turnout | 54.8% |
Party | Candidate | Votes | % | ±% | |
---|---|---|---|---|---|
Labour | Rita Sharpe | 2,481 | 56.1 | ||
Conservative | M Allen | 767 | 17.3 | ||
Independent | C Hallam | 626 | 14.2 | ||
Liberal Democrats | J Smith | 550 | 12.4 | ||
Turnout | 4,424 | 51.6 | |||
Registered electors | 8,575 |
Party | Candidate | Votes | % | ±% | |
---|---|---|---|---|---|
Labour | Parry Tsimbiridis | 2,836 | 47.4 | ||
Conservative | P Moss | 1,647 | 27.6 | ||
Liberal Democrats | D Rumley | 1,182 | 19.8 | ||
Green | M Comerford | 313 | 5.2 | ||
Turnout | 5,978 | 55.1 | |||
Registered electors | 10,841 |
Party | Candidate | Votes | % | ±% | |
---|---|---|---|---|---|
Labour | Reginald Strauther | 2,470 | 55.7 | ||
Conservative | K Ball | 1,116 | 25.1 | ||
Liberal Democrats | J Smith | 852 | 19.2 | ||
Turnout | 4,438 | 54.4 | |||
Registered electors | 8,163 |
Party | Candidate | Votes | % | ±% | |
---|---|---|---|---|---|
Labour | Terence Butler | 1,948 | 49.1 | ||
Conservative | K Rees | 1,090 | 27.5 | ||
Liberal Democrats | M Knight | 656 | 16.5 | ||
Green | J Frost | 274 | 6.9 | ||
Turnout | 3,968 | 55.6 | |||
Registered electors | 7,138 |
Party | Candidate | Votes | % | ±% | |
---|---|---|---|---|---|
Conservative | Kathryn Allsop | 2,738 | 47.2 | ||
Labour | B Mason | 1,913 | 33.0 | ||
Liberal Democrats | M Leal | 1,146 | 19.8 | ||
Turnout | 5,797 | 63.3 | |||
Registered electors | 9,161 |
Party | Candidate | Votes | % | ±% | |
---|---|---|---|---|---|
Labour | John Carter | 2,147 | 56.1 | ||
Independent | M Button | 1,055 | 27.5 | ||
Conservative | B Freeman | 628 | 16.4 | ||
Turnout | 3,830 | 54.6 | |||
Registered electors | 7,018 |
Party | Candidate | Votes | % | ±% | |
---|---|---|---|---|---|
Labour | Joyce Bosnjak | 2,134 | 49.1 | ||
Conservative | N Bradshaw | 972 | 22.3 | ||
Liberal Democrats | P Smith | 657 | 15.1 | ||
Independent | C Smith | 587 | 13.5 | ||
Turnout | 4,350 | 50.7 | |||
Registered electors | 8,582 |
Party | Candidate | Votes | % | ±% | |
---|---|---|---|---|---|
Labour | Chris Winterton | 2,257 | 60.9 | ||
Conservative | D Hatton | 892 | 24.1 | ||
Green | M J Jackson | 559 | 15.1 | ||
Turnout | 3,708 | 50.2 | |||
Registered electors | 7,383 |
Party | Candidate | Votes | % | ±% | |
---|---|---|---|---|---|
Labour | Brian Smith | 3,910 | 75.3 | ||
Conservative | K Allsop | 1,285 | 24.7 | ||
Turnout | 5,195 | 56.4 | |||
Registered electors | 9,213 |
(9 seats, 9 electoral divisions)
Newark and Sherwood District | |||||||||||||||
---|---|---|---|---|---|---|---|---|---|---|---|---|---|---|---|
Party | Candidates | Votes | |||||||||||||
Stood | Elected | Gained | Unseated | Net | % of total | % | No. | Net % | |||||||
Conservative | 9 | 5 | 39.0 | 20,514 | |||||||||||
Labour | 9 | 4 | 37.8 | 19,904 | |||||||||||
Liberal Democrats | 6 | 0 | 17.1 | 8,979 | |||||||||||
Independent | 4 | 0 | 0 | 0 | 6.1 | 3,195 |
Newark and Sherwood Turnout | ||||
---|---|---|---|---|
Registered electors | 83,670 | |||
Votes cast | 52,592 | |||
Turnout | 62.9% |
Party | Candidate | Votes | % | ±% | |
---|---|---|---|---|---|
Conservative | Keith Walker | 3,042 | 43.4 | ||
Labour | A Hannaford | 2,249 | 32.1 | ||
Liberal Democrats | N Allen | 976 | 13.9 | ||
Independent | D Logue | 744 | 10.6 | ||
Turnout | 7,011 | 63.2 | |||
Registered electors | 11,087 |
Party | Candidate | Votes | % | ±% | |
---|---|---|---|---|---|
Labour | Yvonne Woodhead | 2,357 | 58.9 | ||
Independent | Geoff Merry | 899 | 22.5 | ||
Conservative | Neil Dean | 743 | 18.6 | ||
Turnout | 3,999 | 55.3 | |||
Registered electors | 7,233 |
Party | Candidate | Votes | % | ±% | |
---|---|---|---|---|---|
Conservative | Bruce Laughton | 3,225 | 42.0 | ||
Liberal Democrats | Brendan Haigh | 2,714 | 35.4 | ||
Labour | David Bates | 1,731 | 22.6 | ||
Turnout | 7,670 | 70.6 | |||
Registered electors | 10,868 |
Party | Candidate | Votes | % | ±% | |
---|---|---|---|---|---|
Conservative | Vincent Dobson | 3,337 | 53.5 | ||
Labour | Desmond Whicher | 1,606 | 25.7 | ||
Liberal Democrats | Marylyn Rayner | 1,294 | 20.7 | ||
Turnout | 6,237 | 67.3 | |||
Registered electors | 9,266 |
Party | Candidate | Votes | % | ±% | |
---|---|---|---|---|---|
Conservative | Peter Prebble | 2,087 | 38.8 | ||
Labour | Victor Hall | 2,040 | 37.9 | ||
Liberal Democrats | Gillian Dawn | 1,252 | 23.3 | ||
Turnout | 5,379 | 56.0 | |||
Registered electors | 9,599 |
Party | Candidate | Votes | % | ±% | |
---|---|---|---|---|---|
Labour | Colin Bromfield | 1,857 | 55.5 | ||
Conservative | Ann Marshall | 1,101 | 32.9 | ||
Liberal Democrats | Francis Higson | 388 | 11.6 | ||
Turnout | 3,346 | 52.8 | |||
Registered electors | 6,337 |
Party | Candidate | Votes | % | ±% | |
---|---|---|---|---|---|
Labour | Stella Smedley | 3,739 | 71.1 | ||
Conservative | Brian Jarvis | 1,522 | 28.9 | ||
Turnout | 5,261 | 56.7 | |||
Registered electors | 9,275 |
Party | Candidate | Votes | % | ±% | |
---|---|---|---|---|---|
Labour | Andrew Freeman | 2,673 | 52.3 | ||
Conservative | Mary Brown | 1,347 | 26.4 | ||
Independent | Samuel Dunlop | 1,088 | 21.3 | ||
Turnout | 5,108 | 60.9 | |||
Registered electors | 8,381 |
Party | Candidate | Votes | % | ±% | |
---|---|---|---|---|---|
Conservative | Samuel Stuart | 4,110 | 47.9 | ||
Liberal Democrats | John Baker | 2,355 | 27.4 | ||
Labour | Neil Fawkes | 1,652 | 19.3 | ||
Independent | Timothy Cutler | 464 | 5.4 | ||
Turnout | 8,581 | 73.8 | |||
Registered electors | 11,624 |
(9 seats, 9 electoral divisions)
Rushcliffe District | |||||||||||||||
---|---|---|---|---|---|---|---|---|---|---|---|---|---|---|---|
Party | Candidates | Votes | |||||||||||||
Stood | Elected | Gained | Unseated | Net | % of total | % | No. | Net % | |||||||
Conservative | 9 | 7 | 44.4 | 24,359 | |||||||||||
Labour | 9 | 1 | 31.6 | 17,359 | |||||||||||
Liberal Democrats | 9 | 1 | 24.0 | 13,162 |
Rushcliffe Turnout | ||||
---|---|---|---|---|
Registered electors | 82,324 | |||
Votes cast | 54,880 | |||
Turnout | 66.7% |
Party | Candidate | Votes | % | ±% | |
---|---|---|---|---|---|
Conservative | Martin Suthers | 3,409 | 45.0 | ||
Liberal Democrats | George Davidson | 2,096 | 27.7 | ||
Labour | Avril Bear | 2,072 | 27.3 | ||
Turnout | 7,577 | 66.6 | |||
Registered electors | 11,376 |
Party | Candidate | Votes | % | ±% | |
---|---|---|---|---|---|
Conservative | Richard Butler | 2,790 | 44.1 | ||
Labour | P Morrissey | 2,507 | 39.6 | ||
Liberal Democrats | S Hull | 1,036 | 16.4 | ||
Turnout | 6,333 | 64.5 | |||
Registered electors | 9,816 |
Party | Candidate | Votes | % | ±% | |
---|---|---|---|---|---|
Conservative | Kenneth O'Toole | 2,771 | 47.1 | ||
Labour | Paul Jacques | 2,132 | 36.2 | ||
Liberal Democrats | Daphne Butler | 984 | 16.7 | ||
Turnout | 5,887 | 66.4 | |||
Registered electors | 8,870 |
Party | Candidate | Votes | % | ±% | |
---|---|---|---|---|---|
Conservative | John Cottee | 2,852 | 48.5 | ||
Liberal Democrats | Samuel Boote | 2,227 | 37.9 | ||
Labour | Penelope Oldridge | 797 | 13.6 | ||
Turnout | 5,876 | 71.7 | |||
Registered electors | 8,192 |
Party | Candidate | Votes | % | ±% | |
---|---|---|---|---|---|
Conservative | Kay Cutts | 2,492 | 51.9 | ||
Labour | E Gamble | 1,459 | 30.4 | ||
Liberal Democrats | D Allen | 853 | 17.8 | ||
Turnout | 4,804 | 66.3 | |||
Registered electors | 7,250 |
Party | Candidate | Votes | % | ±% | |
---|---|---|---|---|---|
Liberal Democrats | Susan Bennett | 2,086 | 41.2 | ||
Conservative | Reg Adair | 2,083 | 41.2 | ||
Labour | A Clayworth | 889 | 17.6 | ||
Turnout | 5,058 | 69.7 | |||
Registered electors | 7,259 |
Party | Candidate | Votes | % | ±% | |
---|---|---|---|---|---|
Labour | Graham Jackson | 3,116 | 46.8 | ||
Conservative | Timothy Spencer | 2,333 | 35.0 | ||
Liberal Democrats | Christopher Evans | 1,215 | 18.2 | ||
Turnout | 6,664 | 66.4 | |||
Registered electors | 10,029 |
Party | Candidate | Votes | % | ±% | |
---|---|---|---|---|---|
Conservative | Michael Cox | 2,742 | 47.4 | ||
Labour | Gillian Aldridge | 1,748 | 30.2 | ||
Liberal Democrats | Lawrence Porter | 1,297 | 22.4 | ||
Turnout | 5,787 | 68.1 | |||
Registered electors | 8,504 |
Party | Candidate | Votes | % | ±% | |
---|---|---|---|---|---|
Conservative | Martin Brandon-Bravo | 2,887 | 41.9 | ||
Labour | A MacInnes | 2,639 | 38.3 | ||
Liberal Democrats | J Banks | 1,368 | 19.8 | ||
Turnout | 6,894 | 62.5 | |||
Registered electors | 11,028 |
Rushcliffe is a constituency in Nottinghamshire represented in the House of Commons of the UK Parliament from 2024 by James Naish, a Labour MP.
Bassetlaw is a parliamentary constituency in Nottinghamshire, represented in the House of Commons of the UK Parliament since the 2024 general election by Jo White, a Labour Party candidate. Before the 2019 general election, the seat had been part of the so-called "red wall", being held by the Labour Party since 1935 before falling to the Conservative Party.
Cornwall Council in England, UK, was established in 2009 and is elected every four years. From 1973 to 2005 elections were for Cornwall County Council, with the first election for the new unitary Cornwall Council held in June 2009. This election saw 123 members elected, replacing the previous 82 councillors on Cornwall County Council and the 249 on the six district and borough councils. In June 2013 the Local Government Boundary Commission for England announced a public consultation on its proposal that Cornwall Council should have 87 councillors in future.
Newark and Sherwood District Council elections are held every four years. Newark and Sherwood District Council is the local authority for the non-metropolitan district of Newark and Sherwood in Nottinghamshire, England. Since the last boundary changes in 2015, 39 councillors have been elected from 21 wards.
Nottinghamshire County Council elections are held every four years. Nottinghamshire County Council is the upper-tier authority for the non-metropolitan county of Nottinghamshire in England. Since the last boundary changes in 2017, 66 county councillors have been elected from 56 electoral divisions.
Nottinghamshire County Council is the upper-tier local authority for the non-metropolitan county of Nottinghamshire in England. It consists of 66 county councillors, elected from 56 electoral divisions every four years. The most recent election was held in 2021.
Elections to Nottinghamshire County Council took place on 4 June 2009, having been delayed from 7 May, in order to coincide with elections to the European Parliament.
Local elections were held in the United Kingdom in May 1981.
The Nottinghamshire County Council Election took place on 2 May 2013 as part of the 2013 United Kingdom local elections.
The 2017 United Kingdom local elections were held on Thursday 4 May 2017. Local elections were held across Great Britain, with elections to 35 English local authorities and all councils in Scotland and Wales.
The 1981 Nottinghamshire County Council election was held on Thursday, 7 May. Following boundary changes to the county's electoral divisions, the whole council of eighty-eight members was up for election. The Labour Party regained control from the Conservatives, winning fifty-five seats. The Conservatives won thirty-two councillors and one Residents' association councillor was elected in the Hucknall East division.
The 1985 Nottinghamshire County Council election was held on Thursday, 2 May 1985. The whole council of eighty-eight members was up for election and the result was that the Labour Party retained control of the Council, winning forty-eight seats. The Conservatives won thirty-seven councillors and the SDP–Liberal Alliance made gains in terms of percentage vote share, but won just two seats. An Independent councillor was elected in the Retford North division.
The 1989 Nottinghamshire County Council election was held on Thursday, 4 May 1989. The whole council of eighty-eight members was up for election and the result was that the Labour Party retained control of the Council, winning fifty seats. The Conservatives won thirty-four councillors and the Social and Liberal Democrats won four seats.
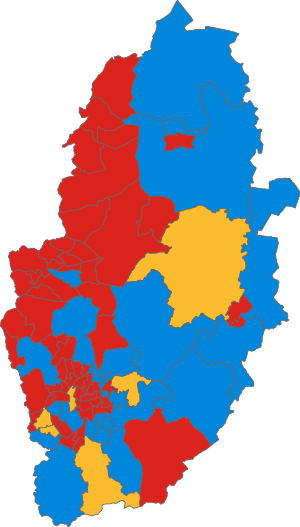
The 1993 Nottinghamshire County Council election was held on Thursday, 6 May 1993. The whole council of eighty-eight members was up for election.
The 1997 Nottinghamshire County Council election was held on Thursday, 1 May 1997. The whole council was up for election and the result was the Labour Party retaining its control of the council.
The 2005 Nottinghamshire County Council election was held on Thursday, 5 May 2005, the same day as the 2005 UK General Election. The whole council was up for election and the Labour Party retained control of the council.
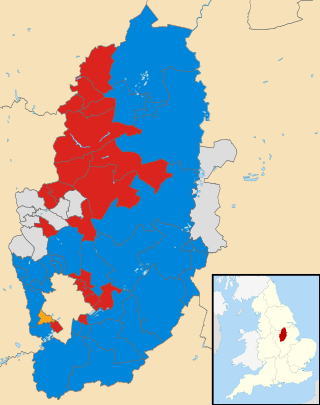
The 2017 Nottinghamshire County Council election took place on 4 May 2017 as part of the 2017 local elections in the United Kingdom. The whole council of 66 councillors was elected for a four-year term spanning 56 electoral divisions, a minority of which return two councillors. The voting system used is first-past-the-post.
The 1973 Nottinghamshire County Council election was held on Thursday, 12 April 1973. The election resulted in the Labour Party winning an overall majority of seats on the council.
The 1977 Nottinghamshire County Council election was held on Thursday, 5 May 1977. The election resulted in a landslide victory for the Conservative Party, which won 66 of the 89 seats on the county council. The Labour Party won just 20 seats, compared to 54 at the previous election.
The 2021 Nottinghamshire County Council election took place on 6 May 2021 as part of the 2021 local elections in the United Kingdom. All 66 councillors were elected from 56 electoral divisions, which returned either one or two county councillors each by first-past-the-post voting for a four-year term of office.