| |||||||||||||||||||||
All 73 seats in the Northamptonshire County Council 37 seats needed for a majority | |||||||||||||||||||||
---|---|---|---|---|---|---|---|---|---|---|---|---|---|---|---|---|---|---|---|---|---|
| |||||||||||||||||||||
Map showing the results of the 2001 Northamptonshire County Council elections. | |||||||||||||||||||||
|
The 2001 Northamptonshire County Council election took place on 7 June 2001 to elect members of Northamptonshire County Council, England. The whole council was up for election and the Labour Party retained overall control of the council, which it had held since 1993. [2]
Party | Candidate | Votes | % | |
---|---|---|---|---|
Labour | M. Bullock | 2,446 | 69.3 | |
Conservative | R. Tustin | 667 | 18.9 | |
Liberal Democrats | P. McGowan | 418 | 11.8 | |
Majority | 1,779 | 50.4 | ||
Turnout | 3,531 | 57.2 | ||
Party | Candidate | Votes | % | |
---|---|---|---|---|
Labour | J.Wade | 2,523 | 56.6 | |
Conservative | S. Heggs | 1,938 | 43.4 | |
Majority | 585 | 13.1 | ||
Turnout | 4,461 | 65.6 | ||
Party | Candidate | Votes | % | |
---|---|---|---|---|
Labour | J. McKellar | 2,090 | 55.6 | |
Conservative | B. Howard | 937 | 24.9 | |
Liberal Democrats | C. Stanbra | 730 | 19.4 | |
Majority | 1,153 | 30.7 | ||
Turnout | 3,757 | 60.9 | ||
Party | Candidate | Votes | % | |
---|---|---|---|---|
Labour | A. Bell | 2,659 | 72.6 | |
Conservative | A. Girvin | 1,002 | 27.4 | |
Majority | 1,657 | 45.3 | ||
Turnout | 3,661 | 53.7 | ||
Party | Candidate | Votes | % | |
---|---|---|---|---|
Labour | J. Kane | 3,035 | 73.8 | |
Conservative | G. Ellenton | 1,075 | 26.2 | |
Majority | 1,960 | 47.7 | ||
Turnout | 4,110 | 64.4 | ||
Party | Candidate | Votes | % | |
---|---|---|---|---|
Labour | J. Forshaw | 3,139 | 72.5 | |
Conservative | C. Woolmer | 1,190 | 27.5 | |
Majority | 1,949 | 45.0 | ||
Turnout | 4,329 | 60.6 | ||
Party | Candidate | Votes | % | |
---|---|---|---|---|
Conservative | E. Williams | 2,829 | 58.7 | |
Labour | K. Ritchie | 1,994 | 41.3 | |
Majority | 835 | 17.3 | ||
Turnout | 4,823 | 66.7 | ||
Party | Candidate | Votes | % | |
---|---|---|---|---|
Conservative | J. Millar | 2,632 | 51.9 | |
Labour | M. Davenport | 1,223 | 24.1 | |
Liberal Democrats | M. Nice | 1,216 | 24.0 | |
Majority | 1,409 | 27.8 | ||
Turnout | 5,071 | 68.5 | ||
Party | Candidate | Votes | % | |
---|---|---|---|---|
Labour | J. Penrose | 2,005 | 53.7 | |
Conservative | S. Osborne | 1,731 | 46.3 | |
Majority | 274 | 7.3 | ||
Turnout | 3,736 | 53.7 | ||
Party | Candidate | Votes | % | |
---|---|---|---|---|
Labour | O. Loud | 2,355 | 60.8 | |
Conservative | Annette Dunn | 1,521 | 39.2 | |
Majority | 834 | 21.5 | ||
Turnout | 3,876 | 51.6 | ||
Party | Candidate | Votes | % | |
---|---|---|---|---|
Conservative | J. Shephard | 2,310 | 55.0 | |
Labour | M. Hanly | 1,113 | 26.5 | |
Labour | B. Luck | 774 | 18.4 | |
Majority | 1,197 | 28.5 | ||
Turnout | 4,197 | 69.5 | ||
Party | Candidate | Votes | % | |
---|---|---|---|---|
Conservative | A. Tebbutt | 3,004 | 58.2 | |
Labour | J. Corkill | 1,313 | 25.4 | |
Green | J. Hurst | 844 | 16.4 | |
Majority | 1,691 | 32.8 | ||
Turnout | 5,161 | 71.2 | ||
Party | Candidate | Votes | % | |
---|---|---|---|---|
Conservative | Gina Ogden | 2,531 | 60.5 | |
Labour | Malcolm Adcock | 1,650 | 39.5 | |
Majority | 881 | 21.1 | ||
Turnout | 4,181 | 62.9 | ||
Party | Candidate | Votes | % | |
---|---|---|---|---|
Conservative | D. Lawson | 2,549 | 55.5 | |
Labour | A. Dunn | 2,046 | 44.5 | |
Majority | 503 | 10.9 | ||
Turnout | 4,595 | 67.3 | ||
Party | Candidate | Votes | % | |
---|---|---|---|---|
Labour | D. Lee | 2,141 | 50.2 | |
Conservative | S. Hobbs | 2,123 | 49.8 | |
Majority | 18 | 0.4 | ||
Turnout | 4,264 | 61.2 | ||
Party | Candidate | Votes | % | |
---|---|---|---|---|
Conservative | C. Reichhold | 2,452 | 51.1 | |
Labour | J. Brookfield | 1,845 | 38.5 | |
Independent | J. Smoker | 497 | 10.4 | |
Majority | 607 | 12.7 | ||
Turnout | 4,794 | 70.3 | ||
Party | Candidate | Votes | % | |
---|---|---|---|---|
Conservative | P. Padley | 2,920 | 70.3 | |
Labour | R. Whitehad | 1,233 | 29.7 | |
Majority | 1,687 | 71.4 | ||
Turnout | 4,153 | 40.6 | ||
Party | Candidate | Votes | % | |
---|---|---|---|---|
Labour | G. Sharman | 2,011 | 50.9 | |
Conservative | S. Roberts | 1,937 | 49.1 | |
Majority | 74 | 1.9 | ||
Turnout | 3,948 | 61.2 | ||
Party | Candidate | Votes | % | |
---|---|---|---|---|
Labour | L. Cox | 1,703 | 44.0 | |
Conservative | C. Wood | 1,641 | 42.4 | |
Liberal Democrats | David Hooton | 529 | 13.7 | |
Majority | 62 | 1.6 | ||
Turnout | 3,873 | 56.5 | ||
Party | Candidate | Votes | % | |
---|---|---|---|---|
Conservative | M. Tye | 2,363 | 54.6 | |
Labour | L. Rolfe | 1,964 | 45.4 | |
Majority | 399 | 9.2 | ||
Turnout | 4,327 | 62.7 | ||
Party | Candidate | Votes | % | |
---|---|---|---|---|
Labour | F. Jones | 1,883 | 52.4 | |
Conservative | R. Pinnock | 1,712 | 47.6 | |
Majority | 171 | 4.8 | ||
Turnout | 3,595 | 57.7 | ||
Party | Candidate | Votes | % | |
---|---|---|---|---|
Conservative | B. Seery | 2,529 | 57.1 | |
Labour | M. Whiteman | 1,578 | 35.6 | |
UKIP | P. Baden | 322 | 7.3 | |
Majority | 951 | 21.5 | ||
Turnout | 4,429 | 67.6 | ||
Party | Candidate | Votes | % | |
---|---|---|---|---|
Labour | A. Chambers | 1,784 | 44.2 | |
Conservative | G. Smith | 1,713 | 42.4 | |
Liberal Democrats | J. Richardson | 540 | 13.4 | |
Majority | 71 | 1.8 | ||
Turnout | 4,037 | 69.9 | ||
Party | Candidate | Votes | % | |
---|---|---|---|---|
Conservative | C. Lamb | 1,709 | 38.9 | |
Labour | A. Gordon | 1,657 | 37.7 | |
Liberal Democrats | K. Simons | 1,026 | 23.4 | |
Majority | 52 | 1.2 | ||
Turnout | 4,392 | 67.0 | ||
Party | Candidate | Votes | % | |
---|---|---|---|---|
Labour | D. Coe | 2,079 | 47.9 | |
Conservative | B. Glynane | 1,861 | 42.9 | |
Liberal Democrats | M. Hill | 401 | 9.2 | |
Majority | 218 | 5.0 | ||
Turnout | 4,341 | 69.7 | ||
Party | Candidate | Votes | % | |
---|---|---|---|---|
Labour | R. Mayhew | 2,095 | 62.6 | |
Conservative | K. Marsh | 911 | 27.2 | |
Liberal Democrats | F. Peacock | 340 | 10.2 | |
Majority | 1,184 | 35.4 | ||
Turnout | 3,346 | 58.9 | ||
Party | Candidate | Votes | % | |
---|---|---|---|---|
Conservative | R. Baker | 1,824 | 43.1 | |
Labour | G. Marshall | 1,806 | 42.7 | |
Liberal Democrats | V. McGlynn | 604 | 14.3 | |
Majority | 18 | 0.4 | ||
Turnout | 4,234 | 67.9 | ||
Party | Candidate | Votes | % | |
---|---|---|---|---|
Labour | I. Watts | 2,153 | 52.9 | |
Conservative | J. Harker | 1,372 | 33.7 | |
Liberal Democrats | C. McGlynn | 543 | 13.3 | |
Majority | 781 | 19.2 | ||
Turnout | 4,068 | 60.8 | ||
Party | Candidate | Votes | % | |
---|---|---|---|---|
Conservative | J. Harker | 3,015 | 56.6 | |
Labour | R. Smith | 1,553 | 29.2 | |
Liberal Democrats | J. Prentice | 755 | 14.2 | |
Majority | 1,461 | 27.5 | ||
Turnout | 5,323 | 74.9 | ||
Party | Candidate | Votes | % | |
---|---|---|---|---|
Labour | D. Whyte | 1,996 | 53.9 | |
Conservative | M. Spendlove | 1,704 | 46.1 | |
Majority | 292 | 7.9 | ||
Turnout | 3,700 | 66.8 | ||
Party | Candidate | Votes | % | |
---|---|---|---|---|
Labour | J. West | 2,285 | 55.2 | |
Conservative | T. Freer | 1,858 | 44.8 | |
Majority | 427 | 10.3 | ||
Turnout | 4,143 | 59.9 | ||
Party | Candidate | Votes | % | |
---|---|---|---|---|
Conservative | W. Parker | 1,917 | 40.2 | |
Labour | J. Connolly | 1,851 | 38.8 | |
Liberal Democrats | J. Coleman | 1,000 | 21.0 | |
Majority | 66 | 1.4 | ||
Turnout | 4,768 | 68.4 | ||
Party | Candidate | Votes | % | |
---|---|---|---|---|
Labour | M. Boss | 1,780 | 49.7 | |
Conservative | J. Ashby | 965 | 26.9 | |
Liberal Democrats | C. Markham | 839 | 23.4 | |
Majority | 815 | 22.7 | ||
Turnout | 3,584 | 56.0 | ||
Party | Candidate | Votes | % | |
---|---|---|---|---|
Labour | W. Strachan | 1,500 | 43.6 | |
Conservative | J. Duncan | 1,377 | 40.0 | |
Liberal Democrats | L. Felstead | 566 | 16.4 | |
Majority | 123 | 3.6 | ||
Turnout | 3,443 | 51.8 | ||
Party | Candidate | Votes | % | |
---|---|---|---|---|
Labour | B. Kirby | 1,661 | 39.2 | |
Conservative | I. McCann | 1,298 | 30.6 | |
Liberal Democrats | J. Yates | 1,282 | 30.2 | |
Majority | 363 | 8.6 | ||
Turnout | 4,241 | 62.6 | ||
Party | Candidate | Votes | % | |
---|---|---|---|---|
Labour | R. Dickie | 2,023 | 60.8 | |
Conservative | E. Barham | 677 | 20.3 | |
Liberal Democrats | G. Bowles | 528 | 15.9 | |
Independent | P. Harrisson | 100 | 3.0 | |
Majority | 1,346 | 40.4 | ||
Turnout | 3,328 | 47.6 | ||
Party | Candidate | Votes | % | |
---|---|---|---|---|
Labour | C. Kalyan | 1,591 | 46.7 | |
Liberal Democrats | B. Glynane | 923 | 27.1 | |
Conservative | M. Hill | 893 | 26.2 | |
Majority | 668 | 19.6 | ||
Turnout | 3,407 | 55.5 | ||
Party | Candidate | Votes | % | |
---|---|---|---|---|
Labour | M. Thomas | 2,007 | 50.9 | |
Conservative | L. Percival | 1,205 | 30.6 | |
Liberal Democrats | B. Dee | 728 | 18.5 | |
Majority | 802 | 20.4 | ||
Turnout | 2,855 | 58.4 | ||
Party | Candidate | Votes | % | |
---|---|---|---|---|
Conservative | J. Nunn | 1,789 | 46.7 | |
Labour | T. Bailey | 1,343 | 35.0 | |
Liberal Democrats | S. Battison | 700 | 18.3 | |
Majority | 446 | 11.6 | ||
Turnout | 3,832 | 57.8 | ||
Party | Candidate | Votes | % | |
---|---|---|---|---|
Labour | P. Concannon | 1,331 | 45.5 | |
Conservative | J. Lane | 1,124 | 38.4 | |
Liberal Democrats | R. Baldwin | 641 | 16.0 | |
Majority | 207 | 7.1 | ||
Turnout | 2,964 | 54.1 | ||
Party | Candidate | Votes | % | |
---|---|---|---|---|
Labour | V. Dams | 1,562 | 35.9 | |
Conservative | G. Hawker | 1,440 | 33.1 | |
Liberal Democrats | S. Hope | 1,349 | 31.0 | |
Majority | 122 | 2.8 | ||
Turnout | 4,351 | 66.8 | ||
Party | Candidate | Votes | % | |
---|---|---|---|---|
Labour | J. Dixon | 1,592 | 40.4 | |
Liberal Democrats | R. Church | 1,517 | 38.5 | |
Conservative | G. Austin | 829 | 21.1 | |
Majority | 75 | 1.9 | ||
Turnout | 3,938 | 55.6 | ||
Party | Candidate | Votes | % | |
---|---|---|---|---|
Liberal Democrats | S. Beardsworth | 1,844 | 45.2 | |
Labour | F. Wire | 1,397 | 34.2 | |
Conservative | M. Miah | 840 | 20.6 | |
Majority | 447 | 11.0 | ||
Turnout | 4,081 | 59.6 | ||
Party | Candidate | Votes | % | |
---|---|---|---|---|
Labour | M. Young | 1,618 | 55.9 | |
Conservative | B. Eldred | 782 | 27.0 | |
Liberal Democrats | M. Taylor | 492 | 17.0 | |
Majority | 836 | 28.9 | ||
Turnout | 2,892 | 47.6 | ||
Party | Candidate | Votes | % | |
---|---|---|---|---|
Conservative | C. Lill | 2,208 | 52.5 | |
Labour | J. Lineker | 1,288 | 30.6 | |
Liberal Democrats | R. Matthews | 711 | 16.9 | |
Majority | 920 | 21.9 | ||
Turnout | 4,207 | 66.3 | ||
Party | Candidate | Votes | % | |
---|---|---|---|---|
Conservative | E. Tavener | 1,958 | 46.6 | |
Labour | P. Evans | 1,638 | 39.0 | |
Liberal Democrats | R. Cant | 608 | 14.5 | |
Majority | 320 | 7.6 | ||
Turnout | 4,204 | 64.0 | ||
Party | Candidate | Votes | % | |
---|---|---|---|---|
Conservative | D. Edwards | 1,802 | 44.0 | |
Labour | A. Kingston | 1,756 | 42.9 | |
Liberal Democrats | C. Squires | 536 | 13.1 | |
Majority | 46 | 1.1 | ||
Turnout | 4,094 | 63.6 | ||
Party | Candidate | Votes | % | |
---|---|---|---|---|
Conservative | W. Massey | 1,733 | 41.4 | |
Labour | F. Lilley | 1,685 | 40.3 | |
Liberal Democrats | I. Wright | 767 | 18.3 | |
Majority | 48 | 1.1 | ||
Turnout | 4,185 | 66.9 | ||
Party | Candidate | Votes | % | |
---|---|---|---|---|
Labour | J. Bains | 1,696 | 59.4 | |
Conservative | B. Wright | 694 | 24.3 | |
Liberal Democrats | I. Markham | 465 | 16.3 | |
Majority | 1,002 | 35.1 | ||
Turnout | 2,855 | 47.4 | ||
Party | Candidate | Votes | % | |
---|---|---|---|---|
Labour | A. McCutcheon | 1,545 | 51.0 | |
Conservative | D. Clark | 864 | 28.5 | |
Liberal Democrats | M. Hoare | 535 | 17.7 | |
Independent | T. Harvey | 83 | 2.7 | |
Majority | 681 | 22.5 | ||
Turnout | 3,007 | 47.9 | ||
Party | Candidate | Votes | % | |
---|---|---|---|---|
Labour | J. Gardner | 1,530 | 47.0 | |
Liberal Democrats | N. Felstead | 967 | 29.7 | |
Conservative | J. Cartwright | 757 | 23.3 | |
Majority | 563 | 17.3 | ||
Turnout | 3,254 | 48.1 | ||
Party | Candidate | Votes | % | |
---|---|---|---|---|
Labour | T. Wire | 1,805 | 52.0 | |
Conservative | A. Wright | 1,157 | 33.4 | |
Liberal Democrats | M. Minney | 506 | 14.6 | |
Majority | 648 | 18.7 | ||
Turnout | 3,468 | 54.2 | ||
Party | Candidate | Votes | % | |
---|---|---|---|---|
Labour | L. Patterson | 1,550 | 55.0 | |
Conservative | J. Cartwright | 858 | 30.5 | |
Liberal Democrats | M. Taylor | 408 | 14.5 | |
Majority | 692 | 24.6 | ||
Turnout | 2,816 | 49.9 | ||
Party | Candidate | Votes | % | |
---|---|---|---|---|
Conservative | C. Hugheston-Roberts | 1,367 | 39.7 | |
Liberal Democrats | J. Hope | 1,044 | 30.3 | |
Labour | U. Gravesande | 886 | 25.7 | |
UKIP | D. Clark | 146 | 4.2 | |
Majority | 323 | 9.4 | ||
Turnout | 3,443 | 62.0 | ||
Party | Candidate | Votes | % | |
---|---|---|---|---|
Conservative | M. Hill | 2,437 | 51.4 | |
Labour | M. Cleaves | 1,485 | 31.3 | |
Liberal Democrats | J. Cramp | 815 | 17.2 | |
Majority | 952 | 20.1 | ||
Turnout | 4,737 | 68.9 | ||
Party | Candidate | Votes | % | |
---|---|---|---|---|
Conservative | J. Shepherd-Cross | 2,578 | 56.4 | |
Labour | P. Sceeny | 1,994 | 43.6 | |
Majority | 584 | 12.8 | ||
Turnout | 4,572 | 61.0 | ||
Party | Candidate | Votes | % | |
---|---|---|---|---|
Conservative | R. Sawbridge | 2,056 | 50.4 | |
Liberal Democrats | I. Franklin | 1,094 | 26.8 | |
Labour | G. Youens | 931 | 22.8 | |
Majority | 962 | 23.6 | ||
Turnout | 4,081 | 66.1 | ||
Party | Candidate | Votes | % | |
---|---|---|---|---|
Conservative | J. Kirkbride | 2,680 | 59.4 | |
Labour | R. Johnson | 944 | 20.9 | |
Liberal Democrats | S. Pace | 887 | 19.7 | |
Majority | 1,736 | 38.5 | ||
Turnout | 4,511 | 70.8 | ||
Party | Candidate | Votes | % | |
---|---|---|---|---|
Conservative | A. Walker | 2,526 | 57.2 | |
Labour | V. Whitaker | 1,892 | 42.8 | |
Majority | 634 | 14.4 | ||
Turnout | 4,418 | 69.1 | ||
Party | Candidate | Votes | % | |
---|---|---|---|---|
Conservative | B. Smith | 3,301 | 67.6 | |
Labour | D. Wardle | 1,582 | 32.4 | |
Majority | 1,719 | 35.2 | ||
Turnout | 4,883 | 70.9 | ||
Party | Candidate | Votes | % | |
---|---|---|---|---|
Conservative | B. Binley | 2,811 | 61.0 | |
Labour | R. Foot | 1,171 | 25.4 | |
Liberal Democrats | A. Simpson | 627 | 13.6 | |
Majority | 1,640 | 35.6 | ||
Turnout | 4,609 | 71.3 | ||
Party | Candidate | Votes | % | |
---|---|---|---|---|
Conservative | M. Mildren | 2,771 | 57.5 | |
Labour | C. Fitchett | 2,046 | 42.5 | |
Majority | 725 | 15.1 | ||
Turnout | 4,871 | 66.0 | ||
Party | Candidate | Votes | % | |
---|---|---|---|---|
Conservative | D. Batten | 2,075 | 51.7 | |
Labour | W. Toone | 1,245 | 31.0 | |
Liberal Democrats | S. O'Connor | 693 | 17.3 | |
Majority | 830 | 20.7 | ||
Turnout | 4,043 | 70.2 | ||
Party | Candidate | Votes | % | |
---|---|---|---|---|
Conservative | R. Bromwich | 2,018 | 49.4 | |
Liberal Democrats | J. Calder | 1,048 | 25.6 | |
Labour | H. Kerr | 1,022 | 25.0 | |
Majority | 970 | 23.7 | ||
Turnout | 4,088 | 64.6 | ||
Party | Candidate | Votes | % | |
---|---|---|---|---|
Labour | A. Simon | 2,282 | 50.5 | |
Conservative | C. Benham | 1,624 | 35.9 | |
Liberal Democrats | P. Gaskell | 613 | 13.6 | |
Majority | 658 | 14.6 | ||
Turnout | 4,519 | 58.4 | ||
Party | Candidate | Votes | % | |
---|---|---|---|---|
Labour | G. Blackwell | 2,900 | 56.0 | |
Conservative | P. Bell | 2,275 | 44.0 | |
Majority | 625 | 12.1 | ||
Turnout | 5,175 | 72.6 | ||
Party | Candidate | Votes | % | |
---|---|---|---|---|
Conservative | J. Bailey | 2,809 | 56.6 | |
Labour | L. Warner | 1,504 | 30.3 | |
Liberal Democrats | W. Urmson | 651 | 13.1 | |
Majority | 1,305 | 26.3 | ||
Turnout | 4,964 | 71.4 | ||
Party | Candidate | Votes | % | |
---|---|---|---|---|
Labour | J. Ashton | 2,274 | 54.6 | |
Conservative | Y. Miles | 1,892 | 45.4 | |
Majority | 382 | 9.2 | ||
Turnout | 4,166 | 64.1 | ||
Party | Candidate | Votes | % | |
---|---|---|---|---|
Labour | T. Maguire | 1,989 | 44.6 | |
Conservative | J. Saxby | 1,922 | 43.1 | |
Liberal Democrats | K. Clements | 550 | 12.3 | |
Majority | 57 | 1.5 | ||
Turnout | 4,461 | 71.2 | ||
Party | Candidate | Votes | % | |
---|---|---|---|---|
Labour | P. Jones | 2,115 | 56.6 | |
Conservative | V. Ager | 1,230 | 32.9 | |
Liberal Democrats | P. Thornborow | 395 | 10.6 | |
Majority | 885 | 23.7 | ||
Turnout | 3,740 | 58.3 | ||
c
Party | Candidate | Votes | % | |
---|---|---|---|---|
Conservative | M. Waters | 2,036 | 48.5 | |
Labour | J. Robinson | 1,488 | 35.4 | |
Liberal Democrats | P. Wilkins | 674 | 16.1 | |
Majority | 548 | 13.1 | ||
Turnout | 4,198 | 69.0 | ||
Party | Candidate | Votes | % | |
---|---|---|---|---|
Labour | P. Cass | 2,220 | 53.4 | |
Conservative | J. Read | 1,935 | 46.6 | |
Majority | 285 | 6.9 | ||
Turnout | 4,155 | 64.8 | ||
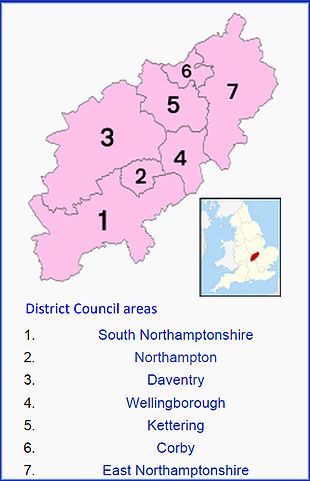
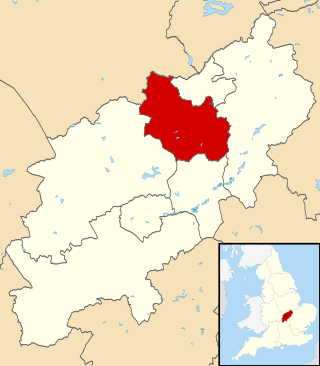
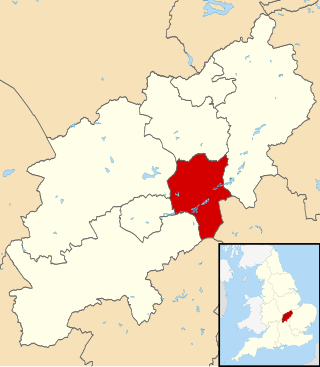
Northamptonshire is a ceremonial county in the East Midlands of England. It is bordered by Leicestershire, Rutland and Lincolnshire to the north, Cambridgeshire to the east, Bedfordshire, Buckinghamshire, Oxfordshire to the south and Warwickshire to the west. Northampton is the largest settlement and the county town.
Corby is a town and civil parish in the North Northamptonshire unitary authority area of Northamptonshire, England. It is located 23 miles (37 km) north-east of Northampton. From 1974 to 2021, the town served as the administrative headquarters of the Borough of Corby. At the 2021 Census, the built-up area had a population of 68,164 while the borough, which was abolished in 2021, had a population of 75,571 in 2021.
The City of Peterborough, commonly known as Peterborough, is a unitary authority district with city status in the ceremonial county of Cambridgeshire, England. The area is named after its largest settlement, Peterborough but also covers a wider area of outlying villages and hamlets.
South Northamptonshire was a local government district in Northamptonshire, England, from 1974 to 2021. Its council was based in the town of Towcester, first established as a settlement in Roman Britain. The population of the Local Authority District Council in 2011 was 85,189.
East Northamptonshire was a local government district in Northamptonshire, England, from 1974 to 2021. Its council was based in Thrapston and Rushden. Other towns included Oundle, Raunds, Irthlingborough and Higham Ferrers. The town of Rushden was by far the largest settlement in the district. The population of the district at the 2011 Census was 86,765.
Daventry District was a local government district in western Northamptonshire, England, from 1974 to 2021. The district was named after its main town of Daventry, where the council was based.
The Borough of Kettering was a local government district and borough in Northamptonshire, England, from 1974 to 2021. It was named after its main town, Kettering, where the council was based. It bordered onto the district of Harborough in the neighbouring county of Leicestershire, the borough of Corby, the district of East Northamptonshire, the district of Daventry and the borough of Wellingborough.
The Borough of Wellingborough was a non-metropolitan district and borough in Northamptonshire, England, from 1974 to 2021. It was named after Wellingborough, its main town, but also included surrounding rural areas.
One third of Daventry District Council in Northamptonshire, England was elected each year, followed by one year when there was an election to Northamptonshire County Council instead. Since the last boundary changes in 1999, 38 councillors were elected from 24 wards. In another boundary review in 2012 the councillors were reduced to 36 councillors across 16 wards. The council was abolished in 2021, with the area becoming part of West Northamptonshire.
Northamptonshire County Council was the county council that governed the non-metropolitan county of Northamptonshire in England. It was originally formed in 1889 by the Local Government Act 1888, recreated in 1974 by the Local Government Act 1972 and abolished in 2021. The headquarters of the council was County Hall in Northampton.
North Northamptonshire is one of two local government districts in Northamptonshire, England. It is a unitary authority area forming about one half of the ceremonial county of Northamptonshire. It was created in 2021. Its council is based in Corby, the district's largest town. Other notable towns are Kettering, Wellingborough, Rushden, Raunds, Desborough, Rothwell, Irthlingborough, Thrapston and Oundle.
West Northamptonshire is a unitary authority area covering part of the ceremonial county of Northamptonshire, England, created in 2021. By far the largest settlement in West Northamptonshire is the county town of Northampton. Its other significant towns are Daventry, Brackley and Towcester; the rest of the area is predominantly agricultural villages though it has many lakes and small woodlands and is passed through by the West Coast Main Line and the M1 and M40 motorways. The district includes the site of the Roman town of Bannaventa, and the grade I listed Althorp House and its estate.
Northamptonshire County Council was the county council for Northamptonshire in England. It was initially created in 1889 under the Local Government Act 1888, with its functions being substantially reformed in 1974 under the Local Government Act 1972. The council was abolished in 2021, with the area split into North Northamptonshire and West Northamptonshire. Elections to Northamptonshire County Council were held every four years.
Elections to Northamptonshire County Council took place on 4 June 2009, having been delayed from 7 May, in order to coincide with elections to the European Parliament. The Liberal Democrats replaced the Labour Party as the main opposition.
The 2005 Northamptonshire County Council election took place on 5 May 2005 to elect members of Northamptonshire County Council, England. The whole council was up for election and the Conservative Party gained overall control of the council from the Labour Party.
South Northamptonshire District Council in Northamptonshire, England was elected every four years. After the last boundary changes in 2007, 42 councillors were elected from 27 wards. The council was abolished in 2021, with the area becoming part of West Northamptonshire.
Local elections were held in the United Kingdom in May 1981.
The 2018 Daventry District Council election were held on Thursday 3 May 2018 to elect members of Daventry District Council in England.This was on the same day as other local elections.
The 2021 United Kingdom local elections were held on Thursday 6 May 2021. More than 145 English local councils, around 5,000 councillor seats, thirteen directly elected mayors in England, and 39 police and crime commissioners in England and Wales were contested. On the same day, the 2021 Hartlepool by-election took place, and there were also elections to the Scottish Parliament, Senedd and London Assembly, the last in conjunction with the London mayoral election.
The 2021 North Northamptonshire Council election took place alongside nationwide local elections. The election was originally due to take place in May 2020, but was postponed due to the COVID-19 pandemic.