Borough result maps
 1976 results map
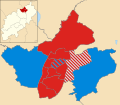 1979 results map
 1983 results map
 1987 results map
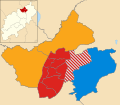 1991 results map
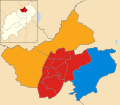 1995 results map
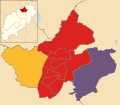 1999 results map
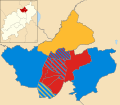 2003 results map
 2007 results map
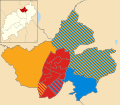 2011 results map
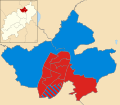 2015 results map
Corby Borough Council was elected every four years. The council was abolished in 2021, with the area becoming part of North Northamptonshire.
The first election was held in 1973. The council then acted as a shadow authority alongside the outgoing authorities until 1 April 1974 when it formally came into being. From 1974 until its abolition in 2021, political control of the council was as follows: [1]
| Party in control | Years | |
|---|---|---|
| Labour | 1974–1976 | |
| Conservative | 1976–1979 | |
| Labour | 1979–2021 | |
The leaders of the council from 2005 until the council's abolition in 2021 were:
| Councillor | Party | From | To | |
|---|---|---|---|---|
| Pat Fawcett [2] | Labour | 2005 | Dec 2011 | |
| Tom Beattie [3] [4] | Labour | 8 Dec 2011 | 31 Mar 2021 | |
The scheduled 2019 elections were cancelled due to the creation of the new North Northamptonshire unitary authority in 2021.
| Overall control | Labour | Conservative | Lib Dem | Independent | |||||
| 2015 | Labour | 24 | 5 | - | - | ||||
| 2011 | Labour | 22 | 4 | 3 | - | ||||
| 2007 | Labour | 16 | 8 | 5 | - | ||||
| 2003 | Labour | 18 | 9 | 2 | - | ||||
| 1999 | Labour | 27 | 1 | 1 | - | ||||
| 1995 | Labour | 24 | 1 | 2 | - | ||||
| 1991 | Labour | 23 | 1 | 2 | 1 | ||||
| 1987 | Labour | 23 | 2 | - | 2 | ||||
| 1983 | Labour | 24 | 3 | - | - | ||||
| 1979 | Labour | 23 | 3 | - | 1 | ||||
| 1976 | Conservative | 10 | 16 | - | 1 [a] | ||||
| 1973 | Labour | 29 | 1 | - | 3 [a] | ||||


| Party | Candidate | Votes | % | ±% | |
|---|---|---|---|---|---|
| Conservative | 512 | 50.4 | |||
| Labour | 369 | 36.4 | −3.0 | ||
| Liberal Democrats | 134 | 13.2 | |||
| Majority | 143 | 14.0 | |||
| Turnout | 1,015 | 51.5 | |||
| Conservative hold | Swing | ||||
| Party | Candidate | Votes | % | ±% | |
|---|---|---|---|---|---|
| Labour | 1,345 | 46.0 | −3.0 | ||
| Conservative | 735 | 25.1 | +1.1 | ||
| Liberal Democrats | 502 | 17.2 | −9.7 | ||
| Independent | 342 | 11.7 | +11.7 | ||
| Majority | 610 | 20.9 | |||
| Turnout | 2,924 | 65.5 | |||
| Labour hold | Swing | ||||
| Party | Candidate | Votes | % | ±% | |
|---|---|---|---|---|---|
| Labour | 542 | 72.9 | −4.0 | ||
| Conservative | 201 | 27.1 | +4.0 | ||
| Majority | 341 | 45.8 | |||
| Turnout | 743 | ||||
| Labour hold | Swing | ||||
| Party | Candidate | Votes | % | ±% | |
|---|---|---|---|---|---|
| Conservative | 471 | 38.7 | +9.1 | ||
| Labour | 380 | 31.2 | −39.2 | ||
| Independent | 272 | 22.4 | +22.4 | ||
| Socialist Labour | 94 | 7.7 | +7.7 | ||
| Majority | 91 | 7.5 | |||
| Turnout | 1,217 | 29.1 | |||
| Conservative gain from Labour | Swing | ||||
| Party | Candidate | Votes | % | ±% | |
|---|---|---|---|---|---|
| Conservative | Becky Miller-Barton | 405 | 49.9 | +6.6 | |
| Labour | Madeline Whiteman | 267 | 32.9 | −0.5 | |
| Liberal Democrats | Scott Ponton | 140 | 17.2 | +3.0 | |
| Majority | 138 | 17.0 | |||
| Turnout | 812 | 18.7 | |||
| Conservative hold | Swing | ||||
| Party | Candidate | Votes | % | ±% | |
|---|---|---|---|---|---|
| Labour | Seán Kettle | 1,063 | 71.2 | +5.7 | |
| Conservative | Kevin Watt | 252 | 16.9 | −7.5 | |
| BNP | Gordon Riddell | 141 | 9.4 | −0.7 | |
| Liberal Democrats | Julie Grant | 37 | 2.5 | +2.5 | |
| Majority | 811 | 54.3 | |||
| Turnout | 1,493 | ||||
| Labour hold | Swing | ||||
| Party | Candidate | Votes | % | ±% | |
|---|---|---|---|---|---|
| Labour | Elise Elliston | 722 | 63.3 | −8.5 | |
| UKIP | Peter McGowan | 246 | 21.6 | +21.6 | |
| Conservative | Phil Ewers | 154 | 13.5 | −14.7 | |
| Liberal Democrats | Julie Grant | 18 | 1.6 | +1.6 | |
| Majority | 476 | 41.8 | |||
| Turnout | 1,140 | ||||
| Labour hold | Swing | ||||
| Party | Candidate | Votes | % | ±% | |
|---|---|---|---|---|---|
| Labour | Isabel McNab | 610 | 64.6 | +10.3 | |
| Conservative | Stan Heggs | 252 | 26.7 | +12.5 | |
| Green | Michael Mahon | 82 | 8.7 | −1.1 | |
| Majority | 358 | 37.9 | |||
| Turnout | 944 | ||||
| Labour hold | Swing | ||||
| Party | Candidate | Votes | % | ±% | |
|---|---|---|---|---|---|
| Labour | Alison Dalziel | 818 | 56.0 | −5.1 | |
| Conservative | Ray Boyd | 497 | 34.0 | +17.4 | |
| Liberal Democrats | Chris Stanbra | 147 | 10.0 | +10.0 | |
| Majority | 321 | 22.0 | |||
| Turnout | 1,462 | ||||
| Labour hold | Swing | ||||
| Party | Candidate | Votes | % | ±% | |
|---|---|---|---|---|---|
| Conservative | Alexandra Wellings | 1,574 | 44.4 | +5.8 | |
| Labour | Ann Wallington | 1,223 | 34.5 | +11.4 | |
| Independent | Lee Forster | 381 | 10.7 | +10.7 | |
| Liberal Democrats | Terri Meechan | 369 | 10.4 | =5.7 | |
| Majority | 351 | 9.9 | |||
| Turnout | 3,547 | ||||
| Conservative hold | Swing | ||||