| |||||||||||||||||||||||||||||
All 73 seats in the Northamptonshire County Council 37 seats needed for a majority | |||||||||||||||||||||||||||||
---|---|---|---|---|---|---|---|---|---|---|---|---|---|---|---|---|---|---|---|---|---|---|---|---|---|---|---|---|---|
| |||||||||||||||||||||||||||||
Map showing the results of the 2005 Northamptonshire County Council elections. | |||||||||||||||||||||||||||||
|
The 2005 Northamptonshire County Council election took place on 5 May 2005 to elect members of Northamptonshire County Council, England. The whole council was up for election and the Conservative Party gained overall control of the council from the Labour Party. [2]
The 2005 election to Northamptonshire County Council coincided with the 2005 general election, this meant that turnout was significantly higher than is usual for local government elections. However, between 1997 and 2005 County Council Elections coincided with General Elections, meaning that turnout was significantly higher than would otherwise be expected. Every seat was single member, elected using the First Past the Post system used for most local elections in England and Wales.
Mirroring national trends the election saw a swing away from the social democratic Labour Party towards the centre-right Conservative Party, [3] with the Liberal Democrats picking up a few more seats. The Conservatives captured the council ending 12 years of Labour control and producing the first Conservative majority administration in 28 years, and only the second since the councils formation in 1973. [2] Turnout was 63.8% up 1.2% on 2001 and 28 new Councillors joined the council. [4] Note that there was a General Election at the same time as the county election in 2005 - this generally increases the numbers of people who turn out to vote in both elections which take place at the same time and place. (See for comparison the Northamptonshire County Council Election in 2009 when there was no General Election.)
Party | Seats | Gains | Losses | Net gain/loss | Seats % | Votes % | Votes | +/− | |
---|---|---|---|---|---|---|---|---|---|
Conservative | 45 | +13 | 61.6 | ||||||
Labour | 21 | -17 | 28.8 | ||||||
Liberal Democrats | 7 | +5 | 9.6 | ||||||
Independent | 0 | -1 | 0 |
Party | Candidate | Votes | % | ±% | |
---|---|---|---|---|---|
Labour | Mark Bullock | 2,275 | |||
Conservative | Robert Tustin | 640 | |||
Liberal Democrats | Francis O'Brien | 544 | |||
Majority | |||||
Turnout | 3,459 | ||||
Labour hold | Swing |
Party | Candidate | Votes | % | ±% | |
---|---|---|---|---|---|
Conservative | Stanley Heggs | 2,002 | |||
Labour | James Wade | 1,939 | |||
Liberal Democrats | Terene Meechan | 825 | |||
Majority | |||||
Turnout | 4,766 | ||||
Conservative gain from Labour |
Party | Candidate | Votes | % | ±% | |
---|---|---|---|---|---|
Labour | James McKellar | 2,035 | |||
Liberal Democrats | Christopher Stanbra | 1,214 | |||
Conservative | Bernard Howard | 1,123 | |||
Majority | |||||
Turnout | 4,372 | ||||
Labour hold | Swing |
Party | Candidate | Votes | % | ±% | |
---|---|---|---|---|---|
Labour | John McGhee | 2,086 | |||
Conservative | Yvonne von Bujtar | 804 | |||
Liberal Democrats | Richard Jones | 622 | |||
Majority | |||||
Turnout | 3,512 | ||||
Labour hold | Swing |
Party | Candidate | Votes | % | ±% | |
---|---|---|---|---|---|
Labour | James Kane | 2,620 | |||
Conservative | Sally Hogston | 886 | |||
Liberal Democrats | Sidney Beecroft | 707 | |||
Majority | |||||
Turnout | 4,213 | ||||
Labour hold | Swing |
Party | Candidate | Votes | % | ±% | |
---|---|---|---|---|---|
Labour | Julie Brookfield | 2,379 | |||
Conservative | Brian Cummings | 1,015 | |||
Liberal Democrats | Julie Connachie | 797 | |||
Majority | |||||
Turnout | 4,191 | ||||
Labour hold | Swing |
Party | Candidate | Votes | % | ±% | |
---|---|---|---|---|---|
Conservative | Robin Brown | 3,126 | |||
Labour | Penelope Price | 1,869 | |||
Majority | |||||
Turnout | 4,995 | ||||
Conservative hold | Swing |
Party | Candidate | Votes | % | ±% | |
---|---|---|---|---|---|
Conservative | John Millar | 3,581 | |||
Labour | Christopher Grethe | 1,550 | |||
Majority | |||||
Turnout | 5,131 | ||||
Conservative hold | Swing |
Party | Candidate | Votes | % | ±% | |
---|---|---|---|---|---|
Labour | Olwen Loud | 2,293 | |||
Conservative | Annette Dunn | 1,982 | |||
Majority | |||||
Turnout | 4,275 | ||||
Labour hold | Swing |
Party | Candidate | Votes | % | ±% | |
---|---|---|---|---|---|
Conservative | Alan Hills | 2,243 | |||
Labour | Janet Penrose | 1,909 | |||
Majority | |||||
Turnout | 4,152 | ||||
Conservative hold | Swing |
Party | Candidate | Votes | % | ±% | |
---|---|---|---|---|---|
Conservative | Richard Amos | 2,829 | |||
Labour | Christopher Myers | 1,550 | |||
Majority | |||||
Turnout | 4,379 | ||||
Conservative hold | Swing |
Party | Candidate | Votes | % | ±% | |
---|---|---|---|---|---|
Conservative | Judith Shephard | 2,872 | |||
Labour | Mark Maryan | 1,358 | |||
Majority | |||||
Turnout | 4,230 | ||||
Conservative hold | Swing |
Party | Candidate | Votes | % | ±% | |
---|---|---|---|---|---|
Conservative | Katharine Hemmings | 3,425 | |||
Labour | David Nicholl | 1,259 | |||
Green | Katharine Wickstead | 869 | |||
Majority | |||||
Turnout | 5,553 | ||||
Conservative hold | Swing |
Party | Candidate | Votes | % | ±% | |
---|---|---|---|---|---|
Conservative | Gina Ogden | 2,506 | |||
Liberal Democrats | Malcolm Adcock | 1,904 | |||
Majority | |||||
Turnout | 4,410 | ||||
Conservative hold | Swing |
Party | Candidate | Votes | % | ±% | |
---|---|---|---|---|---|
Conservative | Derek Lawson | 2,548 | |||
Labour | Geoffrey Moore | 1,582 | |||
Independent | Richard Gell | 930 | |||
Majority | |||||
Turnout | 5,060 | ||||
Conservative hold | Swing |
Party | Candidate | Votes | % | ±% | |
---|---|---|---|---|---|
Conservative | Andrew Langley | 2,387 | |||
Labour | John Farrar | 2,098 | |||
Majority | |||||
Turnout | 4,485 | ||||
Conservative gain from Labour |
Party | Candidate | Votes | % | ±% | |
---|---|---|---|---|---|
Conservative | Charles Reichhold | 2,774 | |||
Labour | Alan Brookfield | 1,045 | |||
Liberal Democrats | David Nesbitt | 993 | |||
Independent | John Smoker | 172 | |||
Majority | |||||
Turnout | 4,984 | ||||
Conservative hold | Swing |
Party | Candidate | Votes | % | ±% | |
---|---|---|---|---|---|
Conservative | Priscilla Padley | 2,734 | |||
Liberal Democrats | David Burgess | 885 | |||
Labour | Maureen Forshaw | 773 | |||
Majority | |||||
Turnout | 4,392 | ||||
Conservative hold | Swing |
Party | Candidate | Votes | % | ±% | |
---|---|---|---|---|---|
Conservative | Albert Campbell | 2,262 | |||
Labour | Lorraine Taylor | 1,630 | |||
Majority | |||||
Turnout | 3,892 | ||||
Conservative gain from Labour |
Party | Candidate | Votes | % | ±% | |
---|---|---|---|---|---|
Conservative | Andrew Mercer | 1,855 | |||
Labour | Leonard Cox | 1,643 | |||
Liberal Democrats | David Hooton | 749 | |||
Majority | |||||
Turnout | 4,247 | ||||
Conservative gain from Labour |
Party | Candidate | Votes | % | ±% | |
---|---|---|---|---|---|
Conservative | Michael Tye | 2,887 | |||
Labour | Leslie Rolfe | 2,039 | |||
Majority | |||||
Turnout | 4,926 | ||||
Conservative hold | Swing |
Party | Candidate | Votes | % | ±% | |
---|---|---|---|---|---|
Conservative | Ronald Pinnock | 2,067 | |||
Labour | Frederick Jones | 1,696 | |||
Majority | |||||
Turnout | 3,763 | ||||
Conservative gain from Labour |
Party | Candidate | Votes | % | ±% | |
---|---|---|---|---|---|
Conservative | Robert Seery | 2,766 | |||
Labour | Madeline Whiteman | 1,379 | |||
UKIP | Peter Baden | 476 | |||
Majority | |||||
Turnout | 4,221 | ||||
Conservative hold | Swing |
Party | Candidate | Votes | % | ±% | |
---|---|---|---|---|---|
Conservative | William Parker | 1,756 | |||
Labour | Adrian Chambers | 1,648 | |||
Liberal Democrats | Alan Window | 498 | |||
Independent | Dereck Hilling | 230 | |||
Majority | |||||
Turnout | 4,132 | ||||
Conservative gain from Labour |
Party | Candidate | Votes | % | ±% | |
---|---|---|---|---|---|
Conservative | Christopher Lamb | 1,515 | |||
Labour | Ronald Steele | 1,365 | |||
Independent | Christopher Groome | 1,049 | |||
Liberal Democrats | Stuart Simons | 466 | |||
Majority | |||||
Turnout | 4,395 | ||||
Conservative hold | Swing |
Party | Candidate | Votes | % | ±% | |
---|---|---|---|---|---|
Conservative | Belinda Humfrey | 2,169 | |||
Labour | David Coe | 1,932 | |||
Liberal Democrats | Philip Rice | 537 | |||
Majority | |||||
Turnout | 4,638 | ||||
Conservative gain from Labour |
Party | Candidate | Votes | % | ±% | |
---|---|---|---|---|---|
Labour | Royston Mayhew | 2,165 | |||
Conservative | Michael Tebbutt | 932 | |||
Majority | |||||
Turnout | 3,097 | ||||
Labour hold | Swing |
Party | Candidate | Votes | % | ±% | |
---|---|---|---|---|---|
Conservative | Robert Civil | 2,145 | |||
Labour | Paul Corazzo | 1,550 | |||
Liberal Democrats | Christopher McGlynn | 654 | |||
Majority | |||||
Turnout | 4,349 | ||||
Conservative hold | Swing |
Party | Candidate | Votes | % | ±% | |
---|---|---|---|---|---|
Labour | Eileen Hales | 2,314 | |||
Conservative | John Henson | 1,707 | |||
Majority | |||||
Turnout | 4,021 | ||||
Labour hold | Swing |
Party | Candidate | Votes | % | ±% | |
---|---|---|---|---|---|
Conservative | James Harker | 3,908 | |||
Labour | Emma Poole | 1,965 | |||
Majority | |||||
Turnout | 5,873 | ||||
Conservative hold | Swing |
Party | Candidate | Votes | % | ±% | |
---|---|---|---|---|---|
Conservative | Alan Pate | 1,944 | |||
Labour | David Whyte | 1,825 | |||
Majority | |||||
Turnout | 3,769 | ||||
Conservative gain from Labour |
Party | Candidate | Votes | % | ±% | |
---|---|---|---|---|---|
Labour | Jonathan West | 2,404 | |||
Conservative | Matthew Lynch | 2,114 | |||
Majority | |||||
Turnout | 4,518 | ||||
Labour hold | Swing |
Party | Candidate | Votes | % | ±% | |
---|---|---|---|---|---|
Conservative | Ursula Jones | 1,882 | |||
Labour | Alexander Gordon | 1,742 | |||
Liberal Democrats | John Coleman | 1,026 | |||
Majority | |||||
Turnout | 4,650 | ||||
Conservative hold | Swing |
Party | Candidate | Votes | % | ±% | |
---|---|---|---|---|---|
Liberal Democrats | Brian Hoare | 1,304 | |||
Labour | Michael Boss | 1,268 | |||
Conservative | Leon Bailey | 825 | |||
Green | Marcus Rock | 264 | |||
Majority | |||||
Turnout | 3,661 | ||||
Liberal Democrats gain from Labour |
Party | Candidate | Votes | % | ±% | |
---|---|---|---|---|---|
Conservative | Christopher Malpas | 1,525 | |||
Labour | Debra Boss | 1,306 | |||
Liberal Democrats | Kevin Alderton | 740 | |||
Majority | |||||
Turnout | 3,571 | ||||
Conservative gain from Labour |
Party | Candidate | Votes | % | ±% | |
---|---|---|---|---|---|
Liberal Democrats | John Yates | 1,712 | |||
Conservative | Michael Hallam | 1,297 | |||
Labour | Tess Scott | 1,277 | |||
Majority | |||||
Turnout | 4,286 | ||||
Liberal Democrats gain from Labour |
Party | Candidate | Votes | % | ±% | |
---|---|---|---|---|---|
Labour | Rosemarie Dickie | 1,503 | |||
Conservative | Edward Barham | 766 | |||
Liberal Democrats | Grant Bowles | 752 | |||
Independent | Peter Harrisson | 157 | |||
Majority | |||||
Turnout | 3,178 | ||||
Labour hold | Swing |
Party | Candidate | Votes | % | ±% | |
---|---|---|---|---|---|
Liberal Democrats | Brendan Glynane | 1,342 | |||
Labour | Chaman Kalyan | 1,288 | |||
Conservative | Michelle Hoare | 1,006 | |||
Majority | |||||
Turnout | 3,636 | ||||
Liberal Democrats gain from Labour |
Party | Candidate | Votes | % | ±% | |
---|---|---|---|---|---|
Labour | Barry Kirkby | 1,490 | |||
Conservative | David Acock | 1,180 | |||
Liberal Democrats | Jean Hawkins | 1,008 | |||
Green | Anthony Lochmuller | 158 | |||
CPA | Colin Bricher | 105 | |||
Majority | |||||
Turnout | 3,941 | ||||
Labour hold | Swing |
Party | Candidate | Votes | % | ±% | |
---|---|---|---|---|---|
Conservative | Andre Savage | 1,925 | |||
Labour | Simon Draper | 1,236 | |||
Liberal Democrats | Charles Markham | 679 | |||
Green | Lisa Warner | 199 | |||
Majority | |||||
Turnout | 4,039 | ||||
Conservative hold | Swing |
Party | Candidate | Votes | % | ±% | |
---|---|---|---|---|---|
Conservative | Jamie Lane | 1,134 | |||
Labour | Arthur McCutcheon | 1,086 | |||
Liberal Democrats | Ruth Williams | 641 | |||
CPA | Timothy Webb | 95 | |||
Majority | |||||
Turnout | 2,956 | ||||
Conservative gain from Labour |
Party | Candidate | Votes | % | ±% | |
---|---|---|---|---|---|
Liberal Democrats | David Garlick | 1,668 | |||
Conservative | Paul Rolfe | 1,476 | |||
Labour | Trevor Bailey | 1,190 | |||
Green | Muriel Upton | 110 | |||
Majority | |||||
Turnout | 4,444 | ||||
Liberal Democrats gain from Labour |
Party | Candidate | Votes | % | ±% | |
---|---|---|---|---|---|
Liberal Democrats | Richard Church | 1,677 | |||
Labour | Nova Keown | 1,349 | |||
Conservative | Marie Carter | 830 | |||
Green | Derek Pickup | 188 | |||
Independent | Monica Withrington | 81 | |||
Majority | |||||
Turnout | 4,125 | ||||
Liberal Democrats gain from Labour |
Party | Candidate | Votes | % | ±% | |
---|---|---|---|---|---|
Liberal Democrats | Sally Beardsworth | 2,069 | |||
Labour | Trevor Owen | 978 | |||
Conservative | David Mackintosh | 859 | |||
BNP | Fiona Woodward | 153 | |||
Independent | Paul Withrington | 103 | |||
Green | Anthony Upton | 78 | |||
Majority | |||||
Turnout | 4,240 | ||||
Liberal Democrats hold | Swing |
Party | Candidate | Votes | % | ±% | |
---|---|---|---|---|---|
Labour | Ulrick Gravesande | 1,399 | |||
Conservative | Stuart Penketh | 768 | |||
Liberal Democrats | Eva Down | 620 | |||
CPA | Andrew Otchie | 74 | |||
Majority | |||||
Turnout | 2,861 | ||||
Labour hold | Swing |
Party | Candidate | Votes | % | ±% | |
---|---|---|---|---|---|
Conservative | Michael Hill | 2,674 | |||
Labour | Stephen Croke | 1,344 | |||
Liberal Democrats | Maria Crake | 872 | |||
Green | Evelyn Lander | 278 | |||
Majority | |||||
Turnout | 5,168 | ||||
Conservative hold | Swing |
Party | Candidate | Votes | % | ±% | |
---|---|---|---|---|---|
Conservative | Elizabeth Tavener | 2,160 | |||
Labour | Dvija Mehta | 1,114 | |||
Liberal Democrats | Irene Markham | 659 | |||
Independent | Susan Edkins | 325 | |||
Majority | |||||
Turnout | 4,258 | ||||
Conservative hold | Swing |
Party | Candidate | Votes | % | ±% | |
---|---|---|---|---|---|
Conservative | Don Edwards | 1,743 | |||
Labour | Francis Lilley | 1,542 | |||
Liberal Democrats | Katherine Abu | 544 | |||
Independent | Karen Dare | 239 | |||
Majority | |||||
Turnout | 4,068 | ||||
Conservative hold | Swing |
Party | Candidate | Votes | % | ±% | |
---|---|---|---|---|---|
Conservative | Brandon Eldred | 1,873 | |||
Labour | Iftikhar Choudary | 1,288 | |||
Liberal Democrats | Malcolm Mildren | 1,132 | |||
Majority | |||||
Turnout | 4,293 | ||||
Conservative hold | Swing |
Party | Candidate | Votes | % | ±% | |
---|---|---|---|---|---|
Labour | Melanie de Cruz | 1,277 | |||
Conservative | Laura Norman | 681 | |||
Liberal Democrats | Anthony Woods | 592 | |||
Independent | Roger Conroy | 361 | |||
Majority | |||||
Turnout | 2,911 | ||||
Labour hold | Swing |
Party | Candidate | Votes | % | ±% | |
---|---|---|---|---|---|
Labour | Winston Strachan | 1,374 | |||
Conservative | Penelope Flavell | 936 | |||
Liberal Democrats | Phillip Buchan | 629 | |||
Green | Rebecca Smith | 243 | |||
Independent | Tina Harvey | 44 | |||
Majority | |||||
Turnout | 3,226 | ||||
Labour hold | Swing |
Party | Candidate | Votes | % | ±% | |
---|---|---|---|---|---|
Liberal Democrats | Jane Hollis | 1,318 | |||
Labour | Vivian Dams | 1,214 | |||
Conservative | Richard Booker | 665 | |||
Majority | |||||
Turnout | 3,197 | ||||
Liberal Democrats gain from Labour |
Party | Candidate | Votes | % | ±% | |
---|---|---|---|---|---|
Labour | Terence Wire | 1,558 | |||
Conservative | Ian McCann | 1,317 | |||
Liberal Democrats | Scott Collins | 746 | |||
Majority | |||||
Turnout | 3,621 | ||||
Labour hold | Swing |
Party | Candidate | Votes | % | ±% | |
---|---|---|---|---|---|
Labour | Leslie Patterson | 1,358 | |||
Conservative | Brian Jarvis | 788 | |||
Liberal Democrats | Dennis Meredith | 735 | |||
Majority | |||||
Turnout | 2,881 | ||||
Labour hold | Swing |
Party | Candidate | Votes | % | ±% | |
---|---|---|---|---|---|
Conservative | Charles Hugheston-Roberts | 1,618 | |||
Liberal Democrats | John Rawlings | 1,334 | |||
Labour | Alan Kingston | 796 | |||
Majority | |||||
Turnout | 3,748 | ||||
Conservative hold | Swing |
Party | Candidate | Votes | % | ±% | |
---|---|---|---|---|---|
Conservative | Maureen Hill | 2,527 | |||
Labour | Anjona Roy | 1,235 | |||
Liberal Democrats | Michael Beardsworth | 995 | |||
Majority | |||||
Turnout | 4,757 | ||||
Conservative hold | Swing |
Party | Candidate | Votes | % | ±% | |
---|---|---|---|---|---|
Conservative | Andrew Grant | 2,728 | |||
Labour | Douglas Berry | 1,858 | |||
Majority | |||||
Turnout | 4,586 | ||||
Conservative hold | Swing |
Party | Candidate | Votes | % | ±% | |
---|---|---|---|---|---|
Conservative | Ronald Sawbridge | 2,156 | |||
Liberal Democrats | Janet Arkwright | 986 | |||
Labour | Valerie Whitaker | 952 | |||
Green | Katherine Pate | 318 | |||
Majority | |||||
Turnout | 4,412 | ||||
Conservative hold | Swing |
Party | Candidate | Votes | % | ±% | |
---|---|---|---|---|---|
Conservative | Joan Kirkbride | 2,814 | |||
Labour | John King | 982 | |||
Liberal Democrats | Martin Taylor | 784 | |||
Majority | |||||
Turnout | 4,580 | ||||
Conservative hold | Swing |
Party | Candidate | Votes | % | ±% | |
---|---|---|---|---|---|
Conservative | Alan Walker | 2,344 | |||
Labour | David Aaronson | 1,508 | |||
Liberal Democrats | Rodney Kilvert | 1,083 | |||
Majority | |||||
Turnout | 4,935 | ||||
Conservative hold | Swing |
Party | Candidate | Votes | % | ±% | |
---|---|---|---|---|---|
Conservative | Benjamin Smith | 3,482 | |||
Labour | Charles Parkin | 1,440 | |||
Majority | |||||
Turnout | 4,922 | ||||
Conservative hold | Swing |
Party | Candidate | Votes | % | ±% | |
---|---|---|---|---|---|
Conservative | Brian Binley | 2,895 | |||
Labour | Stephen Winder | 1,021 | |||
Liberal Democrats | Marianne Taylor | 777 | |||
Majority | |||||
Turnout | 4,693 | ||||
Conservative hold | Swing |
Party | Candidate | Votes | % | ±% | |
---|---|---|---|---|---|
Conservative | Kenneth Malling | 3,024 | |||
Labour | Gart Youens | 1,972 | |||
Majority | |||||
Turnout | 4,996 | ||||
Conservative hold | Swing |
Party | Candidate | Votes | % | ±% | |
---|---|---|---|---|---|
Conservative | Bernard Ingram | 2,944 | |||
Labour | Ronald Johnson | 1,491 | |||
Liberal Democrats | Richard Matthews | 945 | |||
Majority | |||||
Turnout | 5,380 | ||||
Conservative hold | Swing |
Party | Candidate | Votes | % | ±% | |
---|---|---|---|---|---|
Conservative | Rosemary Bromwich | 2,004 | |||
Liberal Democrats | Oliver Low | 1,195 | |||
Labour | Drisc Wardle | 1,115 | |||
Majority | |||||
Turnout | 4,314 | ||||
Conservative hold | Swing |
Party | Candidate | Votes | % | ±% | |
---|---|---|---|---|---|
Labour | Maureen Shram | 2,097 | |||
Conservative | Bhupendra Patel | 1,518 | |||
Liberal Democrats | Peter Atkins | 993 | |||
Majority | |||||
Turnout | 4,608 | ||||
Labour hold | Swing |
Party | Candidate | Votes | % | ±% | |
---|---|---|---|---|---|
Labour | George Blackwell | 2,720 | |||
Conservative | David Smith | 2,423 | |||
Majority | |||||
Turnout | 5,143 | ||||
Labour hold | Swing |
Party | Candidate | Votes | % | ±% | |
---|---|---|---|---|---|
Conservative | John Bailey | 3,180 | |||
Labour | John Robinson | 1,783 | |||
Majority | |||||
Turnout | 4,963 | ||||
Conservative hold | Swing |
Party | Candidate | Votes | % | ±% | |
---|---|---|---|---|---|
Labour | James Ashton | 2,306 | |||
Conservative | Graham Lawman | 1.988 | |||
Majority | |||||
Turnout | 4,294 | ||||
Labour gain from Conservative |
Party | Candidate | Votes | % | ±% | |
---|---|---|---|---|---|
Conservative | Alan Bailey | 1,965 | |||
Labour | Timothy Maguire | 1,925 | |||
Liberal Democrats | Keith Clements | 643 | |||
Majority | |||||
Turnout | 4,533 | ||||
Conservative gain from Labour |
Party | Candidate | Votes | % | ±% | |
---|---|---|---|---|---|
Labour | Patricia Jones | 2,003 | |||
Conservative | Kenneth Harrington | 1,196 | |||
Green | Jonathan Hornett | 377 | |||
Majority | |||||
Turnout | 3,576 | ||||
Labour hold | Swing |
Party | Candidate | Votes | % | ±% | |
---|---|---|---|---|---|
Conservative | Malcolm Waters | 2,132 | |||
Labour | Neville Marsden | 1,508 | |||
Liberal Democrats | Penelope Wilkins | 619 | |||
Majority | |||||
Turnout | 4,259 | ||||
Conservative hold | Swing |
Party | Candidate | Votes | % | ±% | |
---|---|---|---|---|---|
Labour | Patricia Cass | 1,785 | |||
Conservative | Paul Bell | 1,545 | |||
Liberal Democrats | Margaret Atkins | 561 | |||
Green | Ann Parsons | 172 | |||
Majority | |||||
Turnout | 4,063 | ||||
Labour hold | Swing |
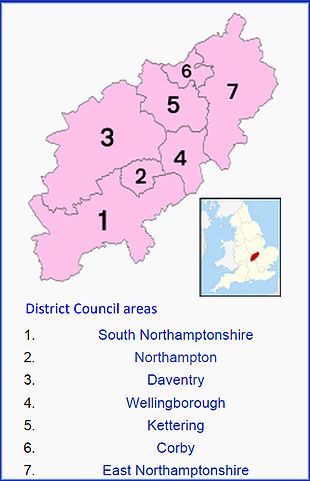
Anthony Richard Clarke, known as Tony Clarke, is a British former Member of Parliament, who is currently a teacher at Northampton College. A politician of the left, Clarke was until recently the Green Party National Spokesperson on International and Foreign Affairs; previously a British Labour Party politician, he was Member of Parliament for Northampton South from 1997 to 2005. Clarke was also a director of Northampton Town F.C. for 11 years from 1999 to 2010, and served as General Manager at the club between 2005 and 2008. He served three terms on Northampton Borough Council and one term on Northamptonshire County Council (Independent). He also served as a Special Constable with Northamptonshire Police between 2003 and 2007.
The 2005 United Kingdom local elections were held on Thursday 5 May 2005, with various councils and local government seats being contested in England and Northern Ireland, and a local referendum taking place on the Isle of Wight on the issue of a directly elected mayor. These local elections were held in conjunction with the 2005 general election across the entire United Kingdom.
The 1998 Bolton Metropolitan Borough Council election took place on 7 May 1998 to elect members of Bolton Metropolitan Borough Council in Greater Manchester, England. One third of the council was up for election and the Labour Party kept overall control of the council.
The 2001 United Kingdom local elections took place on Thursday 7 June 2001. Elections took place for all of the English shire counties, some English unitary authorities and all of the Northern Ireland districts. The elections were delayed from the usual date of the first Thursday in May due to the 2001 foot and mouth crisis and were held on the same day as the 2001 general election.
The 2004 Halton Borough Council election took place on 10 June 2004 to elect members of Halton Unitary Council in Cheshire, England. The whole council was up for election with boundary changes since the last election in 2002. The Labour Party stayed in overall control of the council.
The 2004 Welwyn Hatfield District Council election took place on 10 June 2004 to elect members of Welwyn Hatfield District Council in Hertfordshire, England. One third of the council was up for election and the Conservative Party stayed in overall control of the council.
The 1964 Lewisham Council election took place on 7 May 1964 to elect members of Lewisham London Borough Council in London, England. The whole council was up for election and the Labour Party gained control of the council.
The 2010 Sunderland Council election took place on 6 May 2010 to elect members of Sunderland Metropolitan Borough Council in Tyne and Wear, England. One third of the council was up for election and the Labour Party stayed in overall control of the council. The election took place on the same day as the 2010 General Election.
The 2010 Southampton Council election took place on 6 May 2010 to elect members of Southampton Unitary Council in Hampshire, England. One third of the council was up for election and the Conservative Party stayed in overall control of the council.
The 2010 Basildon District Council election took place on 6 May 2010 to elect members of Basildon District Council in Essex, England. One third of the council was up for election and the Conservative party stayed in overall control of the council.
The 2011 Basildon Council election took place on 5 May 2011 to elect members of Basildon Borough Council in Essex, England. One third of the council was up for election and the Conservative party stayed in overall control of the council.
The 2004 Colchester Borough Council election took place on 10 June 2004 to elect members of Colchester Borough Council in Essex, England. This was the same day as the other 2004 United Kingdom local elections and as the 2004 European Parliament Elections. One third of the seats were up for election and the council stayed under no overall control.
The 2014 Calderdale Metropolitan Borough Council election took place on 22 May 2014 to elect members of Calderdale Metropolitan Borough Council in England. This was on the same day as local elections across the United Kingdom and a European election. One councillor was elected in each of the 17 wards for a four-year term. There are three councillors representing each ward elected on a staggered basis so one third of the councillor seats were up for re-election. The seats had previously been contested in 2010 which was held in conjunction with a general election. The turnout was significantly lower in 2014 than in 2010 which is not unusual when comparing local elections that coincide with general elections to ones that do not. Prior to the election Labour was the largest party in the council with 21 out of 51 seats, 5 seats short of an overall majority. After the election there was no overall control of the council. Labour had 25 seats, only one short of a majority and so Labour continued to operate a minority administration.
The 2014 Plymouth City Council election took place on 22 May 2014 to elect members of Plymouth City Council in England. This was on the same day as other local elections. The election was won by the Labour Party, who maintained their overall majority. The UK Independence Party gained representation on the council for the first time, and this was the only election in which the party won seats in Plymouth.
The 2015 United Kingdom local elections were held on Thursday 7 May 2015, the same day as the general election for the House of Commons.
The 1999 Castle Point Borough Council election took place on 6 May 1999 to elect members of Castle Point Borough Council in Essex, England. The whole council was up for election and the Labour party stayed in overall control of the council.
The 2006 West Oxfordshire District Council election took place on 4 May 2006 to elect members of West Oxfordshire District Council in Oxfordshire, England. One third of the council was up for election and the Conservative Party stayed in overall control of the council.
The 2017 United Kingdom local elections were held on Thursday 4 May 2017. Local elections were held across Great Britain, with elections to 35 English local authorities and all councils in Scotland and Wales.
The 2019 United Kingdom local elections took place on Thursday 2 May 2019, with 248 English local councils, six directly elected mayors in England, and all 11 local councils in Northern Ireland being contested.
The 2021 United Kingdom local elections were held on Thursday 6 May 2021. More than 145 English local councils, around 5,000 councillor seats, thirteen directly elected mayors in England, and 39 police and crime commissioners in England and Wales were contested. On the same day, the 2021 Hartlepool by-election took place, and there were also elections to the Scottish Parliament, Senedd and London Assembly, the last in conjunction with the London mayoral election.