Borough result maps
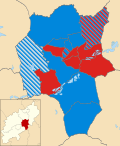 1999 results map
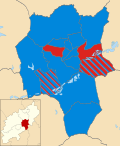 2003 results map
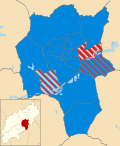 2007 results map
 2011 results map
 2015 results map
The Borough Council of Wellingborough in Northamptonshire, UK was elected every four years. After the last boundary changes in 1999, thirty-six councillors were elected from 16 wards. [1] The council was abolished in 2021, with the area becoming part of North Northamptonshire.
The first election was held in 1973. The council then acted as a shadow authority alongside the outgoing authorities until 1 April 1974 when it formally came into being. From 1974 until its abolition in 2021, political control of the council was as follows: [2] [3]
| Party in control | Years | |
|---|---|---|
| No overall control | 1974–1976 | |
| Conservative | 1976–1995 | |
| No overall control | 1995–1999 | |
| Labour | 1999–2003 | |
| Conservative | 2003–2021 | |
The leaders of the council from 1991 until the council's abolition in 2021 were:
| Councillor | Party | From | To | |
|---|---|---|---|---|
| Glyn Addis [4] | Conservative | Oct 1991 | ||
| Derek Hooton [4] [5] | Conservative | Oct 1991 | May 1997 | |
| Graham Ridge [5] [6] | Labour | 27 May 1997 | May 2003 | |
| Eileen Higgins [7] [8] | Conservative | May 2003 | 2005 | |
| John Bailey [9] | Conservative | 2005 | 2011 | |
| Paul Bell [10] [11] | Conservative | 2011 | 2016 | |
| Martin Griffiths [12] [13] | Conservative | 2016 | 31 Mar 2021 | |
| Overall control | Conservative | Labour | Independent | ||||
| 2015 | Conservative | 27 | 9 | - | |||
| 2011 | Conservative | 27 | 9 | - | |||
| 2007 | Conservative | 30 | 4 | 2 | |||
| 2003 | Conservative | 27 | 9 | - | |||
| 1999 | Labour | 15 | 20 | 1 | |||


| Party | Candidate | Votes | % | ±% | |
|---|---|---|---|---|---|
| Labour | 694 | 54.6 | +13.5 | ||
| Conservative | 530 | 41.7 | −8.5 | ||
| UKIP | 47 | 3.7 | +3.7 | ||
| Majority | 164 | 12.9 | |||
| Turnout | 1,271 | 29.4 | |||
| Labour gain from Conservative | Swing | ||||
| Party | Candidate | Votes | % | ±% | |
|---|---|---|---|---|---|
| Conservative | Lesley Callnon | 469 | 39.3 | −17.1 | |
| Labour | Andrew Scarborough | 445 | 37.3 | −6.3 | |
| UKIP | Anthony Ellwood | 173 | 14.5 | +14.5 | |
| Liberal Democrats | Penelope Wilkins | 105 | 8.8 | +8.8 | |
| Majority | 24 | 2.0 | |||
| Turnout | 1,192 | 23.4 | |||
| Conservative hold | Swing | ||||
| Party | Candidate | Votes | % | ±% | |
|---|---|---|---|---|---|
| Conservative | Graham Lawman | 885 | 61.1 | −4.3 | |
| Labour | Catherine Mulholland | 455 | 31.4 | −3.2 | |
| Green | Jonathan Hornett | 62 | 4.3 | +4.3 | |
| UKIP | James Wrench | 45 | 3.1 | +3.1 | |
| Majority | 430 | 29.7 | |||
| Turnout | 1,447 | 27.8 | |||
| Conservative hold | Swing | ||||
| Party | Candidate | Votes | % | ±% | |
|---|---|---|---|---|---|
| Conservative | Bruce Thomas | 655 | 47.6 | +8.3 | |
| Labour | Patricia Cass | 488 | 35.4 | −1.9 | |
| UKIP | Anthony Ellwood | 162 | 11.8 | −2.7 | |
| Green | Jonathan Hornett | 71 | 5.1 | +5.1 | |
| Majority | 167 | 12.2 | +10.2 | ||
| Turnout | 1,376 | ||||
| Conservative gain from Independent | Swing | ||||
| Party | Candidate | Votes | % | ±% | |
|---|---|---|---|---|---|
| Conservative | Martin Griffiths | 698 | 52.6 | −7.3 | |
| Labour | Andrew Scarborough | 448 | 33.8 | −6.3 | |
| Independent | Ray Miles | 125 | 9.4 | +9.4 | |
| Green | Jonathan Hornett | 55 | 4.1 | +4.1 | |
| Majority | 250 | 18.8 | |||
| Turnout | 1,326 | 25.4 | |||
| Conservative hold | Swing | ||||
| Party | Candidate | Votes | % | ±% | |
|---|---|---|---|---|---|
| Conservative | Jim Bass | 363 | 66.0 | +8.3 | |
| Liberal Democrats | Stuart Simons | 149 | 27.1 | +27.1 | |
| Labour | Peter Wright | 38 | 6.9 | +6.9 | |
| Majority | 214 | 38.9 | |||
| Turnout | 550 | 37.0 | |||
| Conservative hold | Swing | ||||
| Party | Candidate | Votes | % | ±% | |
|---|---|---|---|---|---|
| Conservative | Andrew Bigley | 665 | 59.0 | −18.5 | |
| BNP | David Robinson | 177 | 15.7 | +15.7 | |
| Labour | Elaine Baggott | 169 | 15.0 | −7.5 | |
| Liberal Democrats | Jane Brown | 40 | 3.5 | +3.5 | |
| UKIP | Tony Ellwood | 39 | 3.5 | +3.5 | |
| Green | Jonathan Hornett | 37 | 3.3 | +3.3 | |
| Majority | 488 | 43.3 | −11.7 | ||
| Turnout | 1127 | 47.1 | |||
| Conservative hold | Swing | ||||
| Party | Candidate | Votes | % | ±% | |
|---|---|---|---|---|---|
| Conservative | Jo Beirne | 816 | 81.1 | +10.6 | |
| Independent | Peter Wright | 97 | 9.7 | +9.7 | |
| Liberal Democrats | Jane Brown | 93 | 9.2 | +9.2 | |
| Majority | 719 | 71.4 | |||
| Turnout | 1006 | 32.9 | −6.6 | ||
| Conservative hold | Swing | ||||
| Party | Candidate | Votes | % | ±% | |
|---|---|---|---|---|---|
| Conservative | Geoffrey Simmons | 750 | 47.3 | +1.6 | |
| Labour | Patricia Jones | 316 | 19.9 | −11.3 | |
| Green | Jonathan Hornett | 189 | 11.9 | +11.9 | |
| Independent | Jacqueline Norton | 183 | 11.5 | −11.5 | |
| Liberal Democrats | Julie White | 149 | 9.4 | +9.4 | |
| Majority | 434 | 27.3 | |||
| Turnout | 1587 | 37.7 | −2.8 | ||
| Conservative hold | Swing | ||||
| Party | Candidate | Votes | % | ±% | |
|---|---|---|---|---|---|
| Conservative | Robert Hawkes | 548 | 46.0 | −9.6 | |
| Labour | Helena Reynolds | 361 | 30.3 | −14.0 | |
| Liberal Democrats | Daniel Jones | 162 | 13.6 | +13.6 | |
| BNP | David Robinson | 120 | 10.1 | +10.1 | |
| Majority | 187 | 15.7 | |||
| Turnout | 1,191 | 27.4 | |||
| Conservative hold | Swing | ||||
| Party | Candidate | Votes | % | ±% | |
|---|---|---|---|---|---|
| Conservative | John Raymond | 570 | 57.2 | −20.3 | |
| Labour | Graham Sherwood | 186 | 18.7 | −3.9 | |
| BNP | David Robinson | 84 | 8.4 | +8.4 | |
| Liberal Democrats | Penelope Wilkins | 72 | 7.2 | +7.2 | |
| English Democrat | Terence Spencer | 62 | 6.2 | +6.2 | |
| Green | Jonathan Hornett | 23 | 2.3 | +2.3 | |
| Majority | 384 | 38.5 | |||
| Turnout | 997 | 38.4 | |||
| Conservative hold | Swing | ||||
| Party | Candidate | Votes | % | ±% | |
|---|---|---|---|---|---|
| Conservative | Andrew Atkinson | 639 | 48.0 | +19.8 | |
| Labour | Peter Wright | 425 | 31.9 | −7.2 | |
| Liberal Democrats | Daniel Jones | 229 | 17.2 | +17.2 | |
| Green | Jonathan Hornett | 38 | 2.9 | +2.9 | |
| Majority | 214 | 16.1 | |||
| Turnout | 1,331 | ||||
| Conservative gain from Independent | Swing | ||||
| Party | Candidate | Votes | % | ±% | |
|---|---|---|---|---|---|
| Conservative | Robert Gough | 626 | 41.5 | −3.8 | |
| Labour | Kevin Watts | 417 | 27.7 | −27.0 | |
| UKIP | Debra Elderton | 396 | 26.3 | +26.3 | |
| Liberal Democrats | Daniel Jones | 69 | 4.6 | +4.6 | |
| Majority | 209 | 13.9 | |||
| Turnout | 1,508 | ||||
| Conservative gain from Labour | Swing | ||||
| Party | Candidate | Votes | % | ±% | |
|---|---|---|---|---|---|
| Conservative | Veronica Waters | 396 | 45.6 | −20.3 | |
| UKIP | Allan Shipham | 244 | 28.1 | +28.1 | |
| Labour | Elfred Brown | 193 | 27.7 | −11.9 | |
| English Democrat | Marshall Walker | 35 | 4.0 | +4.0 | |
| Majority | 152 | 17.5 | |||
| Turnout | 868 | ||||
| Conservative hold | Swing | ||||
| Party | Candidate | Votes | % | ±% | |
|---|---|---|---|---|---|
| Conservative | Barbara Bailey | 758 | 62.3 | +15.4 | |
| Labour | Steve Ayland | 235 | 19.3 | −7.7 | |
| UKIP | Allan Shipham | 137 | 11.3 | −14.9 | |
| Liberal Democrats | John Wheaver | 86 | 7.1 | +7.1 | |
| Majority | 523 | 43.0 | |||
| Turnout | 1,216 | ||||
| Conservative hold | Swing | ||||
| Party | Candidate | Votes | % | ±% | |
|---|---|---|---|---|---|
| Conservative | Andrew Weatherill | 547 | 52.2 | −10.1 | |
| Independent | Laurence Harper | 227 | 21.7 | +21.7 | |
| Green | Marion Turner-Hawes | 134 | 12.8 | +12.8 | |
| Labour | Isobel Stevenson | 76 | 7.3 | −12.0 | |
| Liberal Democrats | Chris Nelson | 64 | 6.1 | −1.0 | |
| Majority | 320 | 30.5 | |||
| Turnout | 1,048 | ||||
| Conservative hold | Swing | ||||