| |||||||||||||||||||||||||||||||||
| |||||||||||||||||||||||||||||||||
All 45 seats in the Northampton Borough Council 23 seats needed for a majority | |||||||||||||||||||||||||||||||||
---|---|---|---|---|---|---|---|---|---|---|---|---|---|---|---|---|---|---|---|---|---|---|---|---|---|---|---|---|---|---|---|---|---|
| |||||||||||||||||||||||||||||||||
Map showing the results of the 2015 Northampton Borough Council elections. | |||||||||||||||||||||||||||||||||
|
The 2015 Northampton Borough Council election took place on 7 May 2015 as a four-yearly public decision to elect all members of the council. [1] [2] This took place on the same day as other local elections and the 2015 United Kingdom general election - when there is a general election on the same day as the local elections, turnout across the country is with fewer than 1% of exceptions higher than if there is no general election. Voters could cast between one and three votes depending on the number of councillors per ward.
Party | Seats | Gains | Losses | Net gain/loss | Seats % | Votes % | Votes | +/− | |
---|---|---|---|---|---|---|---|---|---|
Conservative | 26 | 0 | 0 | 0 | 57.8 | 41.9 | 55,411 | ||
Labour | 17 | 2 | 0 | 2 | 37.8 | 31.5 | 41,704 | ||
Liberal Democrats | 2 | 0 | 2 | -2 | 4.4 | 11.7 | 15,471 | ||
UKIP | 0 | 0 | 0 | 0 | 0 | 10.2 | 13,458 | ||
Independent | 0 | 0 | 0 | 0 | 0 | 1.8 | 2,424 | ||
Green | 0 | 0 | 0 | 0 | 0 | 2.7 | 3,582 | ||
Northampton - Save Our Public Services | 0 | 0 | 0 | 0 | 0 | 1.0 | 1,014 | ||
BNP | 0 | 0 | 0 | 0 | 0 | 0.3 | 279 | ||
Eccentric Party of Great Britain | 0 | 0 | 0 | 0 | 0 | 0.1 | 63 |
The number in brackets after the ward name is the number of councillors to be elected. An asterisk after the name (*) indicates the candidate was elected. Candidates are listed in order of number of votes. The wards and the numbers of candidates to be elected were both the same as for the 2011 borough election. There were 45 seats for election in total on the borough council, as in 2011.
NOTE: Ballot Papers and Turnout missing from the official records as at 14 May 2015 for East Hunsbury, Nene Valley, Rushmills, Upton and West Hunsbury.
Party | Candidate | Votes | % | ±% | |
---|---|---|---|---|---|
Conservative | Tony Ansell | 1,661 | 38.8 | ||
Labour | Zoe Smith | 1,567 | 36.6 | ||
Labour | Jamal Alwahabi | 1,366 | |||
Conservative | Iftikhar Choudary | 888 | |||
Green | Drew Gray | 719 | 16.8 | ||
Liberal Democrats | Jill Panebianco | 339 | 7.9 | ||
Liberal Democrats | Regina Rogolska | 185 | |||
Turnout | 4,286 | 58.86 | |||
Conservative hold | Swing | ||||
Labour hold | Swing |
Party | Candidate | Votes | % | ±% | |
---|---|---|---|---|---|
Conservative | Andrew Kilbride | 1,670 | 39.3 | ||
Conservative | Christopher Malpas | 1,605 | |||
Labour | Anthea Mitchell | 1,198 | 28.2 | ||
UKIP | Leesa Rogers | 1,045 | 24.6 | ||
Labour | Winston Strachan | 967 | |||
Liberal Democrats | Tahmina Chaudhury | 338 | 8.0 | ||
Turnout | 4,084 | 61.64 | |||
Conservative hold | Swing | ||||
Conservative hold | Swing |
Party | Candidate | Votes | % | ±% | |
---|---|---|---|---|---|
Conservative | Jamie Lane | 1,458 | 60.3 | ||
Labour | Geoffrey Hrebert | 699 | 28.9 | ||
Liberal Democrats | David Garlick | 260 | 10.8 | ||
Turnout | 2,462 | 72.86 | |||
Conservative hold | Swing |
Party | Candidate | Votes | % | ±% | |
---|---|---|---|---|---|
Labour | Clement Chunga | 979 | 48.4 | ||
Conservative | Irum Choudary | 511 | 25.3 | ||
UKIP | Martin de Rosario | 403 | 19.9 | ||
Liberal Democrats | Michael Fuller | 130 | 6.4 | ||
Turnout | 2,039 | 52.95 | |||
Labour hold | Swing |
Party | Candidate | Votes | % | ±% | |
---|---|---|---|---|---|
Labour | Danielle Stone | 2,198 | 47.9 | ||
Labour | Anamul Haque | 1,783 | |||
Labour | Muna Cali | 1,753 | |||
Conservative | Christopher Kellett | 1,073 | 23.4 | ||
Conservative | Gregory Lunn | 938 | |||
Green | Julie Hawkins | 932 | 20.3 | ||
Conservative | Nahar Begum | 919 | |||
Green | Stuart Town | 762 | |||
Liberal Democrats | Aktar Hussein | 987 | 8.4 | ||
Turnout | 4,436 | 50.32 | |||
Labour hold | Swing | ||||
Labour hold | Swing |
Party | Candidate | Votes | % | ±% | |
---|---|---|---|---|---|
Labour | Julie Davenport | 1,883 | 27.8 | ||
Conservative | Graham Walker* | 1,676 | 24.7 | ||
Labour | Victoria Culbard* | 1,579 | |||
Conservative | Richard Cullis | 1,428 | |||
UKIP | Kate Truax | 1,355 | 20.0 | ||
Labour | Walter Wlodzimierz | 1,337 | |||
Conservative | Minesh Kalaria | 1,234 | |||
Liberal Democrats | Brendan Glynane | 1,132 | 16.7 | ||
Liberal Democrats | Michael Ford | 984 | |||
Liberal Democrats | Nicola Hedges | 870 | |||
Northampton - Save Our Public Services | Norman Adams | 462 | 6.8 | ||
BNP | Mark Plowman | 266 | 3.9 | ||
Turnout | 5,556 | 56.03 | |||
Labour hold | Swing | ||||
Conservative hold | Swing | ||||
Labour gain from Liberal Democrats | Swing |
Party | Candidate | Votes | % | ±% | |
---|---|---|---|---|---|
Labour | Elizabeth Gowen | 794 | 37.0 | ||
Conservative | Roy Hickey | 722 | 33.6 | ||
UKIP | Colin Bricher | 457 | 21.3 | ||
Green | Anthony Lochmuller | 105 | 4.9 | ||
Liberal Democrats | Farhana Khan | 70 | 3.3 | ||
Turnout | 1,388 | 38.77 | |||
Labour hold | Swing |
Party | Candidate | Votes | % | ±% | |
---|---|---|---|---|---|
Conservative | Brandon Eldred | 3,312 | 65.1 | ||
Conservative | Philip Larratt | 2,636 | |||
Labour | Anne Wishart | 1,099 | 21.6 | ||
Labour | James Wishart | 815 | |||
Liberal Democrats | Richard Alexander | 676 | 13.3 | ||
Turnout | |||||
Conservative hold | Swing | ||||
Conservative hold | Swing |
Party | Candidate | Votes | % | ±% | |
---|---|---|---|---|---|
Labour | Arthur McCutcheon | 1,124 | 51.6 | ||
Conservative | Naz Islam | 793 | 36.4 | ||
Liberal Democrats | Irene Markham | 261 | 12.0 | ||
Turnout | 2,233 | 63.08 | |||
Labour hold | Swing |
Party | Candidate | Votes | % | ±% | |
---|---|---|---|---|---|
Labour | Teresa Eales | 709 | 44.1 | ||
Conservative | Paul; Clark | 352 | 24.8 | ||
UKIP | Matthew Jones | 381 | 23.7 | ||
Liberal Democrats | Fern Conroy | 117 | 7.3 | ||
Turnout | 1,614 | 49.85 | |||
Labour gain from Liberal Democrats | Swing |
Party | Candidate | Votes | % | ±% | |
---|---|---|---|---|---|
Labour | Catherine Russell | 876 | 36.9 | ||
Conservative | Samuel Rumens | 726 | 30.6 | ||
UKIP | Beverley Mennell | 423 | 17.8 | ||
Liberal Democrats | Marianne Taylor | 285 | 12.0 | ||
Eccentric Party of Great Britain | Lord Bungle | 63 | 2.7 | ||
Turnout | 2,388 | 60.92 | |||
Labour hold | Swing |
Party | Candidate | Votes | % | ±% | |
---|---|---|---|---|---|
Liberal Democrats | Sally Beardsworth | 924 | 34.7 | ||
Conservative | Michael O'Connor | 776 | 29.2 | ||
UKIP | Alan Hames | 449 | 16.9 | ||
Labour | Barry Kirkby | 410 | 15.4 | ||
Green | Stephen Miller | 101 | 3.8 | ||
Turnout | 2,663 | 72.23 | |||
Liberal Democrats hold | Swing |
Party | Candidate | Votes | % | ±% | |
---|---|---|---|---|---|
Conservative | Michael Hill | 2,444 | 42.4 | ||
Conservative | Jonathan Nunn | 2,102 | |||
UKIP | Michael Jones | 1,129 | 19.6 | ||
Labour | Joseph Atkins | 846 | 14.7 | ||
Labour | Denise O'Hora | 807 | |||
Independent | Liam Costello | 783 | 13.6 | ||
Liberal Democrats | John Crake | 568 | 9.8 | ||
Turnout | |||||
Conservative hold | Swing | ||||
Conservative hold | Swing |
Party | Candidate | Votes | % | ±% | |
---|---|---|---|---|---|
Conservative | Matthew Goldby | 2,507 | 41.4 | ||
Conservative | John Caswell | 2,181 | |||
UKIP | Daniel Guild | 1,355 | 22.4 | ||
Labour | Alan Kingston | 1,067 | 17.6 | ||
Labour | Timothy Jeche | 727 | |||
Independent | David Huffadine-Smith | 425 | 7.0 | ||
Green | Lian Allen | 373 | 6.2 | ||
Liberal Democrats | Julia Maddison | 329 | 5.4 | ||
Turnout | 5,409 | 69.54 | |||
Conservative hold | Swing | ||||
Conservative hold | Swing |
Party | Candidate | Votes | % | ±% | |
---|---|---|---|---|---|
Conservative | Samuel Shaw | 532 | 33.0 | ||
UKIP | Tom Appleyard | 454 | 28.2 | ||
Labour | Paul Joyce | 400 | 24.8 | ||
Independent | Justin Brown | 139 | 8.6 | ||
Liberal Democrats | Trini Crake | 86 | 5.3 | ||
Turnout | 1,617 | 66.74 | |||
Conservative hold | Swing |
Party | Candidate | Votes | % | ±% | |
---|---|---|---|---|---|
Conservative | Timothy Hadland | 1,985 | 43.1 | ||
Conservative | Suresh Patel | 1,316 | |||
Labour | Christopher Gardner | 916 | 19.9 | ||
UKIP | Dusan Torbica | 889 | 19.3 | ||
Labour | Geraldine Tandoh | 841 | |||
Northampton - Save Our Public Services | David Green | 552 | 12.0 | ||
Liberal Democrats | Roger Conroy | 268 | 5.8 | ||
Turnout | 4,326 | 65.59 | |||
Conservative hold | Swing | ||||
Conservative hold | Swing |
Party | Candidate | Votes | % | ±% | |
---|---|---|---|---|---|
Conservative | Mary Markham | 1,622 | 58.0 | ||
Labour | Mark Wall | 621 | 22.2 | ||
UKIP | Roger Feist | 370 | 13.2 | ||
Liberal Democrats | Axel Landmann | 182 | 6.5 | ||
Turnout | 2,813 | 76.44 | |||
Conservative hold | Swing |
Party | Candidate | Votes | % | ±% | |
---|---|---|---|---|---|
Conservative | Michael Hallam | 1,527 | 59.0 | ||
Labour | Mohammed Miah | 540 | 20.9 | ||
UKIP | Karim El-Ayoubi | 359 | 13.9 | ||
Liberal Democrats | Michael Torpy | 161 | 6.2 | ||
Turnout | 2,604 | 70.66 | |||
Conservative hold | Swing |
Party | Candidate | Votes | % | ±% | |
---|---|---|---|---|---|
Conservative | Anna King | 799 | 35.4 | ||
Labour | Stephen O'Connor | 689 | 30.5 | ||
UKIP | Mark Unwin | 307 | 13.6 | ||
Green | Marcus Rock | 238 | 10.5 | ||
Liberal Democrats | Pamela Varnsverry | 225 | 10.0 | ||
Turnout | 1,713 | 55.24 | |||
Conservative hold | Swing |
Party | Candidate | Votes | % | ±% | |
---|---|---|---|---|---|
Conservative | James Hill | 814 | 38.9 | ||
Labour | Glash Uddin | 631 | 30.2 | ||
UKIP | Toni Walker | 505 | 24.1 | ||
Liberal Democrats | Cella Burge | 142 | 6.8 | ||
Turnout | 2,117 | 57.37 | |||
Conservative hold | Swing |
Party | Candidate | Votes | % | ±% | |
---|---|---|---|---|---|
Conservative | Stephen Hibbert | 799 | 42.0 | ||
Labour | Tipu Rahman | 568 | 29.9 | ||
UKIP | Thomas Harrison | 420 | 22.1 | ||
Liberal Democrats | Richard Arterton | 114 | 6.0 | ||
Turnout | 1,912 | 54.69 | |||
Conservative hold | Swing |
Party | Candidate | Votes | % | ±% | |
---|---|---|---|---|---|
Conservative | Penelope Flavell | 1,212 | 52.3 | ||
Labour | Janet Phillips | 601 | 25.9 | ||
UKIP | Max Titmuss | 315 | 13.6 | ||
Liberal Democrats | Paul Schofield | 188 | 8.1 | ||
Turnout | |||||
Conservative hold | Swing |
Party | Candidate | Votes | % | ±% | |
---|---|---|---|---|---|
Labour | Les Marriott | 642 | 38.2 | ||
Liberal Democrats | Sarah Ukdall | 489 | 29.1 | ||
Conservative | Laura Eldred | 301 | 17.9 | ||
UKIP | Ian Gibbins | 247 | 14.7 | ||
Turnout | 1,700 | 49.42 | |||
Labour hold | Swing |
Party | Candidate | Votes | % | ±% | |
---|---|---|---|---|---|
Labour | Gareth Eales | 866 | 42.8 | ||
Conservative | Tim Armit | 452 | 22.3 | ||
UKIP | Irene McGowan | 428 | 21.1 | ||
Liberal Democrats | Sadik Chaudhury | 279 | 13.8 | ||
Turnout | 2,038 | 56.67 | |||
Labour hold | Swing |
Party | Candidate | Votes | % | ±% | |
---|---|---|---|---|---|
Conservative | Mohammed Rahman | 954 | 35.3 | ||
UKIP | Robin Fruish | 691 | 25.6 | ||
Labour | Philippa Smith | 650 | 24.1 | ||
Liberal Democrats | Michael Beardsworth | 251 | 9.3 | ||
Green | Daniel Kelsey | 142 | 5.3 | ||
BNP | Raymond Beasley | 13 | 0.5 | ||
Turnout | 2,716 | 72.27 | |||
Conservative hold | Swing |
Party | Candidate | Votes | % | ±% | |
---|---|---|---|---|---|
Labour | Nazim Choudary | 708 | 40.8 | ||
Conservative | Arthur Newbury | 478 | 27.6 | ||
UKIP | Michael Baker | 448 | 25.8 | ||
Liberal Democrats | Martin Taylor | 101 | 5.8 | ||
Turnout | 1,747 | 54.10 | |||
Labour hold | Swing |
Party | Candidate | Votes | % | ±% | |
---|---|---|---|---|---|
Labour | Rufia Ashraf | 725 | 39.4 | ||
Liberal Democrats | Jill Hope | 454 | 24.6 | ||
Conservative | Phillip Buchan | 382 | 20.7 | ||
UKIP | David Lewis | 281 | 15.3 | ||
Turnout | 1,858 | 54.58 | |||
Labour hold | Swing |
Party | Candidate | Votes | % | ±% | |
---|---|---|---|---|---|
Conservative | Nilesh Parekh | 1,007 | 52.7 | ||
Labour | Titus Ajayi | 546 | 28.6 | ||
Liberal Democrats | Mary Paterson | 358 | 18.7 | ||
Turnout | 1,941 | 60.54 | |||
Conservative hold | Swing |
Party | Candidate | Votes | % | ±% | |
---|---|---|---|---|---|
Liberal Democrats | Dennis Meredith | 1,368 | 30.9 | ||
Labour | Janice Duffy | 1,342 | 30.3 | ||
Labour | Andrew Porter | 1,106 | |||
UKIP | John Allen | 955 | 21.6 | ||
Liberal Democrats | Veronica Meredith | 910 | |||
Conservative | Francesca King | 764 | 17.2 | ||
Conservative | Julie Rolfe | 576 | |||
Turnout | 4,022 | 52.45 | |||
Liberal Democrats hold | Swing | ||||
Labour hold | Swing |
Party | Candidate | Votes | % | ±% | |
---|---|---|---|---|---|
Labour | Jane Birch | 515 | 29.7 | ||
Conservative | Arif Rahman | 370 | 21.3 | ||
Liberal Democrats | Brian Hoare | 366 | 21.1 | ||
UKIP | John Howsam | 249 | 14.4 | ||
Green | Anthony Clarke | 234 | 13.5 | ||
Turnout | 1,739 | 57.51 | |||
Labour hold | Swing |
Party | Candidate | Votes | % | ±% | |
---|---|---|---|---|---|
Conservative | Alan Bottwood | 1,755 | 62.8 | ||
Conservative | Brian Sargeant | 1,522 | |||
Labour | Leanne Ward | 699 | 25.0 | ||
Labour | Repon Miah | 578 | |||
Liberal Democrats | Daniel Jones | 340 | 12.2 | ||
Turnout | No data | No data | |||
Conservative hold | Swing | ||||
Conservative hold | Swing |
Party | Candidate | Votes | % | ±% | |
---|---|---|---|---|---|
Conservative | Brian Oldham | 1,666 | 70.5 | ||
Labour | Alan Smith | 478 | 20.2 | ||
Liberal Democrats | Cerri Glynane | 220 | 9.3 | ||
Turnout | No data | No data | |||
Conservative hold | Swing |
Party | Candidate | Votes | % | ±% | |
---|---|---|---|---|---|
Conservative | Matthew Lynch | 1,318 | 56.0 | ||
Labour | Toby Birch | 722 | 30.7 | ||
Liberal Democrats | Charles Markham | 315 | 13.4 | ||
Turnout | 2,355 | 67.51 | |||
Conservative hold | Swing |
Anthony Richard Clarke, known as Tony Clarke, is a British former Member of Parliament, who is currently a teacher at Northampton College. A politician of the left, Clarke was until recently the Green Party National Spokesperson on International and Foreign Affairs; previously a British Labour Party politician, he was Member of Parliament for Northampton South from 1997 to 2005. Clarke was also a director of Northampton Town F.C. for 11 years from 1999 to 2010, and served as General Manager at the club between 2005 and 2008. He served three terms on Northampton Borough Council and one term on Northamptonshire County Council (Independent). He also served as a Special Constable with Northamptonshire Police between 2003 and 2007.
Guildford Borough Council in Surrey, England is elected every four years.
The 2006 Barnet Council election took place on 4 May 2006 to elect members of Barnet London Borough Council in London, England. The whole council was up for election and the Conservative party stayed in overall control of the council.
Elections to the Borough Council in Slough, England, were held on 3 May 2007. One third of the council was up for election. This was the 122nd Slough general local authority election since Slough became a local government unit in 1863.
Local government elections took place in London, and some other parts of the United Kingdom on Thursday 6 May 2010. Polling stations were open between 7am and 10pm.
An election for the Borough Council in Slough, England, was held on 6 May 2010. This was the 124th Slough general local authority election since Slough became a local government unit in 1863.
Elections for Southwark Council were held on 6 May 2010. The 2010 General Election and other local elections took place on the same day.
The 2011 council elections in Guildford saw the Conservatives retain control over Guildford Borough Council with an increased majority of 20 seats. Full results for each ward can be found at Guildford Council election, full results, 2011.
The 2004 Colchester Borough Council election took place on 10 June 2004 to elect members of Colchester Borough Council in Essex, England. This was the same day as the other 2004 United Kingdom local elections and as the 2004 European Parliament Elections. One third of the seats were up for election and the council stayed under no overall control.
Elections to the Charnwood Borough Council took place on 5 May 2011, in line with other local elections in the United Kingdom. A total of 52 councillors were elected from 28 wards as the whole council was up for election.
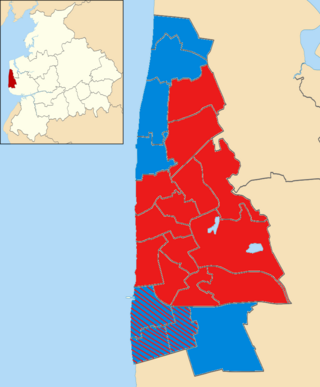
The 2015 Blackpool Borough Council election took place on 7 May 2015 to elect members of Blackpool Borough Council in England. All 21 wards of 2 seats each on the council were contested with newly elected members next due to serve a four-year term and next contest their seats in 2019. This election took place on the same day as other local elections as well as the 2015 UK General Election.
The by-thirds 2015 Slough Borough Council election took place on 7 May 2015 to elect approximately one third of the members of Slough Borough Council in England to coincide with other local elections, an election which was held simultaneously with the 2015 General Election, resulting in higher turnout than the previous election.
The 2015 Cotswold District Council election took place on 7 May 2015 to elect all members of Cotswold District Council in England. The whole council was up for election. Turnout was substantially up across the district due to the election being held on the same day as the general election and other local elections in England.
The by-thirds 2015 Elmbridge Borough Council election took place on 7 May 2015 to elect members of Elmbridge Borough Council in England. This was on the same day as other local elections.
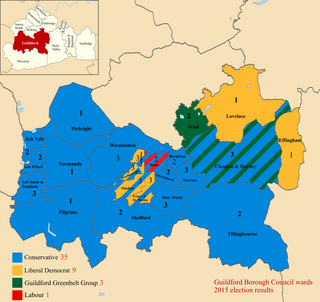
The 2015 Guildford Borough Council election took place on 7 May 2015 to elect members of Guildford Borough Council in England as one of the 2015 local elections, held simultaneously with the General Election.
The 2015 Woking Borough Council election took place on 7 May 2015 to elect one third of members to Woking Borough Council in England coinciding with other local elections held simultaneously with a General Election which resulted in increased turnout compared to the election four years before. Elections in each ward are held in three years out of four.
Elections to Northampton Borough Council were held on 5 May 2011. The whole council was up for election and the Liberal Democrats Lost overall control of the council to the Conservative Party. There was no General Election taking place at the same time.
Elections to Mid Bedfordshire District Council were held on 3 May 1979, on the same day as the general election, so turnout was higher than usual in district council elections for Mid Bedfordshire. All 53 seats were up for election.
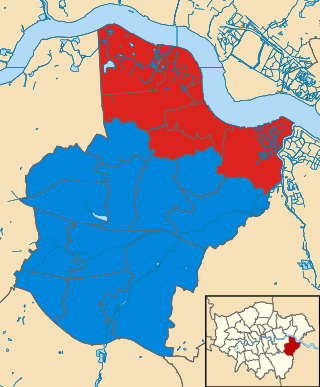
The 2022 Bexley London Borough Council election took place on 5 May 2022. 45 members of Bexley London Borough Council were elected. The elections took place alongside local elections in the other London boroughs and elections to local authorities across the United Kingdom.
The 2022 Conwy County Borough Council election took place on Thursday 5 May 2022 to elect all 55 members of Conwy County Borough Council. It was held on the same day as all other councils in Wales, as part of the 2022 Welsh local elections.