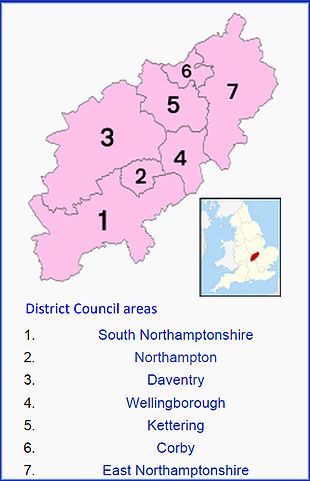
| ||||||||||||||||||||||||||||||||||||||||||||||||||||||||
All 73 seats in the Northamptonshire County Council 37 seats needed for a majority | ||||||||||||||||||||||||||||||||||||||||||||||||||||||||
---|---|---|---|---|---|---|---|---|---|---|---|---|---|---|---|---|---|---|---|---|---|---|---|---|---|---|---|---|---|---|---|---|---|---|---|---|---|---|---|---|---|---|---|---|---|---|---|---|---|---|---|---|---|---|---|---|
| ||||||||||||||||||||||||||||||||||||||||||||||||||||||||
Map showing the results of the 2009 Northamptonshire County Council elections. | ||||||||||||||||||||||||||||||||||||||||||||||||||||||||
|
Elections to Northamptonshire County Council took place on 4 June 2009, having been delayed from 7 May, in order to coincide with elections to the European Parliament. The Liberal Democrats replaced the Labour Party as the main opposition.
Party | Seats | Gains | Losses | Net gain/loss | Seats % | Votes % | Votes | +/− | |
---|---|---|---|---|---|---|---|---|---|
Conservative | 56 | 12 | -1 | +11 | 76.7 | 51.3 | 96,788 | ||
Liberal Democrats | 9 | 4 | -2 | +2 | 12.3 | 20.8 | 39,170 | ||
Labour | 6 | 0 | -15 | -15 | 8.2 | 19.5 | 36,685 | ||
Green | 0 | 0 | 0 | 0 | 0 | 2.3 | 4,341 | ||
Independent | 2 | 2 | 0 | +2 | 2.7 | 2.2 | 4,159 | ||
BNP | 0 | 0 | 0 | 0 | 0 | 2.0 | 3,825 | ||
English Democrat | 0 | 0 | 0 | 0 | 0 | 0.9 | 1,746 | ||
Save Our Services | 0 | 0 | 0 | 0 | 0 | 0.8 | 1,446 | ||
CPA | 0 | 0 | 0 | 0 | 0 | 0.2 | 424 |
Party | Candidate | Votes | % | |
---|---|---|---|---|
Labour | Mark Bullock (*) | 885 | 48.6 | |
Conservative | Lisa Jones | 353 | 19.4 | |
Liberal Democrats | Eddie McGeown | 327 | 18.0 | |
BNP | Roy Davies | 256 | 14.1 | |
Majority | 532 | 29.2 | ||
Turnout | 1,821 | 29.7 | ||
Labour hold |
Party | Candidate | Votes | % | |
---|---|---|---|---|
Conservative | Stan Heggs | 1,384 | 48.8 | |
Liberal Democrats | Phil Bromhall | 744 | 26.2 | |
Labour | Mary Butcher | 708 | 25 | |
Majority | 640 | 22.6 | ||
Turnout | 2,836 | |||
Conservative hold |
Party | Candidate | Votes | % | |
---|---|---|---|---|
Liberal Democrats | Chris Stanbra | 1,135 | 40 | |
Conservative | David John Sims | 1,007 | 34.8 | |
Labour | Jim McKellar | 732 | 25.3 | |
Majority | 128 | 5.2 | ||
Turnout | 2,896 | 29.5 | ||
Liberal Democrats hold |
Party | Candidate | Votes | % | |
---|---|---|---|---|
Labour | John McGee | 938 | 46.9 | |
Conservative | Yvonne Elizabeth Alice Von Bujtar | 560 | 28 | |
Liberal Democrats | Barry O'Brian | 504 | 25.2 | |
Majority | 378 | 18.9 | ||
Turnout | 2,002 | 31.67 | ||
Labour hold |
Party | Candidate | Votes | % | |
---|---|---|---|---|
Labour | Bob Scott | 982 | 44.9 | |
Conservative | Lynne Anne Wilson | 526 | 24.1 | |
BNP | Gordon Riddell | 363 | 16.6 | |
Liberal Democrats | Scott Ponton | 314 | 14.4 | |
Majority | 456 | 20.8 | ||
Turnout | 2,185 | 32.67 | ||
Labour hold |
Party | Candidate | Votes | % | |
---|---|---|---|---|
Labour | Julie Brookfield | 904 | 40.1 | |
Conservative | Eve Howitt | 645 | 28.6 | |
BNP | Annette Carroll | 397 | 17.6 | |
Liberal Democrats | Terri Meechan | 308 | 13.7 | |
Majority | 259 | 11.5 | ||
Turnout | 2,254 | 32.18 | ||
Labour hold |
Party | Candidate | Votes | % | |
---|---|---|---|---|
Conservative | Robin Brown | 1,934 | 59.7 | |
Liberal Democrats | John Barry Lathan | 903 | 27.9 | |
Labour | Maureen Winifred Luke | 400 | 12.4 | |
Majority | 1,031 | 31.8 | ||
Turnout | 3,237 | 40.84 | ||
Conservative hold |
Party | Candidate | Votes | % | |
---|---|---|---|---|
Conservative | Chris Millar | 2,344 | 72.3 | |
Liberal Democrats | Micheal Beardsworth | 612 | 18.9 | |
Labour | Paul Anthony Corazzo | 287 | 8.8 | |
Majority | 1,732 | 53.4 | ||
Turnout | 3,243 | 42.18 | ||
Conservative hold |
Party | Candidate | Votes | % | |
---|---|---|---|---|
Conservative | Alan Hills | 1,393 | 61.7 | |
Liberal Democrats | Trinni Crake | 445 | 19.7 | |
Labour | Penny Price | 421 | 18.6 | |
Majority | 948 | 42 | ||
Turnout | 2,259 | 29.9 | ||
Conservative hold |
Party | Candidate | Votes | % | |
---|---|---|---|---|
Conservative | Chris Long | 1,166 | 47.2 | |
BNP | David Jones | 451 | 18.3 | |
Labour | Betty Richards | 449 | 18.2 | |
Liberal Democrats | John Kenneth Crake | 405 | 16.4 | |
Majority | 715 | 28.9 | ||
Turnout | 2,471 | 28.65 | ||
Conservative hold |
Party | Candidate | Votes | % | |
---|---|---|---|---|
Conservative | Steve Osbourne | 1,743 | 62.7 | |
Liberal Democrats | Neil Arthur Crispin Farmer | 672 | 24.2 | |
Labour | Chris Meyers | 367 | 13.2 | |
Majority | 1071 | 38.5 | ||
Turnout | 2,782 | 43.54 | ||
Conservative hold |
Party | Candidate | Votes | % | |
---|---|---|---|---|
Conservative | Judy Shepard | 1,938 | 73.5 | |
Liberal Democrats | David Garlick | 697 | 26.5 | |
Majority | 1241 | 47 | ||
Turnout | 2,635 | 41.46 | ||
Conservative hold |
Party | Candidate | Votes | % | |
---|---|---|---|---|
Conservative | Catherine Broadman | 2,407 | 68.2 | |
Green | Kathy Wicksteed | 450 | 12.7 | |
Liberal Democrats | Ruth Williams | 363 | 10.3 | |
Labour | Sue Meyers | 311 | 8.8 | |
Majority | 1,957 | 55.5 | ||
Turnout | 3,531 | 45.74 | ||
Conservative hold |
Party | Candidate | Votes | % | |
---|---|---|---|---|
Conservative | Gina Ogden | 1,715 | 63.5 | |
Liberal Democrats | Christopher Robin Salaman | 672 | 24.9 | |
Labour | Bruce Armstrong Nichols | 314 | 11.6 | |
Majority | 1,043 | 38.6 | ||
Turnout | 2,701 | 38.44 | ||
Conservative hold |
Party | Candidate | Votes | % | |
---|---|---|---|---|
Conservative | Derek Lawson | 2,245 | ||
Labour | Alan Dunn | 690 | ||
Majority | ||||
Turnout | 2,935 | 36.37 |
Party | Candidate | Votes | % | |
---|---|---|---|---|
Conservative | Andrew Langley | 1,900 | ||
Labour | John Gray | 906 | ||
Majority | ||||
Turnout | 2,806 | 35.23 |
Party | Candidate | Votes | % | |
---|---|---|---|---|
Conservative | Rupert Reichhold | 1,943 | ||
Liberal Democrats | Grant Bowles | 631 | ||
Labour | Paul King | 443 | ||
Majority | ||||
Turnout | 3,017 | 43.81 |
Party | Candidate | Votes | % | |
---|---|---|---|---|
Conservative | Heather Smith | 2,062 | ||
Liberal Democrats | Ian Preston | 530 | ||
Labour | David Fisher | 307 | ||
Majority | ||||
Turnout | 2,899 | 47.59 |
Party | Candidate | Votes | % | |
---|---|---|---|---|
Conservative | Dudley Hughes | 1,298 | ||
Green | Ryta Lyndley | 585 | ||
Labour | Neil Harvey | 452 | ||
Majority | ||||
Turnout | 2,335 | 35.54 |
Party | Candidate | Votes | % | |
---|---|---|---|---|
Conservative | Andrew Mercer | 1,358 | ||
Liberal Democrats | David Hooton | 581 | ||
Labour | Stephen Allen | 468 | ||
Majority | ||||
Turnout | 2,407 | 31.84 |
Party | Candidate | Votes | % | |
---|---|---|---|---|
Conservative | Michael Tye | 1,861 | ||
Liberal Democrats | James Wilson | 467 | ||
Labour | Christine Allen | 406 | ||
BNP | Wim Wauters | 317 | ||
Majority | ||||
Turnout | 3,051 | 37.94 |
Party | Candidate | Votes | % | |
---|---|---|---|---|
Conservative | Ronald Pinnock | 1,208 | ||
Labour | Robert Nightingale | 402 | ||
BNP | Derry Smith | 320 | ||
Liberal Democrats | Rachel Fearnley | 298 | ||
Majority | ||||
Turnout | 2,228 | 34.25 |
Party | Candidate | Votes | % | |
---|---|---|---|---|
Conservative | Bob Seery | 1,729 | ||
Liberal Democrats | Cerri Glynane | 613 | ||
Labour | Kevin McKeever | 398 | ||
Majority | ||||
Turnout | 2,740 | 36.97 |
Party | Candidate | Votes | % | |
---|---|---|---|---|
Conservative | Bill Parker | 1,204 | ||
Labour | Ellie Mans | 452 | ||
English Democrat | Derek Hilling | 420 | ||
Liberal Democrats | Alan Window | 219 | ||
Green | David Lane | 189 | ||
Majority | ||||
Turnout | 2,484 | 39.69 |
Party | Candidate | Votes | % | |
---|---|---|---|---|
Independent | Christopher Groome | 1,321 | ||
Conservative | Christopher Lamb | 958 | ||
Labour | Ronald Steele | 348 | ||
Majority | ||||
Turnout | 2,627 | 36.72 |
Party | Candidate | Votes | % | |
---|---|---|---|---|
Conservative | Belinda Humfrey | 1,801 | ||
Labour | Mark Watson | 636 | ||
Liberal Democrats | Philip Rice | 581 | ||
Majority | ||||
Turnout | 3,018 | 39.38 |
Party | Candidate | Votes | % | |
---|---|---|---|---|
Conservative | Carolyn Maxted | 477 | ||
Labour | Eileen Hales | 463 | ||
Independent | Roy Mayhew | 459 | ||
BNP | Clive Skinner | 245 | ||
Liberal Democrats | Michael Quinn | 126 | ||
Majority | ||||
Turnout | 1,770 | 30.73 |
Party | Candidate | Votes | % | |
---|---|---|---|---|
Conservative | Bob Civil | 1,276 | ||
Liberal Democrats | Chris Nelson | 925 | ||
Labour | Adrian Perrin | 342 | ||
Majority | ||||
Turnout | 2,543 | 40.96 |
Party | Candidate | Votes | % | |
---|---|---|---|---|
Conservative | Larry Henson | 1,276 | ||
Labour | Keli Watts | 958 | ||
Liberal Democrats | Jehad Soliman | 444 | ||
Majority | ||||
Turnout | 35.71 |
Party | Candidate | Votes | % | |
---|---|---|---|---|
Conservative | Jim Harker | 2,625 | ||
Liberal Democrats | Stan Freeman | 798 | ||
Labour | Peter Weston | 546 | ||
Majority | ||||
Turnout | 3,969 | 45.4 |
Party | Candidate | Votes | % | |
---|---|---|---|---|
Conservative | Alan Clifford | 1,130 | ||
Labour | Alan Mills | 649 | ||
Independent | Kevin Sills | 259 | ||
Liberal Democrats | Daniel Garside | 231 | ||
Majority | ||||
Turnout | 2,269 | 38.39 |
Party | Candidate | Votes | % | |
---|---|---|---|---|
Conservative | Matt Lynch | 1,360 | ||
Labour | Jonathan West | 655 | ||
Liberal Democrats | Cindy McGrath | 339 | ||
Green | Alan Heath | 314 | ||
Majority | ||||
Turnout | 2,668 | 35.09 |
Party | Candidate | Votes | % | |
---|---|---|---|---|
Conservative | Scott Edwards | 1,449 | ||
Liberal Democrats | Chris McGlynn | 664 | ||
Labour | Maggie Don | 608 | ||
Majority | ||||
Turnout | 2,721 | 37.82 |
Party | Candidate | Votes | % | |
---|---|---|---|---|
Conservative | Rebecca Harding | 624 | ||
Liberal Democrats | Brian Hoare | 615 | ||
Green | Jac Higgs | 440 | ||
Labour | Trevor Owen | 376 | ||
Majority | ||||
Turnout | 2,055 | 29.7 |
Party | Candidate | Votes | % | |
---|---|---|---|---|
Conservative | Christopher Malpas | 1,176 | ||
Labour | Trevor Bailey | 516 | ||
Liberal Democrats | Philip Buchan | 389 | ||
Majority | ||||
Turnout | 2,081 | 33.17 |
Party | Candidate | Votes | % | |
---|---|---|---|---|
Conservative | Graham Lawman | 969 | ||
Liberal Democrats | John Yates | 878 | ||
Labour | Janet Phillips | 496 | ||
Majority | ||||
Turnout | 2,343 | 37.37 |
Party | Candidate | Votes | % | |
---|---|---|---|---|
Independent | Tony Clarke | 760 | ||
Labour | Tess Scott | 440 | ||
Conservative | Ian McCann | 361 | ||
Green | Julie Hawkins | 201 | ||
Liberal Democrats | Roger Conroy | 194 | ||
Majority | ||||
Turnout | 1,956 | 26.65 |
Party | Candidate | Votes | % | |
---|---|---|---|---|
Liberal Democrats | Brendan Glynane | 662 | ||
Conservative | Mick Ford | 621 | ||
Labour | Kathy Smith | 372 | ||
BNP | Clive Lomax | 275 | ||
Save Our Services | Norman Adams | 219 | ||
Majority | ||||
Turnout | 2,149 | 30.03 |
Party | Candidate | Votes | % | |
---|---|---|---|---|
Conservative | Andre Gonzalez de Savage | 1,258 | ||
Liberal Democrats | Shaun Hope | 539 | ||
Labour | Robert Burnell | 351 | ||
Majority | ||||
Turnout | 2,148 | 32.7 |
Party | Candidate | Votes | % | |
---|---|---|---|---|
Conservative | Alan Wright | 832 | ||
Liberal Democrats | Jean Hawkins | 686 | ||
Labour | Steve O'Connor | 323 | ||
BNP | Jim Avery | 239 | ||
CPA | Colin Bricher | 112 | ||
English Democrat | Teresa Cannon | 110 | ||
Majority | ||||
Turnout | 2,302 | 34.99 |
Party | Candidate | Votes | % | |
---|---|---|---|---|
Conservative | David Mackintosh | 853 | ||
Labour | Keith Davies | 497 | ||
Liberal Democrats | Prince Chaudhury | 402 | ||
Majority | ||||
Turnout | 1,752 | 34.66 |
Party | Candidate | Votes | % | |
---|---|---|---|---|
Liberal Democrats | Marion Minney | 904 | ||
Conservative | Brian Sargeant | 828 | ||
English Democrat | Sue Willis | 502 | ||
Labour | Nadim Choudary | 414 | ||
Majority | ||||
Turnout | 2,648 | 41.8 |
Party | Candidate | Votes | % | |
---|---|---|---|---|
Liberal Democrats | Richard Church | 709 | ||
Independent | Fitzy Fitzpatrick | 493 | ||
Labour | Catherine Russell | 463 | ||
Conservative | Gary Austin | 457 | ||
Green | Marcus Rock | 284 | ||
Majority | ||||
Turnout | 2,406 | 34.09 |
Party | Candidate | Votes | % | |
---|---|---|---|---|
Liberal Democrats | Sally Beardsworth | 1,173 | ||
Conservative | Laura Hutchings | 633 | ||
BNP | Ray Beasley | 392 | ||
Labour | Chris Grethe | 328 | ||
Majority | ||||
Turnout | 2,526 | 37.83 |
Party | Candidate | Votes | % | |
---|---|---|---|---|
Liberal Democrats | Richard Giddings | 527 | ||
Labour | Ulric Gravesande | 524 | ||
Conservative | Lesley Callnon | 351 | ||
Save Our Services | Harry Tuttle | 277 | ||
Majority | ||||
Turnout | 1,679 | 29.19 |
Party | Candidate | Votes | % | |
---|---|---|---|---|
Conservative | Phil Larratt | 1,943 | ||
Liberal Democrats | Laura Glynane | 773 | ||
Labour | Michael Vaughan | 409 | ||
Majority | ||||
Turnout | 3,125 | 36.32 |
Party | Candidate | Votes | % | |
---|---|---|---|---|
Conservative | Matthew Goldby | 1,719 | ||
Labour | Geoff Howes | 375 | ||
Liberal Democrats | Suzanne Jwanczuk | 322 | ||
Majority | ||||
Turnout | 2,416 | 37.71 |
Party | Candidate | Votes | % | |
---|---|---|---|---|
Conservative | Don Edwards | 1,011 | ||
Save Our Services | Dave Green | 950 | ||
Labour | Janice Duffy | 351 | ||
Liberal Democrats | Daniel Jwanczuk | 89 | ||
Majority | ||||
Turnout | 2,401 | 38.4 |
Party | Candidate | Votes | % | |
---|---|---|---|---|
Conservative | Mike Hallam | 1,390 | ||
Liberal Democrats | Portia Wilson | 962 | ||
Labour | Ifty Choudary | 303 | ||
CPA | Philip Bricher | 167 | ||
Majority | ||||
Turnout | 2,822 | 44.88 |
Party | Candidate | Votes | % | |
---|---|---|---|---|
Liberal Democrats | Jenny Conroy | 793 | ||
Labour | Anjona Roy | 577 | ||
Conservative | Ivan Sljivic | 392 | ||
Majority | ||||
Turnout | 1,762 | 28.99 |
Party | Candidate | Votes | % | |
---|---|---|---|---|
Labour | Winston Strachan | 603 | ||
Independent | Russ Cooper | 494 | ||
Conservative | Penny Flavel | 460 | ||
Green | Hannah Gibson | 225 | ||
Liberal Democrats | Fern Conroy | 198 | ||
Majority | ||||
Turnout | 1,980 | 30.13 |
Party | Candidate | Votes | % | |
---|---|---|---|---|
Liberal Democrats | Jane Hollis | 596 | ||
Conservative | Richard Cullis | 589 | ||
Labour | Ven Subbarayan | 572 | ||
Majority | ||||
Turnout | 1,757 | 26.98 |
Party | Candidate | Votes | % | |
---|---|---|---|---|
Conservative | Suresh Patel | 943 | ||
Labour | Terry Wire | 724 | ||
Liberal Democrats | Pam Varnsverry | 507 | ||
Majority | ||||
Turnout | 2,174 | 32.43 |
Party | Candidate | Votes | % | |
---|---|---|---|---|
Liberal Democrats | Dennis Meredith | 806 | ||
Conservative | Ray Kelly | 352 | ||
Labour | Joy Capstick | 307 | ||
Green | Mark Eales | 204 | ||
Majority | ||||
Turnout | 1,669 | 30.27 |
Party | Candidate | Votes | % | |
---|---|---|---|---|
Conservative | David Hugheston-Roberts | 1,642 | ||
Liberal Democrats | Paul Varnsverry | 1,031 | ||
Labour | Kathleen Franklin | 282 | ||
Majority | ||||
Turnout | 2,955 | 39.24 |
Party | Candidate | Votes | % | |
---|---|---|---|---|
Conservative | Stephen Legg | 1,668 | ||
Liberal Democrats | Maureen Hill | 537 | ||
Green | Ellie Shelton | 401 | ||
Labour | Bob Purser | 368 | ||
Majority | ||||
Turnout | 2,974 | 43.82 |
Party | Candidate | Votes | % | |
---|---|---|---|---|
Conservative | Andrew Grant | 1,803 | ||
Liberal Democrats | Martin Johns | 811 | ||
Labour | Samuel Emerson | 297 | ||
Majority | ||||
Turnout | 2,911 | 36.31 |
Party | Candidate | Votes | % | |
---|---|---|---|---|
Conservative | Ron Sawbridge | 1,765 | ||
Liberal Democrats | Malcolm Mildren | 596 | ||
Labour | Gemma Maxwell-Evans | 246 | ||
Majority | ||||
Turnout | 2,607 | 41.23 |
Party | Candidate | Votes | % | |
---|---|---|---|---|
Conservative | Joan Kirkbride | 1,715 | ||
Liberal Democrats | Sue Pace | 665 | ||
Labour | Lynda Davies | 330 | ||
Majority | ||||
Turnout | 2,710 | 41.94 |
Party | Candidate | Votes | % | |
---|---|---|---|---|
Conservative | Allan Walker | 1,918 | ||
Liberal Democrats | Hannah Saul | 755 | ||
Labour | Ann Macfarlane | 399 | ||
Majority | ||||
Turnout | 3,072 | 40.52 |
Party | Candidate | Votes | % | |
---|---|---|---|---|
Conservative | Ben Smith | 2,268 | ||
Liberal Democrats | Christopher Lofts | 814 | ||
Labour | Wendy Randall | 253 | ||
Majority | ||||
Turnout | 3,335 | 46.79 |
Party | Candidate | Votes | % | |
---|---|---|---|---|
Conservative | Michael Clark | 2,127 | ||
Liberal Democrats | Marianne Taylor | 888 | ||
Majority | ||||
Turnout | 3,015 | 46.1 |
Party | Candidate | Votes | % | |
---|---|---|---|---|
Conservative | Ken Melling | 1,875 | ||
Liberal Democrats | David Austin | 806 | ||
Labour | David James | 336 | ||
Majority | ||||
Turnout | 3,017 | 39.58 |
Party | Candidate | Votes | % | |
---|---|---|---|---|
Conservative | Bernard Ingram | 1,859 | ||
Liberal Democrats | Richard Matthews | 777 | ||
Independent | Mark James | 401 | ||
Labour | Thomas Clugston | 314 | ||
Majority | ||||
Turnout | 3,351 | 38.89 |
Party | Candidate | Votes | % | |
---|---|---|---|---|
Conservative | Rosemary Bromwich | 1,648 | ||
Liberal Democrats | Scott Collins | 760 | ||
Labour | Giles Barringham | 293 | ||
Majority | ||||
Turnout | 2,701 | 37.27 |
Party | Candidate | Votes | % | |
---|---|---|---|---|
Conservative | Jay Walia | 1,053 | ||
English Democrat | Terry Spencer | 714 | ||
Labour | Les Rolfe | 610 | ||
Liberal Democrats | Kevin Barron | 400 | ||
Majority | ||||
Turnout | 2,777 | 33.45 |
Party | Candidate | Votes | % | |
---|---|---|---|---|
Labour | George Blackwell | 1,349 | ||
Liberal Democrats | Jane Brown | 1,346 | ||
Conservative | Brandon Eldred | 501 | ||
Majority | ||||
Turnout | 3,196 | 44.77 |
Party | Candidate | Votes | % | |
---|---|---|---|---|
Conservative | John Bailey | 1,984 | ||
Liberal Democrats | Daniel Jones | 465 | ||
Green | Miriam Grzesiukowicz | 349 | ||
Labour | Ayo Ajanaku | 308 | ||
Majority | ||||
Turnout | 3,106 | 43.4 |
Party | Candidate | Votes | % | |
---|---|---|---|---|
Conservative | Bhupendra Patel | 1,366 | ||
Labour | Peter Wright | 680 | ||
Liberal Democrats | Irene Markham | 364 | ||
BNP | Simon Robinson | 296 | ||
Majority | ||||
Turnout | 2,706 | 36.81 |
Party | Candidate | Votes | % | |
---|---|---|---|---|
Conservative | Sue Homer | 1,517 | ||
Labour | Tim McGuire | 1,353 | ||
Liberal Democrats | Charles Markham | 262 | ||
Majority | ||||
Turnout | 3,132 | 48.79 |
Party | Candidate | Votes | % | |
---|---|---|---|---|
Conservative | David Dean | 872 | ||
Labour | Andrew Scarborough | 553 | ||
Green | Emma Hornett | 347 | ||
Liberal Democrats | Veronica Meredith | 271 | ||
Majority | ||||
Turnout | 2,043 | 33.34 |
Party | Candidate | Votes | % | |
---|---|---|---|---|
Conservative | Malcolm Waters | 1,487 | ||
Labour | Adam Henley | 456 | ||
Liberal Democrats | Penny Wilkins | 394 | ||
Green | Shasha Khan | 146 | ||
Majority | ||||
Turnout | 2,483 | 41.87 |
Party | Candidate | Votes | % | |
---|---|---|---|---|
Conservative | Paul Bell | 958 | ||
Labour | Pat Cass | 543 | ||
Liberal Democrats | Julie White | 282 | ||
BNP | David Robinson | 274 | ||
Green | Jonathan Hornett | 270 | ||
Majority | ||||
Turnout | 2,327 | 36.11 |
Northamptonshire is a ceremonial county in the East Midlands of England. It is bordered by Leicestershire, Rutland and Lincolnshire to the north, Cambridgeshire to the east, Bedfordshire, Buckinghamshire and Oxfordshire to the south and Warwickshire to the west. Northampton is the largest settlement and the county town.
Corby is a town and civil parish in the North Northamptonshire district, in Northamptonshire, England, 23 miles (37 km) north-east of Northampton. In 2021 it had a population of 68,164. From 1974 to 2021, it was the administrative headquarters of the Borough of Corby, which at the 2021 Census had a population of 75,571.
Peterborough, or the City of Peterborough, is a unitary authority area with city status in the ceremonial county of Cambridgeshire, England. The district is named after its largest settlement, Peterborough, but also covers a wider area of outlying villages and hamlets.
Harborough is a local government district in Leicestershire, England. It is named after its main town, Market Harborough, which is where the council is based. The district also includes the town of Lutterworth and numerous villages and surrounding rural areas. In the north of the district it includes parts of the Leicester Urban Area, notably at Thurnby, Bushby and Scraptoft. Covering 230 square miles (600 km2), the district is the largest by area of the eight districts in Leicestershire and covers almost a quarter of the county.
South Northamptonshire was a local government district in Northamptonshire, England, from 1974 to 2021. Its council was based in the town of Towcester, first established as a settlement in Roman Britain. The population of the Local Authority District Council in 2011 was 85,189.
East Northamptonshire was a local government district in Northamptonshire, England, from 1974 to 2021. Its council was based in Thrapston and Rushden. Other towns included Oundle, Raunds, Irthlingborough and Higham Ferrers. The town of Rushden was by far the largest settlement in the district. The population of the district at the 2011 Census was 86,765.
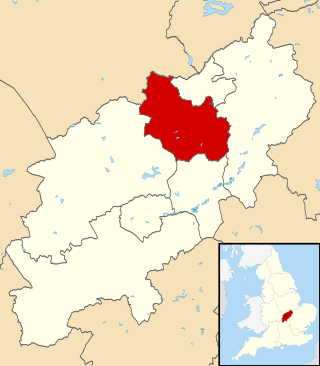
The Borough of Kettering was a local government district and borough in Northamptonshire, England, from 1974 to 2021. It was named after its main town, Kettering, where the council was based. It bordered onto the district of Harborough in the neighbouring county of Leicestershire, the borough of Corby, the district of East Northamptonshire, the district of Daventry and the borough of Wellingborough.
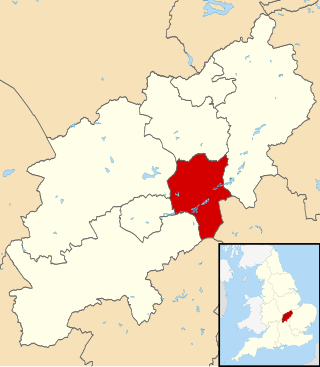
The Borough of Wellingborough was a non-metropolitan district and borough in Northamptonshire, England, from 1974 to 2021. It was named after Wellingborough, its main town, but also included surrounding rural areas.
One third of Daventry District Council in Northamptonshire, England was elected each year, followed by one year when there was an election to Northamptonshire County Council instead. Since the last boundary changes in 1999, 38 councillors were elected from 24 wards. In another boundary review in 2012 the councillors were reduced to 36 councillors across 16 wards. The council was abolished in 2021, with the area becoming part of West Northamptonshire.
Northamptonshire County Council was the county council that governed the non-metropolitan county of Northamptonshire in England. It was originally formed in 1889 by the Local Government Act 1888, recreated in 1974 by the Local Government Act 1972 and abolished in 2021. The headquarters of the council was County Hall in Northampton.
North Northamptonshire is one of two local government districts in Northamptonshire, England. Its council is a unitary authority, being a district council which also performs the functions of a county council. It was created in 2021. The council is based in Corby, the district's largest town. Other notable towns are Kettering, Wellingborough, Rushden, Raunds, Desborough, Rothwell, Irthlingborough, Thrapston and Oundle.
West Northamptonshire is a unitary authority area in the ceremonial county of Northamptonshire, England, and was created in 2021. It contains the county town of Northampton, as well as Daventry, Brackley and Towcester; the rest of the area is predominantly agricultural villages though it has many lakes and small woodlands.
Northamptonshire County Council was the county council for Northamptonshire in England. It was initially created in 1889 under the Local Government Act 1888, with its functions being substantially reformed in 1974 under the Local Government Act 1972. The council was abolished in 2021, with the area split into North Northamptonshire and West Northamptonshire. Elections to Northamptonshire County Council were held every four years.
The 2005 Northamptonshire County Council election took place on 5 May 2005 to elect members of Northamptonshire County Council, England. The whole council was up for election and the Conservative Party gained overall control of the council from the Labour Party.
South Northamptonshire District Council in Northamptonshire, England was elected every four years. After the last boundary changes in 2007, 42 councillors were elected from 27 wards. The council was abolished in 2021, with the area becoming part of West Northamptonshire.
Sir Michael Tyrone Ellis is a British politician and barrister who served as Attorney General for England and Wales between September and October 2022, having previously served in the position from March to September 2021 during the maternity leave of Suella Braverman. A member of the Conservative Party, he previously served as Paymaster General from 2021 to 2022 and as Minister for the Cabinet Office from February to September 2022. Ellis served as the Member of Parliament (MP) for Northampton North from 2010 to 2024.
The 2017 Northamptonshire County Council election took place on 4 May 2017 as part of the 2017 local elections in the United Kingdom. County councillors were elected from all 57 electoral divisions which returned one county councillor to Northamptonshire County Council by first-past-the-post voting for a four-year term of office. These elections were the last held for Northamptonshire County Council before its dissolution in 2021.
The 2018 Daventry District Council election were held on Thursday 3 May 2018 to elect members of Daventry District Council in England.This was on the same day as other local elections.
The 2001 Northamptonshire County Council election took place on 7 June 2001 to elect members of Northamptonshire County Council, England. The whole council was up for election and the Labour Party retained overall control of the council, which it had held since 1993.
The 2021 West Northamptonshire Council election took place during 2021, alongside nationwide local elections. The election was originally due to take place in May 2020, but was postponed due to the COVID-19 pandemic.