2009 Kent County Council election

Last updated

2009 Kent County Council election
Flag of England.svg
  2005 4 June 2009 2013  

All 84 seats to Kent County Council
43 seats needed for a majority
 First partySecond partyThird party
 
Party Conservative Liberal Democrats Labour
Seats won7472
Seat changeIncrease2.svg17Decrease2.svg1Decrease2.svg18

Kent UK local election 2009 map.svg
2009 local election results in Kent

Council control before election

Conservative

Council control after election

Conservative

The Kent County Council election, 2009 was an election to all 84 seats on Kent County Council held on 2 May as part of the 2009 United Kingdom local elections. 84 councillors were elected from 72 electoral divisions, which returned either one or two county councillors each by first-past-the-post voting for a four-year term of office. The electoral divisions were the same as those used at the previous election in 2005. No elections were held in Medway, which is a unitary authority outside the area covered by the County Council. [1]

Contents

All locally registered electors (British, Irish, Commonwealth and European Union citizens) who were aged 18 or over on Thursday 4 June 2009 were entitled to vote in the local elections. Those who were temporarily away from their ordinary address (for example, away working, on holiday, in student accommodation or in hospital) were also entitled to vote in the local elections, [2] although those who had moved abroad and registered as overseas electors cannot vote in the local elections. It is possible to register to vote at more than one address (such as a university student who had a term-time address and lives at home during holidays) at the discretion of the local Electoral Register Office, but it remains an offence to vote more than once in the same local government election. [3]

The Conservative Party was re-elected with an increased majority and the Liberal Democrats replaced Labour as the main opposition party.

Summary of election results

Kent County Council Election Results 2009 [4]
PartySeatsGainsLossesNet gain/lossSeats %Votes %Votes+/−
  Conservative 74+ 19-2+1788.1%47%
  Liberal Democrats 7+2-1+18.3%21%
  Labour 2018-182.4%15%
  Residents 110+11.2%< 1%

Council Composition

Prior to the election the composition of the council was:

57216
ConservativeLabourLD

After the election the composition of the council was:

74721
ConservativeLDLabR

LD – Liberal Democrats
Lab – Labour Party
R – Residents Association

Results by district

Kent is divided into 12 regions: Ashford, Canterbury, Dartford, Dover, Gravesham, Maidstone, Sevenoaks, Folkestone and Hythe, Swale, Thanet, Tonbridge and Malling, and Tunbridge Wells.

Summary

Summary of results
Region Conservative Party Liberal Democrats Labour Party Residents Association Total
Ashford 61007
Canterbury 81009
Dartford 50016
Dover 70007
Gravesham 40105
Maidstone 63009
Sevenoaks 70007
Folkestone and Hythe 51006
Swale 70007
Thanet 70108
Tonbridge and Malling 61007
Tunbridge Wells 60006
Total747 2184
Net Change+17-18+1+1

Asterisks denote incumbent councillors seeking re-election. [5]

Ashford

There are seven single-member constituencies within the borough of Ashford. Below are the results:

Ashford Central [6]
PartyCandidateVotes%±%
Conservative Elizabeth Tweed*2,04354+11
Liberal Democrats John B Hawes69818+1
Green Steven R Campkin58915+11
Labour Sophie E Griffiths48813-21
Majority1,34536
Turnout 3,81833-30
Conservative hold Swing
Ashford East [7]
PartyCandidateVotes%±%
Liberal Democrats George Koowaree*2,34356+19
Conservative Ian R Cooling1,41934+3
Labour Brendan T Naughton40010-15
Majority92422
Turnout 4,16235-27
Liberal Democrats hold Swing
Ashford Rural East [8]
PartyCandidateVotes%±%
Conservative Andrew Wickham2,87158+6
Green Lola M Sansom88618+6
Liberal Democrats Nathan G Parrett82217-11
Labour Brendan Chilton3637N/A
Majority1,98540
Turnout 4,94242-27
Conservative hold Swing
Ashford Rural South [9]
PartyCandidateVotes%±%
Conservative Michael Angell*2,50957+10
Liberal Democrats Ian Stone87320-6
Green Tracy A Dighton-Brown62614N/A
Labour Vivien Wheatley4069N/A
Majority1,63637
Turnout 4,41437-27
Conservative hold Swing
Ashford Rural West [10]
PartyCandidateVotes%±%
Conservative Richard King*3,84365+10
Green Hilary Jones83314+8
Liberal Democrats Stuart J Dove82414-8
Labour Christopher R Clark4067-9
Majority3,01051
Turnout 5,90641-27
Conservative hold Swing
Ashford South [11]
PartyCandidateVotes%±%
Conservative Jim Wedgebury1,23634+7
Labour Derek Smyth*94626+16
Liberal Democrats Jeremy P Adby76721+2
BNP Karl J Rouse39611N/A
Green Sharon P Harvey2617+2
Majority2908
Turnout 3,60631-24
Conservative gain from Labour Swing
Tenterden [12]
PartyCandidateVotes%±%
Conservative Mike Hill*3,46170+6
Liberal Democrats Barry F Wright1,09322-14
Labour Doreen J Wilcockson3938N/A
Majority2,39848
Turnout 4,94742-26
Conservative hold Swing

Canterbury

There are five single-member and two multi-member constituencies within the City of Canterbury, which elect a total of nine councilors to Kent County Council. Below are the results:

Canterbury City North East [13]
PartyCandidateVotes%±%
Conservative Graham Gibbens*1,62545+7
Liberal Democrats Jo Calvert-Mindell1,19133+8
Green Geoffery J Meaden43612+4
Labour Alan Baldock35110-18
Majority43412
Turnout 3,60337-22
Conservative hold Swing
Canterbury City South West [14]
PartyCandidateVotes%±%
Liberal Democrats Martin Vye*2,26349+9
Conservative Maureen M C Robinson1,25527-1
Green Elaine Godden67315+8
Labour Jean Elizabeth Butcher3919-16
Majority100822
Turnout 4,58238-24
Liberal Democrats hold Swing
Canterbury South East [15]
PartyCandidateVotes%±%
Conservative Michael Northey*2,45846+2
Liberal Democrats Nigel P Whitburn1,80434+3
Green Judith A Meaden68713+5
Labour David T McLellan3567-10
Majority65412
Turnout 5,30544-25
Conservative hold Swing
Canterbury West [16]
PartyCandidateVotes%±%
Conservative John Simmonds*2,11950+7
Liberal Democrats Derek S Maslin98823-6
Green Norman S Evans74318+11
Labour Ian Leslie3879-11
Majority1,13127
Turnout 4,23736-24
Conservative hold Swing
Herne and Sturry [17]
PartyCandidateVotes%±%
Conservative Alan Marsh*2,08347+4
UKIP John D Moore1,09524+18
Liberal Democrats Monica Eden-Green82618-8
Labour Cecile M Manning47211-15
Majority98823
Turnout 4,47635-30
Conservative hold Swing
Herne Bay (2 Seats) [18]
PartyCandidateVotes%±%
Conservative Jean Law2,90219-1
Conservative David Hirst*2,80519-1
Liberal Democrats Margaret Flaherty2,19015-3
Liberal Democrats June Raybaud1,86212-3
UKIP Ronald W Garretty1,61411+7
UKIP Brian E MacDowall1,4199N/A
Labour Michael K Britton6704-8
Green Aaron L Kiely5924N/A
BNP William A Hitches4723N/A
Labour Norman G Price4703-8
Majority615-4
Turnout 14,99636tbc
Conservative hold Swing
Whitstable (2 Seats) [19]
PartyCandidateVotes%±%
Conservative Mark Dance*4,90526+2
Conservative Michael Harrison*4,82625+2
Liberal Democrats Donna Dwight2,11811+1
Green Jolyon L Trimingham2,07211+7
Liberal Democrats David J Mummery1,87610+1
Labour Phil Cartwright1,3657-6
Labour Ben Furber1,2477-5
Money Reform Anne Belsey5233N/A
Majority2,70814
Turnout 18,93240tbc
Conservative hold Swing

Dartford

There are six single-member constituencies within the borough of Dartford. Below are the results

Dartford East
PartyCandidateVotes%±%
Conservative Penny Cole1,22138+4
Labour Christine Angell*83026-26
English Democrat Tony Wilson78724+16
Liberal Democrats Simon Simeonides39512
Majority39112
Turnout 3,23334-26
Conservative gain from Labour Swing
Dartford North East [20]
PartyCandidateVotes%±%
Conservative Avtar Sandhu1,14030+5
Labour John I Muckle*1,08029-23
English Democrat Mike Tibby80921N/A
Liberal Democrats Adam D Jarvis39210-4
BNP Barry Taylor34610N/A
Majority601
Turnout 3,76734-22
Conservative gain from Labour Swing
Dartford Rural [21]
PartyCandidateVotes%±%
Conservative Jeremy Kite2,78056+1
English Democrat Gary Rogers1,02020+15
Labour Garry G Sturley60412-24
Liberal Democrats George Sakellariou4519N/A
Peace Geoffrey P Pay1393-1
Majority1,76036
Turnout 4,99440-26
Conservative hold Swing
Dartford West [22]
PartyCandidateVotes%±%
Conservative Jan Ozog1,87349-16
English Democrat Jo Shippam1,26333N/A
Liberal Democrats Joanne S Howard69818-5
Majority61016
Turnout 3,83439-27
Conservative hold Swing
Swanscombe and Greenhithe [23]
PartyCandidateVotes%±%
Residents Richard Lees1,20437N/A
Conservative Sheila East85826-1
Labour Val Ashenden40512-26
BNP Clive Cook34411N/A
English Democrat Jim Read2758N/A
Liberal Democrats James Willis1866N/A
Majority346
Turnout 3,27230-26
Residents gain from Labour Swing
Wilmington [24]
PartyCandidateVotes%±%
Conservative Ann Allen2,81756+5
English Democrat John Griffiths1,25825+21
Labour Patrick Kelly98019-20
Majority1,55931
Turnout 5,05539-27
Conservative hold Swing

Dover

There are three single-member and two multi-member constituencies within the District of Dover, which elect a total of seven councillors to Kent County Council. Below are the results:

Deal (2 Seats) [25]
PartyCandidateVotes%±%
Conservative Julie Rook3,91422+4
Conservative Kit Smith3,66021+5
Liberal Democrats Anthony J Hook2,59215+5
Liberal Democrats John C Trickey2,52114+5
Labour Terence J Birkett*2,42014-8
Labour Michael R Eddy*2,34213-8
Majority1,0686
Turnout 17,44941
Conservative gain from Labour Swing
Dover North [26]
PartyCandidateVotes%±%
Conservative Stephen Manion2,38043+3
Labour Eileen Rowbotham*1,30024-18
Independent Reginald V Hansell1,05319N/A
Liberal Democrats Sheila J Smith76414-5
Majority1,08019
Turnout 5,49744-27
Conservative gain from Labour Swing
Dover Town (2 Seats) [27]
PartyCandidateVotes%±%
Conservative Nigel Collor2,82523+8
Conservative Roger Frayne2,59021+8
Labour William V Newman*1,89415-11
Labour Gordon Cowan1,78114-11
Liberal Democrats John B Mackie1,73214+4
Liberal Democrats Dean M Stiles1,69114+3
Majority6966
Turnout 12,51332
Conservative gain from Labour Swing
Dover West [28]
PartyCandidateVotes%±%
Conservative Bryan Cope*2,46345+1
UKIP John Buckley1,35225+22
Liberal Democrats Peter A Lodge1,008180
Labour Pamela M Brivio64512-18
Majority1,11120
Turnout 5,46842-31
Conservative hold Swing
Sandwich [29]
PartyCandidateVotes%±%
Conservative Leyland Ridings*3,03857+13
Liberal Democrats Bryan A C Curtis1,54229+6
Labour Iain M Fairweather72814-15
Majority1,49628
Turnout 5,30840-31
Conservative hold Swing

Gravesham

There is a single-member and two multi-member constituencies within the Borough of Gravesham, which elect a total of five councillors to Kent County Council. Below are the results:

Gravesham East (2 Seats) [30]
PartyCandidateVotes%±%
Conservative John Cubitt3,71322+2
Conservative Bryan Sweetland3,34320+2
Labour Jane Cribbon*2,32114-9
Labour John P Burden2,29613-9
English Democrat Elizabeth A Painter1,4258N/A
Green Richard Crawford1,2367+3
Liberal Democrats Martin Wilson1,01060
Independent Larry Cotton8995N/A
Liberal Democrats Bruce E Parmenter8735-1
Majority1,0256
Turnout 17,11634
Conservative gain from Labour Swing
Gravesham Rural [31]
PartyCandidateVotes%±%
Conservative Michael Snelling*4,109600
English Democrat Steven A Foreman74011N/A
Green Ros Wakeman72211+6
Labour Douglas C Christie65210-13
Liberal Democrats Ann O'Brien6249-2
Majority3,36949
Turnout 6,84743-31
Conservative hold Swing
Northfleet and Gravesend West (2 Seats) [32]
PartyCandidateVotes%±%
Labour Leslie Christie*3,31719-5
Conservative Harold Craske3,17419-1
Labour Ray Parker*3,14418-6
Conservative David H Turner2,79016-2
Liberal Democrats Ian Stevenson1,20870
English Democrat Lisa Foreman1,1787N/A
Green Nigel J Rumsey1,1717N/A
Liberal Democrats Gill McGill1,11870
Majority301
Turnout 17,10035
Conservative gain from Labour Swing
Labour hold Swing

Maidstone

There are seven single-member and one multi-member constituencies within the Borough of Maidstone, which elect a total of nine councillors to Kent County Council. Below are the results:

Maidstone Central (2 seats) [33]
PartyCandidateVotes%±%
Liberal Democrats Dan Daley*4,46526+4
Liberal Democrats Malcolm Robertson3,74922+7
Conservative Jeff Curwood*2,50714-2
Conservative Paul F Butcher2,47914-1
UKIP John C Stanford1,2747+4
Green Stuart R Jeffery9806+1
Green Wendy K Lewis7614N/A
Labour Bruce H Heald6033-10
Labour Marianna Romeojuliet Poliszczuk5683-8
Majority1,2428
Turnout 17,38632
Liberal Democrats gain from Conservative Swing
Liberal Democrats hold Swing
Maidstone North East [34]
PartyCandidateVotes%±%
Liberal Democrats Ian Chittenden2,30653+9
Conservative Jeff Tree1,15926-4
UKIP Charles R Elliott65615+11
Green Derek R Eagle2606+2
Majority1,14727
Turnout 4,38136-28
Liberal Democrats hold Swing
Maidstone Rural East [35]
PartyCandidateVotes%±%
Conservative Jenny Whittle3,96374+11
Liberal Democrats David S Naghi92517+3
Labour Steve Gibson4799-8
Majority3,03857
Turnout 5,36742-27
Conservative hold Swing
Maidstone Rural North [36]
PartyCandidateVotes%±%
Conservative Paul Carter*3,07858+9
UKIP Gareth A Kendall81815N/A
Liberal Democrats Kenneth W Stevens66813-11
Labour Jeanne M Gibson3977-14
Green Ian F S McDonald3527+3
Majority2,26043
Turnout 5,31338-33
Conservative hold Swing
Maidstone Rural South [37]
PartyCandidateVotes%±%
Conservative Eric Hotson*2,59562+8
Liberal Democrats Hugh A Laing1,02725-3
Green Robin J Kinrade55413N/A
Majority1,56837
Turnout 4,17640-28
Conservative hold Swing
Maidstone Rural West [38]
PartyCandidateVotes%±%
Conservative Paulina Stockell*2,55946-1
Liberal Democrats Brian R E Mortimer1,46726-4
UKIP Keith C Woollven82515N/A
Green Sandra McDowell3977+1
Labour Edith M Davis3005-13
Majority1,09220
Turnout 5,54842-27
Conservative hold Swing
Maidstone South [39]
PartyCandidateVotes%±%
Conservative Alan Chell*1,89744+7
Liberal Democrats Clive A English1,22229-1
Labour Co-op Richard J Coates3418-18
Green Stephen F Muggeridge3057+4
Independent Sheena Williams2827N/A
National Front Gary Butler2315.4N/A
Majority67515
Turnout 4,27835-27
Conservative hold Swing
Maidstone South East [40]
PartyCandidateVotes%±%
Conservative Gary Cooke1,29743+7
UKIP John M Botting57719+14
Labour Gillian Annan45215-21
Liberal Democrats Rob Field42214-6
Green Andrew C Waldie1595+2
Independent John Hicks903N/A
Majority72024
Turnout 2,99728-28
Conservative gain from Labour Swing

Sevenoaks

There are seven single-member constituencies within the District of Sevenoaks which elect to Kent County Council. Below are the results:

Darent Valley [41]
PartyCandidateVotes%±%
Conservative Roger Gough2,34550+6
Liberal Democrats Philip R McGarvey94620-8
English Democrat Christopher K Snape91819N/A
Labour Carol A Theobald51711-12
Majority1,39930
Turnout 4,72639-28
Conservative hold Swing
Sevenoaks Central [42]
PartyCandidateVotes%±%
Conservative John London3,27359+6
Liberal Democrats John G Brigden1,16421-10
Green Stephen J Plater54510N/A
Labour Margaret R Warne3116-6
English Democrat Richard K C Snape2545N/A
Majority2,10938
Turnout 5,54743-26
Conservative hold Swing
Sevenoaks East [43]
PartyCandidateVotes%±%
Conservative Nick Chard*2,57552-1
Liberal Democrats Jean M Canet1,17024-8
English Democrat Carol White55311N/A
Green Joanne Dyton4429N/A
Labour Sarah E Goodall2194-11
Majority1,40528
Turnout 4,95941-29
Conservative hold Swing
Sevenoaks North East [44]
PartyCandidateVotes%±%
Conservative David Brazier2,88556+5
English Democrat Louise A Uncles1,09121N/A
Liberal Democrats Phillip N Hobson69713-1
Labour James D Weekes51810-9
Majority1,79435
Turnout 5,19137
Conservative hold Swing
Sevenoaks South [45]
PartyCandidateVotes%±%
Conservative Peter Lake*2,439520
Liberal Democrats Howard V Jennings1,07823-12
Green Francis R R Dyton632130
English Democrat David K R Snape56612N/A
Majority1,36129
Turnout 4,71541-24
Conservative hold Swing
Sevenoaks West [46]
PartyCandidateVotes%±%
Conservative Richard Parry*2,72755+2
Independent Penelope M Kift75815+3
Liberal Democrats Richard C Wassell75615-5
English Democrat James H K Snape4249N/A
Labour Kevin R Flack2525-11
Majority1,96940
Turnout 4,91741-28
Conservative hold Swing
Swanley [47]
PartyCandidateVotes%±%
Conservative Robert Brookbank1,54943+13
English Democrat Steven T Uncles83323N/A
Labour Ian W Rashbrook82323-11
Liberal Democrats Alan J Bullion42812-2
Majority71620
Turnout 3,63333-25
Conservative gain from Labour Swing

Shepway

There are six single-member constituencies within the District of Shepway, that elect councillors to Kent County Council. The results are:

Elham Valley [48]
PartyCandidateVotes%±%
Conservative Susan Carey*3,51956-1
UKIP Nicholas S W Jack1,25420+17
Liberal Democrats Alex McNeice86714-9
Labour Pamela J Stevens3506-6
Shepway IndependentsColin D Tearle2955N/A
Majority2,26536
Turnout 6,28544-31
Conservative hold Swing
Folkestone North East [49]
PartyCandidateVotes%±%
Conservative Richard Pascoe*98227-11
People First Party Brian W Copping90425+6
Liberal Democrats Thomas S McNeice81422-7
UKIP Francis J McKenna63517N/A
Labour Paul R Bingham2487-7
Shepway IndependentsMartin K Ross782N/A
Majority782
Turnout 3,66134-30
Conservative hold Swing
Folkestone South [50]
PartyCandidateVotes%±%
Conservative Roland Tolputt*1,49643-6
Liberal Democrats Gary M Fuller82124-3
UKIP Terence D Kendall79423N/A
Labour Maureen Tomison33010-5
Majority67519
Turnout 3,4413427
Conservative hold Swing
Folkestone West [51]
PartyCandidateVotes%±%
Liberal Democrats Tim Prater1,45635+8
Conservative Robert Howard Clegg Bliss*1,44535-10
UKIP Carol L Sacre77619N/A
People First Party Trevor J Buss2586N/A
Labour David Sandford1854-9
Majority110
Turnout 4,12038-30
Liberal Democrats gain from Conservative Swing
Hythe 4 June 2009 Shepway District
PartyCandidateVotes%±%
Conservative Chris Capon*2,77154-6
Liberal Democrats Darren E Briddock1,16123-4
UKIP Barbara M Johnson70714N/A
Labour John P Haste2635-5
BNP Harry H J Williams2084N/A
Majority1,61031
Turnout 5,11046-27
Conservative hold Swing
Romney Marsh [52]
PartyCandidateVotes%±%
Conservative Willie Richardson3,10746-7
UKIP John V Meek1,57324N/A
Liberal Democrats Valerie I Loseby87213-12
Labour Douglas M Suckling4467-11
Independent Wendy V Nevard4427N/A
Independent Graham F A Snell2434N/A
Majority1,53422
Turnout 6,68339-29
Conservative hold Swing

Swale

There are five single-member constituencies and one multi-member constituencies within the Borough of Swale, which elect a total of eight councillors to Kent County Council. Below are the results:

Faversham [53]
PartyCandidateVotes%±%
Conservative Tom Gates*2,412470
Liberal Democrats Stephen Rowlstone79816-1
Labour Trevor R Payne68213-17
UKIP Shirley K Allen68013N/A
Green Gary Miller55311+4
Majority1,61431
Turnout 5,12537-29
Conservative hold Swing
Sheerness [54]
PartyCandidateVotes%±%
Conservative Ken Pugh1,27534-1
Labour Angela Harrison*1,11429-22
BNP Graeme W Sergeant53914N/A
Independent David P Cassidy53314N/A
Liberal Democrats Colin L Howe3309-5
Majority1615
Turnout 3,79129-29
Conservative gain from Labour Swing
Sheppey [55]
PartyCandidateVotes%±%
Conservative Adrian Crowther*1,75541-3
Independent Patricia M Sandle71117N/A
Labour David T Sargent62215-24
BNP Colin McCarthy Stewart56813N/A
Liberal Democrats David J Spurling3588-9
Monster Raving Loony Mad Mike Young2526N/A
Majority1,04424
Turnout 4,26630
Conservative hold Swing
Swale Central (2 Seats) [56]
PartyCandidateVotes%±%
Conservative Mike Whiting3,98224+2
Conservative Alan Willicombe3,84923+6
Labour Roger Truelove*2,66516-5
Labour Ghlin M Whelan2,16813-2
Liberal Democrats Dave Manning1,90411-2
Liberal Democrats Keith S Nevols1,594100
Monster Raving Loony Sheikh Mihand5663+2
Majority1,1847
Turnout 16,72833
Conservative gain from Labour Swing
Conservative hold Swing
Swale East [57]
PartyCandidateVotes%±%
Conservative Andrew Bowles*2,402500
UKIP Sarah Larkins73815N/A
Liberal Democrats David J Evans60012-9
Labour Ken Rowles54911-18
Green Timothy R Valentine52611N/A
Majority1,66435
Turnout 4,81534-32
Conservative hold Swing
Swale West [58]
PartyCandidateVotes%±%
Conservative Keith Ferrin*2,60956+3
Liberal Democrats Elvie Lowe1,34829+10
Labour Mike Baldock70015-13
Majority1,26127
Turnout 4,65735-34
Conservative hold Swing

Thanet

There are two single-member and three multi-member constituencies within the District of Thanet, which elect a total of eight councillors to Kent County Council. Below are the results:

Birchington and Villages [59]
PartyCandidateVotes%±%
Conservative Charles Hibberd*2,661520
Liberal Democrats Bill Furness99619+5
English Democrat Derek Bradley-Young94118N/A
Labour Denise P Cartwright52310-17
Majority1,66533
Turnout 5,12140-28
Conservative hold Swing
Broadstairs and Sir Moses Montefiore (2 Seats) [60]
PartyCandidateVotes%±%
Conservative Robert Bayford4,26428+7
Conservative Bill Hayton*4,02726+6
Liberal Democrats Louisa J R Latham2,04113+2
Labour Michelle H Fenner1,76511-4
Liberal Democrats Michael P T Hart1,711110
Labour Jennifer M Matterface1,54210-5
Majority1,98613
Turnout 15,35036
Conservative hold Swing
Margate and Cliftonville (2 Seats) [61]
PartyCandidateVotes%±%
Conservative Chris Wells*2,49321+2
Conservative Michael Jarvis2,40420+1
Labour Clive Hart*2,18618-3
Labour Iris Johnston2,14418-1
UKIP Jeffrey Elenor1,72715+12
Liberal Democrats Kenwyn W Hando6285-2
Liberal Democrats Nigel D A Oakes3273-3
Majority2182
Turnout 11,90931
Conservative gain from Labour Swing
Conservative hold Swing
Margate West [62]
PartyCandidateVotes%±%
Conservative Robert Burgess*1,64545+4
UKIP Roz Parker79222+16
Labour Kerry L Harker51314-21
Liberal Democrats Margaret Burns47113-2
English Democrat Rayce Knowles2477N/A
Majority85323
Turnout 3,66831-28
Conservative hold Swing
Ramsgate (2 Seats) [63]
PartyCandidateVotes%±%
Conservative John Kirby2,98519+5
Labour Elizabeth Green*2,56616-7
Conservative Michael J Taylor2,33915+2
UKIP Trevor L Shonk2,19214+9
Labour Alan R Poole*2,08113-7
Ramsgate FirstGerry O'Donnell1,1417N/A
Liberal Democrats Georgina R Maddox9006-1
BNP Dennis Whiting8926N/A
Liberal Democrats Richard G H Perry8155-1
Majority2271
Turnout 15,91135
Conservative gain from Labour Swing
Conservative hold Swing

Tonbridge and Malling

There are five single-member constituencies and one multi-member constituency within the District of Tonbridge and Malling, which elect a total of seven councillors to Kent County Council. Below are the results:

Malling Central [64]
PartyCandidateVotes%±%
Liberal Democrats Trudy Dean*2,48656-5
Conservative Alice Hohler1,12225-7
UKIP Peter G Stevens44410+3
Labour David Laverty1574N/A
Green Helen J Long1143N/A
English Democrat Teresa Cannon952N/A
Majority1,38431
Turnout 4,41838-23
Liberal Democrats hold Swing
Malling North [65]
PartyCandidateVotes%±%
Conservative Sarah Hohler*2,25349-7
Labour Paul M Hickmott1,00822-22
Liberal Democrats Liz Simpson50511N/A
English Democrat Lisa Rogers4329N/A
Green Howard Porter3618N/A
Majority1,24527
Turnout 4,55937-26
Conservative hold Swing
Malling Rural East [66]
PartyCandidateVotes%±%
Conservative Richard Long, TD*2,67158+2
UKIP David Waller60913N/A
Liberal Democrats Gillian Jones55012-6
Green Frances M Long3508+2
Labour Kathleen M Garlick2586-14
English Democrat Alan Woodley1944N/A
Majority2,06245
Turnout 4,63238-30
Conservative hold Swing
Malling Rural North East [67]
PartyCandidateVotes%±%
Conservative Peter Homewood3,25457+9
Liberal Democrats David Lettington1,25422-30
English Democrat Terry Bilsland4348N/A
Labour Thomas R Shelley3967N/A
Green Andrea C Ralph3576N/A
Majority2,00035
Turnout 5,69541-26
Conservative gain from Liberal Democrats Swing
Malling West [68]
PartyCandidateVotes%±%
Conservative Valerie Dagger*3,12662+15
Liberal Democrats James H Menzies68214-3
Green Richard P Mountford4759N/A
English Democrat Laurence Williams4429N/A
Labour Victoria Hayman3236-5
Majority2,44448
Turnout 5,04843-28
Conservative hold Swing
Tonbridge (2 Seats) [69]
PartyCandidateVotes%±%
Conservative Godfrey A Horne*4,76826+1
Conservative Christopher Smith4,222230
Liberal Democrats Euan A Munro1,5839-1
Liberal Democrats Garry C Bridge1,4968-3
UKIP Russell J Long1,2787N/A
UKIP Peter F Smith1,0886N/A
Green Hazel F Dawe1,0326+3
Labour James Parish9445-8
Green Steve M Dawe8465+2
Labour Terence Scott7604-8
English Democrat Stephen R Culliford4753N/A
Majority2,63914
Turnout 18,49239
Conservative hold Swing

Tunbridge Wells

There are six single-member constituencies within the Borough of Swale six councillors to Kent County Council. Below are the results:

Cranbrook [70]
PartyCandidateVotes%±%
Conservative Roger Manning*3,02066+11
Liberal Democrats Keith J Brown1,24927+4
Labour David Burgess2816-6
Majority1,77139
Turnout 4,55041-27
Conservative hold Swing
Tunbridge Wells East [71]
PartyCandidateVotes%±%
Conservative Kevin G Lynes*2,37249+9
Liberal Democrats David J Neve1,53232-5
UKIP Eileen A Gaylor58512N/A
Labour Timothy J Rich3247-11
Majority84017
Turnout 4,81338-25
Conservative hold Swing
Tunbridge Wells North [72]
PartyCandidateVotes%±%
Conservative Roy Bullock*1,81738-3
Liberal Democrats Trevor W Poile1,66435+7
UKIP Victor C Webb68314N/A
Labour Oon S Ooi61413-11
Majority1533
Turnout 4,77837-27
Conservative hold Swing
Tunbridge Wells Rural [73]
PartyCandidateVotes%±%
Conservative Alex King*3,41164+11
Liberal Democrats John G Billingham1,39526+3
Labour Raymond P Moon56210-8
Majority2,01638
Turnout 5,36837-30
Conservative hold Swing
Tunbridge Wells South [74]
PartyCandidateVotes%±%
Conservative James Scholes*3,20362+10
Liberal Democrats Christopher J L Skelton1,54430+2
Labour Jemima L Blackmore4388-5
Majority1,65932
Turnout 5,18539-27
Conservative hold Swing
Tunbridge Wells West [75]
PartyCandidateVotes%±%
Conservative John Davies*2,71652-2
Liberal Democrats Robert J Prance87517-18
UKIP Patricia T Theophanides64612N/A
Green Brian Leslie632120
Labour Timothy J Probert3256N/A
Majority1,84135
Turnout 5,19434-31
Conservative hold Swing

Related Research Articles

<span class="mw-page-title-main">Kent</span> County of England

Kent is a county in the South East England region, the closest county to continental Europe. It borders Essex across the entire estuary of the River Thames to the north; the French department of Pas-de-Calais across the Strait of Dover to the south-east; East Sussex to the south-west; Surrey to the west and Greater London to the north-west. The county town is Maidstone.

<span class="mw-page-title-main">Tonbridge and Malling</span> Borough and non-metropolitan district in England

Tonbridge and Malling is a local government district with borough status in Kent, England. The council is based at Kings Hill. The borough also includes the towns of Tonbridge and Snodland along with numerous villages including Aylesford, West Malling and surrounding rural areas.

<span class="mw-page-title-main">Borough of Tunbridge Wells</span> Borough and non-metropolitan district in England

The Borough of Tunbridge Wells is a local government district with borough status in Kent, England. It takes its name from its main town, Royal Tunbridge Wells. The borough also contains the towns of Paddock Wood and Southborough, along with numerous villages and surrounding rural areas. Large parts of the borough fall within the High Weald Area of Outstanding Natural Beauty.

<span class="mw-page-title-main">Sevenoaks District</span> Non-metropolitan district in England

Sevenoaks is a local government district in west Kent, England. Its council is based in the town of Sevenoaks.

<span class="mw-page-title-main">Kent County Council</span> British administrative authority

Kent County Council is a county council that governs the non-metropolitan county of Kent in England. The non-metropolitan county is smaller than the ceremonial county, which additionally includes the unitary authority of Medway. Kent County Council is the upper tier of elected local government, below which are 12 district councils, and around 300 town and parish councils. The county council has 81 elected councillors. It is one of the largest local authorities in England in terms of population served and the largest local authority of its type.

Mid Kent was a parliamentary constituency in the county of Kent, which returned two Members of Parliament to the House of Commons of the Parliament of the United Kingdom.

<span class="mw-page-title-main">West Kent (UK Parliament constituency)</span>

West Kent was a county constituency in Kent in South East England. It returned two Members of Parliament (MPs) to the House of Commons of the Parliament of the United Kingdom, elected by the first past the post system.

<span class="mw-page-title-main">East Kent (UK Parliament constituency)</span>

East Kent was a county constituency in Kent in South East England. It returned two Members of Parliament (MPs) to the House of Commons of the Parliament of the United Kingdom, elected by the first past the post system.

Transportation needs within the county of Kent in South East England has been served by both historical and current transport systems.

<span class="mw-page-title-main">Kent West (European Parliament constituency)</span> Constituency of the European Parliament from 1979 to 1999

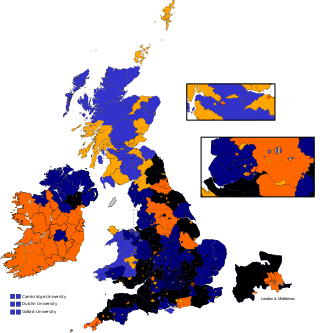
Prior to its uniform adoption of proportional representation in 1999, the United Kingdom used first-past-the-post for the European elections in England, Scotland and Wales. The European Parliament constituencies used under that system were smaller than the later regional constituencies and only had one Member of the European Parliament each. The constituency of Kent West was one of them.

<span class="mw-page-title-main">Grade I listed buildings in Kent</span>

The county of Kent is divided into 13 districts. The districts of Kent are Ashford, Canterbury, Dartford, Dover, Gravesham, Maidstone, Medway, Tonbridge and Malling, Tunbridge Wells, Sevenoaks, Shepway, Swale and Thanet.

<span class="mw-page-title-main">2013 Kent County Council election</span> 2013 UK local government election

The Kent County Council election, 2013 was an election to all 84 seats on Kent County Council held on Thursday 2 May as part of the 2013 United Kingdom local elections. 84 councillors were elected from 72 electoral divisions, which returned either one or two county councillors each by first-past-the-post voting for a four-year term of office. The electoral divisions were the same as those used at the previous election in 2009. No elections were held in Medway, which is a unitary authority outside the area covered by the County Council. The election saw the Conservative Party narrowly retain overall control of the council.

<span class="mw-page-title-main">Grade II* listed buildings in Kent</span>

The county of Kent is divided into 13 districts. The districts of Kent are Ashford, Canterbury, Dartford, Dover, Folkestone and Hythe, Gravesham, Maidstone, Medway, Tonbridge and Malling, Tunbridge Wells, Sevenoaks, Swale and Thanet.

There are over 20,000 Grade II* listed buildings in England. This page is a list of these buildings in the district of Dartford in Kent.

There are over 9,000 Grade I listed buildings in England. This page is a list of these buildings in the district of Dover in Kent.

<span class="mw-page-title-main">2017 Kent County Council election</span> 2017 UK local government election

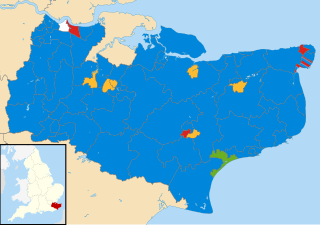
The 2017 Kent County Council election was held on 4 May 2017 as part of the 2017 local elections in the United Kingdom. All 81 councillors were elected from 72 electoral divisions, each of which returned either one or two county councillors by first-past-the-post voting for a four-year term of office. The Conservative Party retained control. UKIP, previously the second-largest party on the council, lost all their seats.

References

  1. "Kent County Council: Local Elections". Kent County Council. Archived from the original on 11 June 2009. Retrieved 1 March 2009.
  2. "The Representation of the People (Form of Canvass) (England and Wales) Regulations 2006, Schedule Part 1". Legislation.gov.uk. 13 October 2011. Retrieved 18 April 2012.
  3. "I have two homes. Can I register at both addresses?". The Electoral Commission. Archived from the original on 7 May 2019. Retrieved 5 January 2011.
  4. "Kent council". BBC News. 19 April 2009. Retrieved 5 June 2009.
  5. "Kent County Council: Councillors". Kent County Council. Archived from the original on 7 February 2009. Retrieved 4 March 2009.
  6. "Election results for Ashford Central, 4 June 2009". 4 June 2009.
  7. "Election results for Ashford East, 4 June 2009". 4 June 2009.
  8. "Election results for Ashford Rural East, 4 June 2009". 4 June 2009.
  9. "Election results for Ashford Rural South, 4 June 2009". 4 June 2009.
  10. "Election results for Ashford Rural West, 4 June 2009". 4 June 2009.
  11. "Election results for Ashford South, 4 June 2009". 4 June 2009.
  12. "Election results for Tenterden, 4 June 2009". 4 June 2009.
  13. "Election results for Canterbury City North East, 4 June 2009". 4 June 2009.
  14. "Election results for Canterbury City South West, 4 June 2009". 4 June 2009.
  15. "Election results for Canterbury South East, 4 June 2009". 4 June 2009.
  16. "Election results for Canterbury West, 4 June 2009". 4 June 2009.
  17. "Election results for Herne and Sturry, 4 June 2009". 4 June 2009.
  18. "Election results for Herne Bay, 4 June 2009". 4 June 2009.
  19. "Election results for Whitstable, 4 June 2009". 4 June 2009.
  20. "Election results for Dartford North East, 4 June 2009". 4 June 2009.
  21. "Election results for Dartford Rural, 4 June 2009". 4 June 2009.
  22. "Election results for Dartford West, 4 June 2009". 4 June 2009.
  23. "Election results for Swanscombe and Greenhithe, 4 June 2009". 4 June 2009.
  24. "Election results for Wilmington, 4 June 2009". 4 June 2009.
  25. "Election results for Deal, 4 June 2009". 4 June 2009.
  26. "Election results for Dover North, 4 June 2009". 4 June 2009.
  27. "Election results for Dover Town, 4 June 2009". 4 June 2009.
  28. "Election results for Dover West, 4 June 2009". 4 June 2009.
  29. "Election results for Sandwich, 4 June 2009". 4 June 2009.
  30. "Election results for Gravesend East, 4 June 2009". 4 June 2009.
  31. "Election results for Gravesham Rural, 4 June 2009". 4 June 2009.
  32. "Election results for Northfleet & Gravesend West, 4 June 2009". 4 June 2009.
  33. "Election results for Maidstone Central, 4 June 2009". 4 June 2009.
  34. "Election results for Maidstone North East, 4 June 2009". 4 June 2009.
  35. "Election results for Maidstone Rural East, 4 June 2009". 4 June 2009.
  36. "Election results for Maidstone Rural North, 4 June 2009". 4 June 2009.
  37. "Election results for Maidstone Rural South, 4 June 2009". 4 June 2009.
  38. "Election results for Maidstone Rural West, 4 June 2009". 4 June 2009.
  39. "Election results for Maidstone South, 4 June 2009". 4 June 2009.
  40. "Election results for Maidstone South East, 4 June 2009". 4 June 2009.
  41. "Election results for Darent Valley, 4 June 2009". 4 June 2009.
  42. "Election results for Sevenoaks Central, 4 June 2009". 4 June 2009.
  43. "Election results for Sevenoaks East, 4 June 2009". 4 June 2009.
  44. "Election results for Sevenoaks North East, 4 June 2009". 4 June 2009.
  45. "Election results for Sevenoaks South, 4 June 2009". 4 June 2009.
  46. "Election results for Sevenoaks West, 4 June 2009". 4 June 2009.
  47. "Election results for Swanley, 4 June 2009". 4 June 2009.
  48. "Election results for Elham Valley, 4 June 2009". 4 June 2009.
  49. "Election results for Folkestone North East, 4 June 2009". 4 June 2009.
  50. "Election results for Folkestone South, 4 June 2009". 4 June 2009.
  51. "Election results for Folkestone West, 4 June 2009". 4 June 2009.
  52. "Election results for Romney Marsh, 4 June 2009". 4 June 2009.
  53. "Election results for Faversham, 4 June 2009". 4 June 2009.
  54. "Election results for Sheerness, 4 June 2009". 4 June 2009.
  55. "Election results for Sheppey, 4 June 2009". 4 June 2009.
  56. "Election results for Swale Central, 4 June 2009". 4 June 2009.
  57. "Election results for Swale East, 4 June 2009". 4 June 2009.
  58. "Election results for Swale West, 4 June 2009". 4 June 2009.
  59. "Election results for Birchington and Villages, 4 June 2009". 4 June 2009.
  60. "Election results for Broadstairs & Sir M M'fiore, 4 June 2009". 4 June 2009.
  61. "Election results for Margate & Cliftonville, 4 June 2009". 4 June 2009.
  62. "Election results for Margate West, 4 June 2009". 4 June 2009.
  63. "Election results for Ramsgate, 4 June 2009". 4 June 2009.
  64. "Election results for Malling Central, 4 June 2009". 4 June 2009.
  65. "Election results for Malling North, 4 June 2009". 4 June 2009.
  66. "Election results for Malling Rural East, 4 June 2009". 4 June 2009.
  67. "Election results for Malling Rural North East, 4 June 2009". 4 June 2009.
  68. "Election results for Malling West, 4 June 2009". 4 June 2009.
  69. "Election results for Tonbridge, 4 June 2009". 4 June 2009.
  70. "Election results for Cranbrook, 4 June 2009". 4 June 2009.
  71. "Election results for Tunbridge Wells East, 4 June 2009". 4 June 2009.
  72. "Election results for Tunbridge Wells North, 4 June 2009". 4 June 2009.
  73. "Election results for Tunbridge Wells Rural, 4 June 2009". 4 June 2009.
  74. "Election results for Tunbridge Wells South, 4 June 2009". 4 June 2009.
  75. "Election results for Tunbridge Wells West, 4 June 2009". 4 June 2009.