| ||||||||||||||||||||||||||||||||||||||||||||||||||||||||||||||||||||||||||||||||||||||||||||||
All 47 seats to Swale Borough Council 24 seats needed for a majority | ||||||||||||||||||||||||||||||||||||||||||||||||||||||||||||||||||||||||||||||||||||||||||||||
---|---|---|---|---|---|---|---|---|---|---|---|---|---|---|---|---|---|---|---|---|---|---|---|---|---|---|---|---|---|---|---|---|---|---|---|---|---|---|---|---|---|---|---|---|---|---|---|---|---|---|---|---|---|---|---|---|---|---|---|---|---|---|---|---|---|---|---|---|---|---|---|---|---|---|---|---|---|---|---|---|---|---|---|---|---|---|---|---|---|---|---|---|---|---|
| ||||||||||||||||||||||||||||||||||||||||||||||||||||||||||||||||||||||||||||||||||||||||||||||
The winner of each seat by party in the 2023 Swale Borough Council Election | ||||||||||||||||||||||||||||||||||||||||||||||||||||||||||||||||||||||||||||||||||||||||||||||
|
The 2023 Swale Borough Council election took place on 4 May 2023 to elect members of Swale Borough Council in Kent, England. [3] This was on the same day as other local elections across England.
The council was under no overall control prior to the election. The Conservatives were the largest party, but the council was being run by a rainbow coalition of all the other main parties, led by Mike Baldock of local party the Swale Independents. The council remained under no overall control after the election, and Labour overtook the Conservatives to become the largest party. [4] A new coalition of Labour, the Swale Independents and Greens formed. [5] The new Labour group leader, Tim Gibson, was appointed leader of the council at the subsequent annual council meeting on 17 May 2023, with Mike Baldock becoming deputy leader. [6]
2023 Swale Borough Council election | ||||||||||
---|---|---|---|---|---|---|---|---|---|---|
Party | Candidates | Seats | Gains | Losses | Net gain/loss | Seats % | Votes % | Votes | +/− | |
Labour | 31 | 15 | 6 | 0 | 6 | 31.92% | 24.43% | 13,343 | 1.03% | |
Conservative | 44 | 12 | 3 | 7 | 4 | 25.53% | 30.58% | 16,703 | 3.42% | |
Swale Independents | 15 | 11 | 3 | 1 | 2 | 23.4% | 17.3% | 9,449 | 2.8% | |
Liberal Democrats | 22 | 5 | 1 | 0 | 1 | 10.64% | 13.05% | 7,127 | 3.35% | |
Green | 13 | 3 | 1 | 0 | 1 | 6.38% | 8.65% | 4,722 | 2.95% | |
Independent | 7 | 1 | 0 | 5 | 5 | 2.13% | 4.21% | 2,301 | 0.39% | |
Reform UK | 4 | 0 | 0 | 1 | 1 | 0% | 1.04% | 569 | New | |
Heritage | 1 | 0 | 0 | 0 | 0 | 0% | 0.44% | 240 | New | |
Monster Raving Loony | 1 | 0 | 0 | 0 | 0 | 0% | 0.3% | 161 | 0.31% |
The Statement of Persons Nominated, which details the candidates standing in each ward, was released by Swale Borough Council following the close of nominations on 4 April 2023. [7] The results for each ward were as follows: [8]
Party | Candidate | Votes | % | ±% | |
---|---|---|---|---|---|
Liberal Democrats | Hannah Perkin* | 918 | 63.2 | +18 | |
Liberal Democrats | Chris Williams | 807 | 55.6 | +18 | |
Labour | Trevor Payne | 314 | 21.6 | +4 | |
Conservative | Jay Brown | 276 | 19.0 | +1 | |
Labour Co-op | Frances Rehal | 261 | 18.0 | +4 | |
Conservative | Melanie Regan-Brown | 244 | 16.8 | ±0 | |
Turnout | 1,452 | ||||
Liberal Democrats hold | |||||
Party | Candidate | Votes | % | ±% | |
---|---|---|---|---|---|
Swale Ind. | Lloyd Chapman | 501 | 39.3 | -20 | |
Conservative | Rog Clark* | 483 | 37.9 | -1 | |
Labour | Olufemi Olukoya | 401 | 31.5 | +11 | |
Conservative | Gareth Randall | 343 | 26.9 | -3 | |
Liberal Democrats | Marc Wilson | 267 | 21.0 | N/A | |
Green | Carol Goatham | 236 | 18.5 | N/A | |
Majority | |||||
Turnout | 1,274 | ||||
Swale Ind. hold | Swing | ||||
Conservative hold | Swing | ||||
Party | Candidate | Votes | % | ±% | |
---|---|---|---|---|---|
Swale Ind. | Mike Baldock* | 1,030 | 71.5 | -8 | |
Swale Ind. | Ann Cavanagh | 728 | 50.5 | N/A | |
Conservative | Nicholas Hampshire* | 424 | 29.4 | -5 | |
Conservative | Conor Dobbs | 262 | 18.2 | N/A | |
Labour | Martin Singer | 184 | 12.8 | -15 | |
Majority | |||||
Turnout | 1,441 | ||||
Swale Ind. hold | Swing | ||||
Swale Ind. gain from Conservative | Swing | ||||
Party | Candidate | Votes | % | ±% | |
---|---|---|---|---|---|
Green | Rich Lehmann | 1,123 | 61.9 | +22 | |
Green | Alastair Gould* | 1,122 | 61.9 | +18 | |
Conservative | Piers Baker | 392 | 21.6 | -8 | |
Conservative | Oliver Lane | 346 | 19.1 | -1 | |
Swale Ind. | Jeff Tutt | 278 | 15.3 | -18 | |
Liberal Democrats | Sonia Fox | 102 | 5.6 | N/A | |
Liberal Democrats | Ida Linfield | 77 | 4.2 | N/A | |
Majority | 730 | ||||
Turnout | 1,814 | ||||
Green hold | Swing | ||||
Party | Candidate | Votes | % | ±% | |
---|---|---|---|---|---|
Labour | Charlie Miller | 298 | 55.3 | -13.0 | |
Conservative | Richard Allsep | 173 | 32.1 | +0.4 | |
Green | Hannah Temple | 68 | 12.6 | N/A | |
Majority | |||||
Turnout | 539 | ||||
Labour hold | Swing | ||||
Party | Candidate | Votes | % | ±% | |
---|---|---|---|---|---|
Green | Terry Thompson | 423 | 45.9 | +28.7 | |
Conservative | David Simmons* | 389 | 42.2 | -3.7 | |
Liberal Democrats | Stephen Fisher | 110 | 11.9 | +3.1 | |
Majority | |||||
Turnout | 922 | ||||
Green gain from Conservative | Swing | ||||
Party | Candidate | Votes | % | ±% | |
---|---|---|---|---|---|
Swale Ind. | Richard Palmer* | 943 | 58.8 | -4 | |
Swale Ind. | Chris Palmer | 879 | 54.8 | N/A | |
Conservative | Alan Horton* | 513 | 32.0 | -4 | |
Conservative | Asha Saroy | 336 | 20.9 | -12 | |
Labour | Margaret Cooper | 279 | 17.4 | ±0 | |
Majority | |||||
Turnout | 1,605 | ||||
Swale Ind. hold | Swing | ||||
Swale Ind. gain from Conservative | Swing | ||||
Party | Candidate | Votes | % | ±% | |
---|---|---|---|---|---|
Labour | Simon Clark* | 511 | 38.2 | -26 | |
Labour | Shelley Cheesman | 483 | 36.2 | -35 | |
Swale Ind. | Jason Clinch | 395 | 29.6 | N/A | |
Conservative | Danielle Hoynes | 343 | 25.7 | ±0 | |
Conservative | John Wright | 340 | 25.4 | -3 | |
Heritage | Thomas Lee | 240 | 18.0 | N/A | |
Liberal Democrats | Frances Stennings | 166 | 12.4 | N/A | |
Majority | |||||
Turnout | 1,336 | ||||
Labour hold | Swing | ||||
Party | Candidate | Votes | % | ±% | |
---|---|---|---|---|---|
Swale Ind. | Derek Carnell* | 476 | 47.7 | -2 | |
Labour | Ashley Wise | 357 | 35.8 | +12 | |
Conservative | Sue Gent | 356 | 35.7 | +6 | |
Conservative | Mike Dendor* | 322 | 32.3 | -6 | |
Liberal Democrats | Tony Clark | 236 | 23.7 | +6 | |
Majority | |||||
Turnout | 997 | ||||
Swale Ind. hold | Swing | ||||
Labour gain from Conservative | Swing | ||||
Party | Candidate | Votes | % | ±% | |
---|---|---|---|---|---|
Labour | Anthony Winckless* | 674 | 65.4 | +13 | |
Labour | Angelica Valls | 559 | 54.2 | +18 | |
Swale Ind. | Stephen Davey* | 303 | 29.4 | -7 | |
Conservative | David Danaher | 186 | 18.0 | -2 | |
Conservative | Stuart Williams | 166 | 16.1 | +2 | |
Majority | |||||
Turnout | 1,031 | ||||
Labour hold | Swing | ||||
Labour gain from Swale Ind. | Swing | ||||
Party | Candidate | Votes | % | ±% | |
---|---|---|---|---|---|
Swale Ind. | Tom Nundy | 656 | 40.5 | -12 | |
Conservative | Andy Booth | 561 | 34.6 | ±0 | |
Conservative | Ken Ingleton* | 554 | 34.2 | -2 | |
Conservative | Hollie Bolitho | 466 | 28.7 | -10 | |
Independent | Richard Darby* | 457 | 28.2 | -25 | |
Labour | Libby Tucker | 396 | 24.4 | +7 | |
Green | Josie Galvin | 276 | 17.0 | -6 | |
Reform UK | Will Fotheringham-Bray | 163 | 10.1 | N/A | |
Majority | |||||
Turnout | 1,621 | ||||
Swale Ind. gain from Independent | Swing | ||||
Conservative hold | Swing | ||||
Party | Candidate | Votes | % | ±% | |
---|---|---|---|---|---|
Swale Ind. | James Hall* | 593 | 57.7 | +1 | |
Labour | Mark Last | 397 | 38.6 | +15 | |
Conservative | Ann Hampshire* | 211 | 20.5 | -4 | |
Conservative | Glen Le Grys | 171 | 16.6 | N/A | |
Liberal Democrats | Alexander Stennings | 139 | 13.5 | +4 | |
Liberal Democrats | Mary Zeng | 127 | 12.4 | N/A | |
Green | Miriam Layton | 119 | 11.6 | N/A | |
Majority | |||||
Turnout | 1,028 | ||||
Swale Ind. hold | Swing | ||||
Labour gain from Conservative | Swing | ||||
Party | Candidate | Votes | % | ±% | |
---|---|---|---|---|---|
Liberal Democrats | Michael Henderson | 394 | 54.6 | +3.8 | |
Conservative | Andy Culham | 174 | 24.1 | -5.0 | |
Labour | Rob Crayford | 98 | 13.6 | +1.9 | |
Green | Sonia Jackson | 55 | 7.6 | +0.1 | |
Majority | |||||
Turnout | 721 | ||||
Liberal Democrats hold | Swing | ||||
Party | Candidate | Votes | % | ±% | |
---|---|---|---|---|---|
Labour | Ashley Shiel | 603 | 40.6 | +7 | |
Conservative | Peter Marchington* | 586 | 39.5 | -7 | |
Conservative | Mike Whiting | 522 | 35.2 | -19 | |
Labour | Donna Boakes | 508 | 34.2 | +4 | |
Conservative | Bailey Allison | 498 | 33.5 | -11 | |
Labour | Jordan Hartley | 462 | 31.1 | N/A | |
Swale Ind. | Lorraine St. John | 293 | 19.7 | N/A | |
Liberal Democrats | Linda Brinklow | 227 | 15.3 | N/A | |
Majority | |||||
Turnout | 1,485 | ||||
Labour gain from Conservative | Swing | ||||
Conservative hold | Swing | ||||
Party | Candidate | Votes | % | ±% | |
---|---|---|---|---|---|
Labour | Tim Gibson* | 652 | 58.6 | +1 | |
Labour | Karen Watson | 535 | 48.1 | -5 | |
Conservative | Mark Quinton | 300 | 27.0 | -14 | |
Conservative | Alfred Okotie | 266 | 23.9 | -7 | |
Green | Debra Blacklock | 167 | 15.0 | N/A | |
Liberal Democrats | Rosemary Madgwick | 134 | 12.0 | N/A | |
Majority | |||||
Turnout | 1,113 | ||||
Labour hold | Swing | ||||
Party | Candidate | Votes | % | ±% | |
---|---|---|---|---|---|
Labour | Angela Harrison* | 727 | 52.9 | +9 | |
Labour | Hayden Brawn | 612 | 44.5 | +6 | |
Labour | Dolley White | 573 | 41.7 | +6 | |
Conservative | Patricia Rogers | 394 | 28.7 | +6 | |
Independent | Lee McCall* | 382 | 27.8 | -18 | |
Reform UK | Jeffrey Williams | 205 | 14.9 | N/A | |
Majority | |||||
Turnout | 1,374 | ||||
Labour gain from Independent | Swing | ||||
Labour hold | Swing | ||||
Labour gain from Conservative | Swing | ||||
Party | Candidate | Votes | % | ±% | |
---|---|---|---|---|---|
Swale Ind. | Elliott Jayes* | 794 | 51.7 | -10 | |
Conservative | Peter Neal* | 409 | 26.6 | -1 | |
Conservative | Mark Tucker | 389 | 25.3 | -5 | |
Labour | Ian Edworthy | 362 | 23.6 | +3 | |
Conservative | Oliver Eakin | 360 | 23.4 | +3 | |
Labour | Alan Henry | 333 | 21.7 | N/A | |
Independent | Peter MacDonald* | 298 | 19.4 | -11 | |
Green | Sam Banks | 200 | 13.0 | -10 | |
Liberal Democrats | Edward Currie | 200 | 13.0 | N/A | |
Monster Raving Loony | Mad Mike Young | 161 | 10.5 | -9 | |
Majority | |||||
Turnout | 1,537 | ||||
Swale Ind. hold | Swing | ||||
Conservative hold | Swing | ||||
Conservative gain from Independent | Swing | ||||
Party | Candidate | Votes | % | ±% | |
---|---|---|---|---|---|
Conservative | Lee-Anne Moore | 347 | 34.8 | +2 | |
Conservative | Tara Noe | 315 | 31.6 | +3 | |
Labour | Matt Wheatcroft | 226 | 22.7 | +7 | |
Independent | Pat Sandle | 215 | 21.6 | N/A | |
Independent | Gaynor Bidgood | 191 | 19.2 | N/A | |
Green | David Walton | 129 | 13.0 | N/A | |
Reform UK | Mini Nissanga* | 108 | 10.8 | -26 | |
Independent | Bill Tatton* | 103 | 10.3 | -31 | |
Majority | |||||
Turnout | 996 | ||||
Conservative gain from Independent | Swing | ||||
Conservative gain from Reform UK | Swing | ||||
Party | Candidate | Votes | % | ±% | |
---|---|---|---|---|---|
Labour | Carole Jackson* | 846 | 48.4 | +7 | |
Labour | Kieran Golding | 765 | 43.7 | +7 | |
Liberal Democrats | Charles Gibson | 448 | 25.6 | -4 | |
Liberal Democrats | Josh Rowlands | 444 | 25.4 | -1 | |
Conservative | Ben Fisher | 398 | 22.8 | -11 | |
Conservative | Frankie O'Brien | 363 | 20.8 | -8 | |
Reform UK | Seb Arrowsmith-Brown | 93 | 5.3 | N/A | |
Majority | |||||
Turnout | 1,749 | ||||
Labour hold | Swing | ||||
Party | Candidate | Votes | % | ±% | |
---|---|---|---|---|---|
Conservative | Lloyd Brown* | 764 | 54.1 | +12 | |
Conservative | Julien Speed | 666 | 47.1 | +14 | |
Green | Janet Bott | 506 | 35.8 | +17 | |
Labour | Georgina Jessiman | 344 | 24.3 | +7 | |
Liberal Democrats | Dorothee Barker | 135 | 9.6 | N/A | |
Liberal Democrats | Carol Morris | 113 | 8.0 | -1 | |
Majority | |||||
Turnout | 1,413 | ||||
Conservative hold | Swing | ||||
Party | Candidate | Votes | % | ±% | |
---|---|---|---|---|---|
Conservative | James Hunt* | 395 | 68.2 | +12.0 | |
Liberal Democrats | Shaun Wakelen | 184 | 31.8 | N/A | |
Majority | |||||
Turnout | 579 | ||||
Conservative hold | Swing | ||||
Party | Candidate | Votes | % | ±% | |
---|---|---|---|---|---|
Liberal Democrats | Ben Martin* | 1,009 | 51.7 | -7 | |
Liberal Democrats | Claire Martin | 830 | 42.5 | -14 | |
Conservative | Jack Goodenough | 496 | 25.4 | -5 | |
Conservative | Jess Valentine | 465 | 23.8 | -3 | |
Labour | Robert Newman | 350 | 17.9 | +4 | |
Labour | James Scott | 300 | 15.4 | N/A | |
Green | Oliver Heyen | 298 | 15.3 | N/A | |
Majority | |||||
Turnout | 1,952 | ||||
Liberal Democrats hold | Swing | ||||
Party | Candidate | Votes | % | ±% | |
---|---|---|---|---|---|
Independent | Monique Bonney* | 655 | 75.3 | -11.6 | |
Conservative | Margaret Benford | 155 | 17.8 | +4.7 | |
Liberal Democrats | Kris Barker | 60 | 6.9 | N/A | |
Majority | |||||
Turnout | 870 | ||||
Independent hold | Swing | ||||
Party | Candidate | Votes | % | ±% | |
---|---|---|---|---|---|
Swale Ind. | Sarah Stephen* | 830 | 53.8 | ||
Swale Ind. | Paul Stephen* | 750 | 48.6 | ||
Conservative | Lee Burgess | 584 | 37.9 | ||
Labour | James Beer | 328 | 21.3 | ||
Majority | |||||
Turnout | 1,542 | ||||
Swale Ind. hold | Swing | ||||
Party | Candidate | Votes | % | ±% | |
---|---|---|---|---|---|
Swale Ind. | Peter MacDonald | 395 | 35.8 | ||
Labour | Edward Baldwin | 339 | 30.7 | ||
Conservative | Oliver Eakin | 331 | 30.0 | ||
Liberal Democrats | Ernest Currie | 39 | 3.5 | ||
Majority | 56 | 5.1 | |||
Turnout | 1,104 | 17.9 | |||
Swale Ind. gain from Conservative | Swing | ||||
The Minster Cliffs by-election was triggered by the death of Conservative councillor Ken Ingleton in July 2023. [9] [10]
Party | Candidate | Votes | % | ±% | |
---|---|---|---|---|---|
Liberal Democrats | Charles Gibson | 435 | 44.8 | ||
Green | Carol Goatham | 173 | 17.8 | ||
Labour | Rob Crayford | 172 | 17.7 | ||
Conservative | Andy Culham | 154 | 15.9 | ||
Reform UK | William Fotheringham-Bray | 36 | 3.7 | ||
Majority | 262 | 27.0 | |||
Turnout | 970 | 24.6 | |||
Registered electors | 4,105 | ||||
Liberal Democrats hold | Swing | ||||
Swale is a local government district with borough status in Kent, England. The council is based in Sittingbourne, the borough's largest town. The borough also contains the towns of Faversham, Queenborough and Sheerness, along with numerous villages and surrounding rural areas. It includes the Isle of Sheppey and is named after The Swale, the narrow channel which separates Sheppey from the mainland part of the borough.
Sittingbourne and Sheppey is a constituency in Kent represented in the House of Commons of the UK Parliament since 2010 by Gordon Henderson, a Conservative.
Sheffield City Council is the local authority for the City of Sheffield, a metropolitan borough with city status in South Yorkshire, England. The council consists of 84 councillors, elected to represent 28 wards, each with three councillors. It is currently under no overall control, with Labour, the Liberal Democrats and the Green Party each holding chair positions in a proportionate number of committees.
Bridgend County Borough Council is the governing body for Bridgend County Borough, one of the Principal Areas of Wales.
The 2010 Colchester Borough Council election took place on 6 May 2010 to elect members of Colchester Borough Council in Essex, England. One third of the council was up for election and the council stayed under no overall control.
The 2006 Brent London Borough Council election took place on 4 May 2006 to elect members of Brent London Borough Council in London, England. The whole council was up for election and the Labour Party lost overall control of the council to no overall control.
The 2004 Swale Borough Council election took place on 10 June 2004 to elect members of Swale Borough Council in Kent, England. One third of the council was up for election and the Conservative Party stayed in overall control of the council.
The 2006 Swale Borough Council election took place on 4 May 2006 to elect members of Swale Borough Council in Kent, England. One third of the council was up for election and the Conservative Party stayed in overall control of the council.
The 2007 Swale Borough Council election took place on 3 May 2007 to elect members of Swale Borough Council in Kent, England. One third of the council was up for election and the Conservative Party stayed in overall control of the council.
The 2008 Swale Borough Council election took place on 1 May 2008 to elect members of Swale Borough Council in Kent, England. One third of the council was up for election and the Conservative Party stayed in overall control of the council.
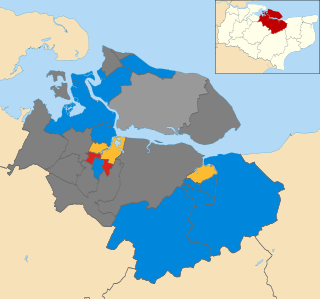
The 2010 Swale Borough Council election took place on 6 May 2010 to elect members of Swale Borough Council in Kent, England. One third of the council was up for election and the Conservative Party stayed in overall control of the council.
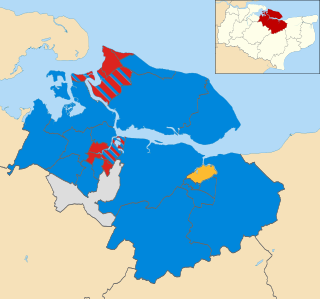
The 2011 Swale Borough Council election took place on 5 May 2011 to elect members of Swale Borough Council in Kent, England. The whole council was up for election and the Conservative Party stayed in overall control of the council.
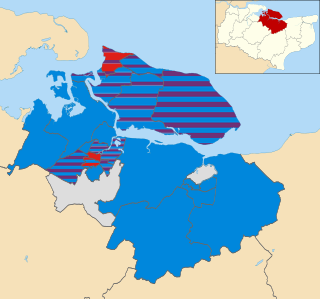
An election was held to Swale Borough Council in England as part of the United Kingdom local elections on 7 May 2015. All 47 seats were up for election under new ward boundaries.
The 2019 Gravesham Borough Council election took place on 2 May 2019 to elect members of the Gravesham Borough Council in Kent, England. It was held on the same day as other local elections. The Labour Party gained control of the council from the Conservative Party.
Elections were held to Swale Borough Council in England as part of the United Kingdom local elections on 2 May 2019.
The 2022 Bromley London Borough Council election took place on 5 May 2022. All 58 members of Bromley London Borough Council were elected. The elections took place alongside local elections in the other London boroughs and elections to local authorities across the United Kingdom.
The 2022 Dumfries and Galloway Council election took place on 5 May 2022 to elect members of Dumfries and Galloway Council representing the Local Authority area of Dumfries and Galloway. It resulted in a council composition with no party receiving a majority of seats. The election used the twelve wards created as a result of the Local Governance (Scotland) Act 2004, with each ward electing three or four councillors using the single transferable vote system form of proportional representation, with 43 councillors being elected.
Elections to Colchester Borough Council took place on 5 May 2022. Eighteen members of the council were elected: one from 16 of the 17 wards, and two councillors from New Town & Christ Church ward, following the death of incumbent councillor Nick Cope, elected in 2019 and due to serve until 2023.
The 2023 Colchester City Council election took place on 4 May 2023 to elect members of Colchester City Council in Essex, England. This was on the same day as other local elections across England. There were 17 of the 51 seats on the council up for election, being the usual third of the council, with one seat available for each ward. This set of seats were last contested at the 2019 election.
The 2023 Canterbury City Council election took place on 4 May 2023 to elect members of Canterbury City Council in Kent, England. This was on the same day as other local elections in England.