| |||||||||||||||||||||||||||||||||||||||||||||
All 35 seats to North Warwickshire Borough Council 18 seats needed for a majority | |||||||||||||||||||||||||||||||||||||||||||||
---|---|---|---|---|---|---|---|---|---|---|---|---|---|---|---|---|---|---|---|---|---|---|---|---|---|---|---|---|---|---|---|---|---|---|---|---|---|---|---|---|---|---|---|---|---|
| |||||||||||||||||||||||||||||||||||||||||||||
Winner of each seat at the 2023 North Warwickshire Borough Council election | |||||||||||||||||||||||||||||||||||||||||||||
|
The 2023 North Warwickshire Borough Council election took place on 4 May 2023, to elect all 35 members of North Warwickshire Borough Council in Warwickshire, England. [2]
Prior to the election the council was under Conservative majority control. Following the results, the Conservatives remained the largest party but lost their majority, leaving the council under no overall control. [3] The Conservatives were able to form a minority administration with the support of two of the three independent councillors. [4]
2023 North Warwickshire Borough Council election [5] | ||||||||||
---|---|---|---|---|---|---|---|---|---|---|
Party | Candidates | Seats | Gains | Losses | Net gain/loss | Seats % | Votes % | Votes | +/− | |
Conservative | 33 | 17 | 1 | 5 | 4 | 48.6 | 47.0 | 13,785 | –7.5 | |
Labour | 35 | 15 | 4 | 3 | 1 | 42.9 | 46.4 | 13,595 | +5.0 | |
Independent | 5 | 3 | 3 | 0 | 3 | 8.6 | 5.5 | 1,608 | +4.8 | |
Green | 1 | 0 | 0 | 0 | 0.0 | 0.5 | 160 | –0.4 | ||
Heritage | 1 | 0 | 0 | 0 | 0.0 | 0.5 | 151 | N/A |
The results for each ward were as follows, with an asterisk (*) indicating an incumbent councillor standing for re-election: [6] [7]
Party | Candidate | Votes | % | ±% | |
---|---|---|---|---|---|
Labour | Jodie Gosling* | 767 | 59.1 | +9.2 | |
Labour | Michaela Jackson | 623 | 48.0 | +2.2 | |
Labour | Nigel Turley | 594 | 45.8 | +6.4 | |
Conservative | Heather Norgrove | 507 | 39.1 | –3.5 | |
Conservative | Chris Jones | 462 | 35.6 | –5.8 | |
Conservative | Kerry Parker* | 419 | 32.3 | –13.9 | |
Heritage | Peter Downes | 151 | 11.6 | N/A | |
Turnout | 1,297 | 28.9 | |||
Registered electors | 4,488 | ||||
Labour hold | |||||
Labour gain from Conservative | |||||
Labour hold | |||||
Party | Candidate | Votes | % | ±% | |
---|---|---|---|---|---|
Labour | Neil Dirveiks* | 413 | 64.9 | +17.2 | |
Labour | Rachel Taylor | 403 | 63.4 | +22.7 | |
Conservative | Mark Jordan | 216 | 34.0 | –4.7 | |
Conservative | Pauline Gurney | 184 | 28.9 | –4.3 | |
Turnout | 636 | 22.0 | |||
Registered electors | 2,895 | ||||
Labour hold | |||||
Labour hold | |||||
Party | Candidate | Votes | % | ±% | |
---|---|---|---|---|---|
Conservative | Ray Jarvis* | 394 | 49.4 | +6.2 | |
Conservative | Mejar Singh* | 378 | 47.4 | +7.6 | |
Labour | Derek Pickard | 369 | 46.3 | +9.8 | |
Labour | Joshua Smith | 350 | 43.9 | +8.2 | |
Turnout | 797 | 28.1 | |||
Registered electors | 2,839 | ||||
Conservative hold | |||||
Party | Candidate | Votes | % | ±% | |
---|---|---|---|---|---|
Labour | Martin Barnett | 453 | 51.5 | +11.0 | |
Conservative | Denise Clews* | 421 | 47.9 | –10.8 | |
Labour | Michael Stanley | 401 | 45.6 | +8.0 | |
Conservative | Tony Clews* | 399 | 45.4 | –9.7 | |
Turnout | 879 | 30.0 | |||
Registered electors | 2,931 | ||||
Labour gain from Conservative | |||||
Conservative hold | |||||
Party | Candidate | Votes | % | ±% | |
---|---|---|---|---|---|
Conservative | Andy Wright* | 637 | 56.3 | –4.3 | |
Conservative | Bernadette Davey* | 583 | 51.5 | –5.6 | |
Labour | Martin Sharp | 482 | 42.6 | +4.1 | |
Labour | Nathan Sweet | 432 | 38.2 | +2.0 | |
Turnout | 1,131 | 33.0 | |||
Registered electors | 3,425 | ||||
Conservative hold | |||||
Party | Candidate | Votes | % | ±% | |
---|---|---|---|---|---|
Labour | Jane Farrow* | 400 | 52.5 | +4.4 | |
Conservative | Peter Fowler | 369 | 48.4 | +4.0 | |
Labour | Adam Richardson | 339 | 44.5 | –9.4 | |
Conservative | Colin Lewis | 315 | 41.3 | +0.9 | |
Turnout | 762 | 30.6 | |||
Registered electors | 2,494 | ||||
Labour hold | |||||
Conservative gain from Labour |
Party | Candidate | Votes | % | ±% | |
---|---|---|---|---|---|
Conservative | Caroline Symonds* | 533 | 59.8 | +6.3 | |
Conservative | Colin Hayfield* | 416 | 46.6 | –1.3 | |
Labour | Alistair Brett | 305 | 34.2 | –2.5 | |
Labour | Keith Brown | 304 | 34.1 | +1.9 | |
Turnout | 892 | 32.0 | |||
Registered electors | 2,786 | ||||
Conservative hold | |||||
Party | Candidate | Votes | % | ±% | |
---|---|---|---|---|---|
Conservative | Sandra Smith | 566 | 63.7 | –11.7 | |
Conservative | Martin Watson | 521 | 58.7 | –14.8 | |
Labour | Celia Banner | 220 | 24.8 | +5.8 | |
Labour | Michael Banner | 171 | 19.3 | +1.1 | |
Green | Joshua Harris | 160 | 18.0 | N/A | |
Turnout | 888 | 33.2 | |||
Registered electors | 2,675 | ||||
Conservative hold | |||||
Party | Candidate | Votes | % | ±% | |
---|---|---|---|---|---|
Independent | Byron Melia | 411 | 65.6 | N/A | |
Independent | Davina Ridley | 361 | 57.6 | N/A | |
Labour | Peter Morson* | 218 | 34.8 | –10.9 | |
Labour | Alexandra Phillips | 173 | 27.8 | –26.7 | |
Turnout | 627 | 27.5 | |||
Registered electors | 2,283 | ||||
Independent gain from Labour | |||||
Independent gain from Labour |
Party | Candidate | Votes | % | ±% | |
---|---|---|---|---|---|
Conservative | Mark Simpson | 597 | 70.1 | –4.4 | |
Conservative | David Wright* | 556 | 65.3 | –0.9 | |
Labour | John Doyle | 225 | 26.4 | +3.1 | |
Labour | Daniel Hodkinson | 215 | 25.2 | +3.5 | |
Turnout | 852 | 31.1 | |||
Registered electors | 2,744 | ||||
Conservative hold | |||||
Party | Candidate | Votes | % | ±% | |
---|---|---|---|---|---|
Conservative | Margaret Bell* | 436 | 53.0 | +0.5 | |
Labour | Katie Holby | 412 | 50.1 | +12.6 | |
Labour | Elinor Parsons | 345 | 41.9 | +12.0 | |
Conservative | Marli Parker | 325 | 39.5 | –5.1 | |
Turnout | 823 | 29.1 | |||
Registered electors | 2,832 | ||||
Conservative hold | |||||
Labour gain from Conservative |
Party | Candidate | Votes | % | ±% | |
---|---|---|---|---|---|
Labour | Hayden Phillips* | 521 | 57.7 | +3.0 | |
Labour | Owen Phillips* | 521 | 57.7 | +8.9 | |
Conservative | John Given | 360 | 39.9 | –3.1 | |
Conservative | Damien Holt | 302 | 33.4 | –8.6 | |
Turnout | 903 | 30.5 | |||
Registered electors | 2,960 | ||||
Labour hold | |||||
Labour hold | |||||
Party | Candidate | Votes | % | ±% | |
---|---|---|---|---|---|
Conservative | Andy Jenns* | 569 | 68.9 | –0.5 | |
Conservative | Debbie Bates | 410 | 49.6 | –8.8 | |
Labour | Philip Page | 222 | 26.9 | +4.2 | |
Labour | Smita Jalaf | 175 | 21.2 | +1.1 | |
Independent | Suzanne Ayasamy | 111 | 13.4 | –7.0 | |
Turnout | 826 | 29.0 | |||
Registered electors | 2,851 | ||||
Conservative hold | |||||
Party | Candidate | Votes | % | ±% | |
---|---|---|---|---|---|
Conservative | Dave Humphreys* | 526 | 48.5 | –8.3 | |
Labour | Brynnen Ririe | 525 | 48.4 | +5.9 | |
Conservative | Marian Humphreys* | 520 | 47.9 | –7.1 | |
Labour | Faye Whapples | 494 | 45.5 | +4.1 | |
Turnout | 1,085 | 35.1 | |||
Registered electors | 3,090 | ||||
Conservative hold | |||||
Labour gain from Conservative |
Party | Candidate | Votes | % | ±% | |
---|---|---|---|---|---|
Labour | Dave Parsons* | 532 | 62.8 | –7.0 | |
Labour | Neil Chapman | 401 | 47.3 | –10.5 | |
Conservative | Dan Hancocks | 326 | 38.5 | +7.4 | |
Conservative | Jack Bayley | 269 | 31.8 | +6.8 | |
Turnout | 847 | 28.9 | |||
Registered electors | 2,932 | ||||
Labour hold | |||||
Labour hold | |||||
Party | Candidate | Votes | % | ±% | |
---|---|---|---|---|---|
Labour | Emma Whapples | 403 | 56.7 | +8.7 | |
Labour | Michael Osborne* | 394 | 55.4 | +7.0 | |
Conservative | Sue Hanratty | 283 | 39.8 | –7.5 | |
Conservative | Suzanne Hancocks | 267 | 37.6 | –8.8 | |
Turnout | 711 | 29.0 | |||
Registered electors | 2,448 | ||||
Labour hold | |||||
Labour hold | |||||
Party | Candidate | Votes | % | ±% | |
---|---|---|---|---|---|
Independent | Steve Stuart | 433 | 48.3 | N/A | |
Conservative | David Reilly* | 384 | 42.9 | –27.8 | |
Conservative | Michael Lee | 335 | 37.4 | –30.3 | |
Independent | Feli Freeman | 292 | 32.6 | N/A | |
Labour | Tom Foley | 164 | 18.3 | –9.8 | |
Labour | John Broughton | 89 | 9.9 | –9.6 | |
Turnout | 896 | 33.2 | |||
Registered electors | 2,701 | ||||
Independent gain from Conservative | |||||
Conservative hold | |||||
Nuneaton and Bedworth is a local government district with borough status in Warwickshire, England. It includes the towns of Nuneaton and Bedworth, as well as a modest rural hinterland including the village of Bulkington.
North Warwickshire is a local government district with borough status in Warwickshire, England. The borough includes the two towns of Atherstone and Coleshill, and the large villages of Polesworth, Kingsbury, Hartshill and Water Orton along with smaller villages and surrounding rural areas.
Westminster City Council is the local authority for the City of Westminster in Greater London, England. It is a London borough council, one of 32 in London. The council has been under Labour majority control since 2022. Full council meetings are generally held at Westminster Council House, also known as Marylebone Town Hall, and the council has its main offices at Westminster City Hall on Victoria Street.
In the context of local authorities in the United Kingdom, no overall control is a situation in which no single political group achieves a majority of seats, comparably to a hung parliament. Of the 248 councils who had members up for election in the 2019 local elections, 73 resulted in a NOC administration. In the 2021 local elections, 14 resulted in no overall control. Outside of the UK, the term may be applied to other local authorities, such as the local councils of Malta and the General Assembly of Budapest in Hungary.
Warwickshire County Council is the county council that governs the non-metropolitan county of Warwickshire in England. Its headquarters are at Shire Hall in the centre of Warwick, the county town. The council's principal functions are county roads and rights of way, social services, education and libraries, but it also provides numerous other local government services in its area.
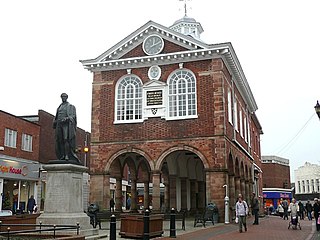
Tamworth Borough Council is the local authority for the borough of Tamworth in the county of Staffordshire, England. The council consists of 30 councillors, three for each of the 10 wards in the town. It is currently under no overall control, led by Conservative councillor Thomas Jay. The borough council is based at Marmion House.
The 2022 United Kingdom local elections took place on Thursday 5 May 2022. These included elections for all London borough councils, and for all local authorities in Wales and Scotland. Most seats in England were last up for election in 2018 and in Scotland and Wales in 2017. The elections coincided with the 2022 Northern Ireland Assembly election. In 91 cases, most of them in Wales, council seats were uncontested, each having only one candidate. Three seats in Scotland remained unfilled as no one nominated to fill them.
The 2021 Nuneaton and Bedworth Borough Council election was held on 6 May 2021 as part of the 2021 United Kingdom local elections and alongside elections for Warwickshire County Council and Warwickshire Police and Crime Commissioner. Half of the borough council seats were up for election and the results provided the Conservative Party with a majority on the council, with the party winning all but two seats up for election.
The 2023 United Kingdom local elections were held on Thursday, 4 May 2023 in England and on Thursday 18 May 2023 in Northern Ireland. These included district councils, unitary authorities, and directly elected mayors in England, and included all local councils in Northern Ireland. Notably, these elections were the first to be held under the Elections Act 2022, a new voter identification law that required voters to show photo ID when attending a polling station, and was a cause for controversy.
The 2023 Tamworth Borough Council election took place on 4 May 2023 to elect 10 of the 30 councillors on Tamworth Borough Council in Staffordshire, England. This was on the same day as other local elections across England.
The 2023 Darlington Borough Council election took place on 4 May 2023 to elect all 50 members of Darlington Borough Council in County Durham, England. This was at the same time as other local elections across England.
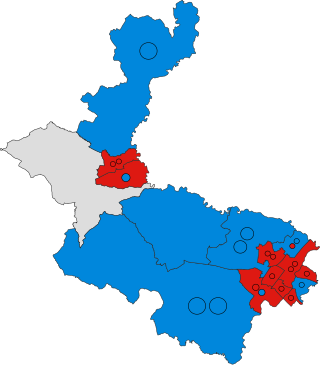
The 2023 East Staffordshire Borough Council election took place on 4 May 2023 to elect all 37 members of East Staffordshire Borough Council in Staffordshire, England. This was on the same day as other local elections across England. New ward boundaries took effect at this election, reducing the number of councillors from 39 to 37.
The 2023 Fylde Borough Council election took place on 4 May 2023 to elect councillors to Fylde Borough Council in Lancashire, England. This was on the same day as other local elections across England.
The 2023 South Derbyshire District Council election took place on 4 May 2023, to elect all 36 members of South Derbyshire District Council in Derbyshire, England. This was on the same day as other local elections across England. Labour took a majority of the seats on the council, which had previously been under no overall control.
The 2023 Rugby Borough Council election took place on 4 May 2023 to elect 14 members (one-third) of Rugby Borough Council in Warwickshire, England. This was on the same day as other local elections across England.
The 2024 North Tyneside Metropolitan Borough Council election was held on Thursday 2 May 2024, alongside the other local elections held in the United Kingdom on the same day. All seats were up for election following boundary changes. Labour retained its majority on the council.
The 2024 Dudley Metropolitan Borough Council election took place on Thursday 2 May 2024 to elect all 72 seats to Dudley Council, alongside the other local elections across the United Kingdom being held on the same day.
The 2024 Calderdale Metropolitan Borough Council election was held on 2 May 2024, alongside the other local elections across the United Kingdom being held on the same day. The council remained under Labour majority control.
The 2024 Tamworth Borough Council election took place on 2 May 2024 to elect 10 of the 30 councillors on Tamworth Borough Council in Staffordshire, England. This was on the same day as other local elections across England.
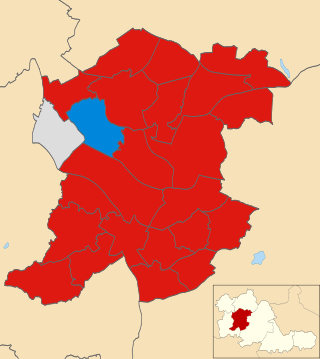
The 2024 Sandwell Metropolitan Borough Council elections was held on 2 May 2024 alongside other local elections in the United Kingdom and the 2024 West Midlands mayoral election. One third of seats on Sandwell Metropolitan Borough Council were up for election. The council remained under Labour majority control.