| |||||||||||||||||||||||||||||||||||||||||||||||||||||||||||||||||||||||||||
All 49 seats to Braintree District Council 25 seats needed for a majority | |||||||||||||||||||||||||||||||||||||||||||||||||||||||||||||||||||||||||||
---|---|---|---|---|---|---|---|---|---|---|---|---|---|---|---|---|---|---|---|---|---|---|---|---|---|---|---|---|---|---|---|---|---|---|---|---|---|---|---|---|---|---|---|---|---|---|---|---|---|---|---|---|---|---|---|---|---|---|---|---|---|---|---|---|---|---|---|---|---|---|---|---|---|---|---|
| |||||||||||||||||||||||||||||||||||||||||||||||||||||||||||||||||||||||||||
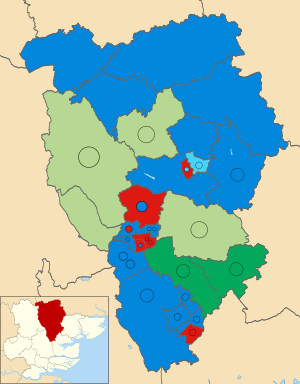
Winner of each seat at the 2023 Braintree District Council election | |||||||||||||||||||||||||||||||||||||||||||||||||||||||||||||||||||||||||||
|
The 2023 Braintree District Council election took place on 4 May 2023 to elect members of Braintree District Council in Essex, England. [2] This was on the same day as other local elections in England.
The Conservatives retained control of the council, but with a reduced majority. [3]
Prior to the election the Conservatives had a majority of 17 seats on the council. They had held a majority since 2007. There were four registered political parties represented on the council plus three independent councillors. The three independents formed a political group with the Greens called the "Green and Independent Group", led by Green councillor James Abbott. [4]
After the election, the Conservatives retained their majority but it was reduced to just 3 seats. Conservative group leader Graham Butland continued to serve as leader of the council, a position he had held continuously since 2004. [5] The Greens and independents continued to form a group after the election, but renamed the "Independent and Green Group" and with the group leadership passing to independent councillor Jo Beavis. The Labour group also changed their leader after the election; their previous leader David Mann had not stood for re-election so Lynn Jefferis was appointed to that role. [6]
2023 Braintree District Council election | |||||||||||
---|---|---|---|---|---|---|---|---|---|---|---|
Party | Candidates | Seats | Gains | Losses | Net gain/loss | Seats % | Votes % | Votes | +/− | ||
Conservative | 49 | 26 | 3 | 11 | 8 | 53.1 | 39.8 | 26,211 | –5.7 | ||
Green and Independent group (G&I) | |||||||||||
Green | 22 | 4 | 0 | 2 | 2 | 8.2 | 15.5 | 10,187 | –2.3 | ||
Independent | 8 | 7 | 4 | 0 | 4 | 14.3 | 10.1 | 6,663 | +6.5 | ||
G&I total | 30 | 11 | 4 | 2 | 2 | 22.4 | 25.6 | 16,850 | +4.2 | ||
Labour | 49 | 9 | 7 | 1 | 7 | 18.4 | 26.8 | 17,677 | +5.7 | ||
Halstead Residents | 4 | 3 | 0 | 1 | 1 | 6.1 | 3.5 | 2,330 | –0.8 | ||
Liberal Democrat | 10 | 0 | 0 | 0 | 0.0 | 3.5 | 2,298 | –0.5 | |||
Reform UK | 4 | 0 | 0 | 0 | 0.0 | 0.5 | 321 | N/A | |||
UKIP | 1 | 0 | 0 | 0 | 0.0 | 0.1 | 68 | –1.1 | |||
Independent | 1 | 0 | 0 | 0 | 0.0 | 0.1 | 64 | –2.2 | |||
Heritage | 1 | 0 | 0 | 0 | 0.0 | 0.1 | 51 | N/A | |||
Total | 149 | 49 | Turnout |
The Statement of Persons Nominated, which details the candidates standing in each ward, was released by Braintree District Council following the close of nomination on 5 April 2023. [7] The results of the district council election were released on 5 May 2023. [8]
Incumbent councillors are marked with an asterisk *.
Party | Candidate | Votes | % | ±% | |
---|---|---|---|---|---|
Conservative | Lyn Walters* | 815 | 50.3 | +9.4 | |
Conservative | Justin Wrench | 804 | 49.7 | +6.3 | |
Conservative | Lynette Bowers-Flint | 773 | 47.7 | +5.2 | |
Green (G&I) | Dormer Andrews | 582 | 35.9 | +6.8 | |
Labour | Jasmine Curitz | 576 | 35.6 | +11.1 | |
Labour | David Chidgey | 540 | 33.4 | +14.1 | |
Labour | Richard Parsons | 421 | 26.0 | +7.9 | |
Liberal Democrats | James Card | 347 | 21.4 | N/A | |
Turnout | 25.0 | –1.5 | |||
Conservative hold | |||||
Party | Candidate | Votes | % | ±% | |
---|---|---|---|---|---|
Labour | Lynn Jefferis | 565 | 51.6 | +0.5 | |
Conservative | John Baugh | 522 | 47.6 | +9.3 | |
Labour | Keiran Martin | 506 | 46.2 | –2.8 | |
Conservative | Felicia Ayo-Ajala | 372 | 33.9 | N/A | |
Green (G&I) | Andrea Phillips | 226 | 20.6 | –1.0 | |
Turnout | 28.9 | +0.3 | |||
Labour hold | |||||
Conservative gain from Labour |
Party | Candidate | Votes | % | ±% | |
---|---|---|---|---|---|
Conservative | Jack Edwards | 511 | 46.8 | +1.5 | |
Labour | Moia Thorogood | 485 | 45.8 | +11.3 | |
Conservative | Trevor McArdle* | 479 | 45.3 | +8.8 | |
Labour | Robert Heath | 459 | 43.4 | +9.6 | |
Green (G&I) | Karl Handy | 181 | 17.1 | –8.7 | |
Turnout | 24.7 | –0.4 | |||
Conservative hold | |||||
Labour gain from Conservative |
Party | Candidate | Votes | % | ±% | |
---|---|---|---|---|---|
Labour | Shirley Mason | 699 | 48.9 | +19.5 | |
Labour | Thomas Diamond | 694 | 48.6 | +20.2 | |
Labour | Jonathan Ayten | 687 | 48.1 | +20.7 | |
Conservative | Karen Brown | 488 | 30.5 | +3.7 | |
Conservative | Sandra Canning | 475 | 30.0 | +3.3 | |
Conservative | Andrew Hensman* | 425 | 29.8 | –5.7 | |
Green (G&I) | Simon Attwood | 422 | 27.3 | +2.3 | |
Independent (G&I) | Colin Riches | 393 | 26.8 | +0.7 | |
Turnout | 24.5 | –1.7 | |||
Labour gain from Conservative | |||||
Labour gain from Conservative |
Party | Candidate | Votes | % | ±% | |
---|---|---|---|---|---|
Labour | Martin Green* | 468 | 44.6 | +14.5 | |
Conservative | Kevin Bowers* | 457 | 43.6 | –5.9 | |
Labour | Jacqueline Thurgood | 444 | 42.3 | +13.2 | |
Conservative | Saif Rehman* | 399 | 38.1 | –10.4 | |
Green (G&I) | Stuart Wicks | 185 | 17.6 | –4.2 | |
Liberal Democrats | Tom Hughes | 144 | 13.7 | N/A | |
Turnout | 24.4 | +0.4 | |||
Labour hold | |||||
Conservative hold | |||||
Martin Green previously gained the seat in the 2022 by-election.
Party | Candidate | Votes | % | ±% | |
---|---|---|---|---|---|
Conservative | Mary Cunningham* | 727 | 55.1 | –0.1 | |
Conservative | George Prime | 692 | 52.4 | –1.1 | |
Labour | Alexander Wilsdon | 457 | 34.6 | +9.3 | |
Labour | Peter Wyatt | 426 | 32.2 | +14.9 | |
Green (G&I) | Nick Scales | 341 | 25.8 | +0.9 | |
Turnout | 30.6 | –0.8 | |||
Conservative hold | |||||
Party | Candidate | Votes | % | ±% | |
---|---|---|---|---|---|
Conservative | Diana Garord* | 479 | 60.2 | –16.0 | |
Labour | Gary Knights | 236 | 29.6 | +5.8 | |
Reform UK | Norma Saggers | 81 | 10.2 | N/A | |
Majority | 243 | 30.6 | –21.8 | ||
Turnout | 796 | 34.6 | –1.8 | ||
Conservative hold | Swing | 10.9 | |||
Party | Candidate | Votes | % | ±% | |
---|---|---|---|---|---|
Independent (G&I) | Tom Walsh* | 981 | 56.5 | +3.0 | |
Independent (G&I) | Dennis Abram* | 928 | 53.4 | –7.7 | |
Conservative | Sue Wilson | 540 | 31.1 | +2.9 | |
Conservative | Chris Siddall | 478 | 27.5 | –0.4 | |
Labour | Robert Powers | 287 | 16.5 | +5.0 | |
Labour | Usha Agarwal-Hollands | 260 | 15.0 | +5.0 | |
Turnout | 39.0 | –4.3 | |||
Independent hold | |||||
Party | Candidate | Votes | % | ±% | |
---|---|---|---|---|---|
Conservative | Peter Schwier* | 396 | 52.6 | +1.0 | |
Green (G&I) | Jenny Bishop | 219 | 29.1 | –5.3 | |
Labour | Deborah Warren | 138 | 18.3 | +4.3 | |
Majority | 177 | 23.5 | +6.3 | ||
Turnout | 753 | 34.9 | –6.5 | ||
Conservative hold | Swing | 3.2 | |||
Party | Candidate | Votes | % | ±% | |
---|---|---|---|---|---|
Conservative | Graham Butland* | 1,028 | 54.6 | –5.0 | |
Conservative | Frankie Ricci* | 979 | 52.0 | –0.2 | |
Conservative | Tom Cunningham* | 969 | 51.5 | –1.2 | |
Green (G&I) | Poppy Gerrard-Abbott | 490 | 26.0 | –0.8 | |
Labour | Andrew Beatty | 428 | 22.7 | +7.8 | |
Liberal Democrats | Brian Smith | 387 | 20.5 | N/A | |
Labour | Antony Jones | 384 | 20.4 | +6.9 | |
Labour | Bronislaw Jagniaszek | 354 | 18.8 | +8.2 | |
Liberal Democrats | David Toombs | 347 | 18.4 | +3.2 | |
Liberal Democrats | Graham Sheppard | 284 | 15.1 | –1.7 | |
Turnout | 27.0 | –1.2 | |||
Conservative hold | |||||
Party | Candidate | Votes | % | ±% | |
---|---|---|---|---|---|
Halstead Residents | Jim Bond | 664 | 56.7 | +3.8 | |
Halstead Residents | Andy Munday* | 632 | 53.9 | +6.5 | |
Conservative | David Finch | 289 | 24.7 | +2.0 | |
Labour | Steven Knight | 286 | 24.4 | +10.5 | |
Labour | Kathleen Tearle | 255 | 21.8 | +8.7 | |
Conservative | Olatunbosun Senbanjo | 150 | 12.8 | –7.2 | |
UKIP | Judy Wood | 68 | 5.8 | N/A | |
Turnout | 25.7 | –4.9 | |||
Halstead Residents hold | |||||
--->
Party | Candidate | Votes | % | ±% | |
---|---|---|---|---|---|
Halstead Residents | Jackie Pell* | 625 | 54.0 | –10.5 | |
Labour | Malcolm Fincken | 520 | 44.9 | +18.4 | |
Labour | Garry Warren | 437 | 37.8 | +14.4 | |
Halstead Residents | Linda Hilton | 409 | 35.4 | –12.4 | |
Conservative | Barry Britten | 180 | 15.6 | –5.0 | |
Conservative | Libby Poole | 143 | 12.4 | N/A | |
Turnout | 24.3 | –2.5 | |||
Halstead Residents hold | |||||
Labour gain from Halstead Residents |
Party | Candidate | Votes | % | ±% | |
---|---|---|---|---|---|
Conservative | Charley Dervish | 877 | 63.7 | +0.3 | |
Conservative | James Coleridge* | 855 | 62.1 | +2.3 | |
Green (G&I) | Jonathan Barker | 409 | 29.7 | +6.1 | |
Labour | Linda Bennison | 312 | 22.7 | +14.3 | |
Labour | Tony Bennett | 299 | 21.7 | +11.9 | |
Turnout | 30.8 | –2.8 | |||
Conservative hold | |||||
Party | Candidate | Votes | % | ±% | |
---|---|---|---|---|---|
Independent (G&I) | Jo Beavis* | 941 | 73.8 | +27.2 | |
Independent (G&I) | Wendy Taylor | 764 | 59.9 | N/A | |
Conservative | Jason Ferrando | 304 | 23.9 | –21.9 | |
Conservative | Philip Rawlinson | 236 | 18.5 | –8.9 | |
Labour | Christine Calver | 156 | 12.2 | +4.4 | |
Labour | Matthew Creamer | 148 | 11.6 | –2.7 | |
Turnout | 30.1 | +0.1 | |||
Independent hold | |||||
Independent gain from Conservative |
Party | Candidate | Votes | % | ±% | |
---|---|---|---|---|---|
Green (G&I) | Paul Thorogood* | 1,096 | 57.4 | +15.6 | |
Green (G&I) | Camilla Finch | 940 | 49.2 | –0.8 | |
Conservative | Robert Mitchell | 668 | 35.0 | –4.2 | |
Conservative | India Jayatillake | 644 | 33.7 | –3.0 | |
Labour | Eileen Davidson | 246 | 12.9 | –3.5 | |
Labour | Pamela Carlaw | 226 | 11.8 | +1.6 | |
Turnout | 43.6 | +3.3 | |||
Green hold | |||||
Green hold | |||||
Party | Candidate | Votes | % | ±% | |
---|---|---|---|---|---|
Independent (G&I) | Ann Hooks | 528 | 64.0 | N/A | |
Conservative | Glenn Young | 218 | 26.4 | –27.9 | |
Labour | Nigel Gibson | 79 | 9.6 | –3.3 | |
Majority | 310 | 37.6 | N/A | ||
Turnout | 825 | 37.6 | +1.8 | ||
Independent gain from Conservative | Swing | N/A | |||
Party | Candidate | Votes | % | ±% | |
---|---|---|---|---|---|
Green (G&I) | James Abbott* | 1,198 | 75.2 | –1.7 | |
Green (G&I) | Bob Wright* | 1,017 | 63.8 | +2.7 | |
Conservative | Jacky Bayford | 300 | 18.8 | +4.5 | |
Conservative | Darrin Hammond | 297 | 18.6 | N/A | |
Labour | Steven Bennison | 134 | 8.4 | +2.6 | |
Labour | Ann Griffin | 126 | 7.9 | +0.9 | |
Independent | Annetta Hawkins | 64 | 4.0 | N/A | |
Heritage | Andrew Page | 51 | 3.2 | N/A | |
Turnout | 31.5 | –7.0 | |||
Green hold | |||||
Green hold | |||||
Party | Candidate | Votes | % | ±% | |
---|---|---|---|---|---|
Conservative | Iona Parker* | 507 | 55.6 | –28.7 | |
Labour | Peter Long | 172 | 18.9 | +3.2 | |
Green (G&I) | Mark Posen | 167 | 18.3 | N/A | |
Reform UK | Raymond Richards | 66 | 7.2 | N/A | |
Majority | 335 | 36.7 | –32.0 | ||
Turnout | 912 | 36.0 | –3.1 | ||
Conservative hold | Swing | 16.0 | |||
Party | Candidate | Votes | % | ±% | |
---|---|---|---|---|---|
Conservative | David Holland | 549 | 59.3 | –2.4 | |
Green (G&I) | Paul Robinson | 221 | 23.9 | N/A | |
Labour | Frederick Hearn | 156 | 16.8 | +8.4 | |
Majority | 328 | 35.4 | +3.6 | ||
Turnout | 926 | 38.0 | –0.9 | ||
Conservative hold | Swing | N/A | |||
Party | Candidate | Votes | % | ±% | |
---|---|---|---|---|---|
Conservative | George Courtauld* | 724 | 56.3 | –9.1 | |
Conservative | Gabrielle Spray* | 707 | 55.0 | –7.4 | |
Green (G&I) | James Astley | 549 | 42.7 | –2.1 | |
Labour | Sandra Hindley | 346 | 26.9 | +8.2 | |
Labour | Felix Preston | 247 | 19.2 | +8.6 | |
Turnout | 30.8 | +4.3 | |||
Conservative hold | |||||
Party | Candidate | Votes | % | ±% | |
---|---|---|---|---|---|
Independent (G&I) | Mark Ault | 995 | 53.1 | N/A | |
Independent (G&I) | Michael Staines | 851 | 45.4 | N/A | |
Conservative | John Warner | 818 | 43.6 | –26.2 | |
Conservative | Stephen Canning | 593 | 31.6 | –30.0 | |
Labour | William Edwards | 265 | 14.1 | –3.7 | |
Labour | Stephen Newton | 228 | 12.2 | –5.2 | |
Turnout | 43.2 | +10.2 | |||
Independent gain from Conservative | |||||
Independent gain from Conservative |
Party | Candidate | Votes | % | ±% | |
---|---|---|---|---|---|
Conservative | Sindhu Rajeev | 510 | 39.7 | –6.0 | |
Conservative | Toby Williams | 486 | 37.9 | +1.5 | |
Labour | Lucy Barlow | 362 | 28.2 | +11.5 | |
Green (G&I) | Edwyn Gerrard-Abbott | 358 | 27.9 | –3.9 | |
Labour | Joan Coleman | 288 | 22.4 | +6.5 | |
Liberal Democrats | Barry Fleet | 259 | 20.2 | –10.7 | |
Liberal Democrats | Helen Waring | 198 | 15.4 | N/A | |
Reform UK | Richard Thomson | 107 | 8.3 | N/A | |
Turnout | 27.9 | –0.1 | |||
Conservative hold | |||||
Party | Candidate | Votes | % | ±% | |
---|---|---|---|---|---|
Conservative | Billy Taylor | 568 | 39.6 | +10.2 | |
Conservative | Ethan Williams | 543 | 37.8 | +8.8 | |
Labour | Philip Barlow | 477 | 33.2 | +1.4 | |
Labour | Leanora Headley | 418 | 29.1 | +4.8 | |
Green (G&I) | Stephen Hicks* | 401 | 27.9 | –7.9 | |
Green (G&I) | Phillip Hughes | 396 | 27.6 | –12.0 | |
Reform UK | Tim Blaxill | 67 | 4.7 | N/A | |
Turnout | 26.9 | –3.1 | |||
Conservative gain from Green | |||||
Conservative gain from Green |
Party | Candidate | Votes | % | ±% | |
---|---|---|---|---|---|
Labour | Paul Heath | 501 | 44.5 | +21.1 | |
Labour | Jacqueline Martin | 473 | 42.0 | +20.2 | |
Conservative | William Korsinah | 448 | 39.8 | –14.7 | |
Conservative | Joe Trigg | 424 | 37.6 | –12.7 | |
Green (G&I) | Stephanie Bills | 174 | 15.4 | N/A | |
Liberal Democrats | Paul Hewitt | 137 | 12.2 | –16.7 | |
Liberal Democrats | Charlie Ryland | 97 | 8.6 | –17.6 | |
Turnout | 26.0 | +2.0 | |||
Labour gain from Conservative | |||||
Labour gain from Conservative |
Party | Candidate | Votes | % | ±% | |
---|---|---|---|---|---|
Conservative | Jon Hayes | 533 | 40.1 | –3.5 | |
Conservative | Ron Ramage* | 520 | 39.1 | –2.1 | |
Labour | Jack Coleman | 467 | 35.1 | +9.2 | |
Labour | Jack Robertson | 427 | 32.1 | +14.5 | |
Green (G&I) | Susan Ager | 361 | 27.1 | –2.3 | |
Green (G&I) | Steven Crane | 254 | 19.1 | N/A | |
Liberal Democrats | Andrew Holt | 98 | 7.4 | –6.5 | |
Turnout | 28.3 | –0.8 | |||
Conservative hold | |||||
Party | Candidate | Votes | % | ±% | |
---|---|---|---|---|---|
Conservative | Richard Van Dulken | 312 | 44.2 | –27.9 | |
Independent (G&I) | Julia Allen | 282 | 39.9 | N/A | |
Labour | Denis Franklin | 112 | 15.9 | –12.0 | |
Turnout | 706 | 32.1 | +1.0 | ||
Conservative hold | Swing | N/A | |||
Braintree District is a local government district in Essex, England. The district is named after the town of Braintree, where the council is based. The district also includes the towns of Halstead and Witham and surrounding rural areas.
Braintree is a constituency in Essex represented in the House of Commons of the UK Parliament since 2015 by James Cleverly, a member of the Conservative Party.
Braintree District Council in Essex, England is elected every four years. Since the last comprehensive boundary changes in 2015, 49 councillors have been elected from 26 wards.
Maldon is a constituency in Essex represented in the House of Commons of the UK Parliament since its recreation in 2010 by Sir John Whittingdale, a Conservative.
Witham is a parliamentary constituency in Essex represented by Dame Priti Patel in the House of Commons of the UK Parliament since its 2010 creation. She is a Conservative who was Home Secretary from 24 July 2019 until her resignation on 5 September 2022 following the announcement of the results of the Conservative Party leadership contest.
An election to Essex County Council took place on 2 May 2013 as part of the 2013 United Kingdom local elections. 75 councillors were elected from 70 electoral divisions, which returned either one or two county councillors each by first-past-the-post voting for a four-year term of office. The electoral divisions were the same as those used at the previous election in 2009. No elections were held in Thurrock or Southend-on-Sea, which are unitary authorities outside the area covered by the County Council.
The 2011 Torridge District Council election took place on 5 May 2011 to elect members of Torridge District Council in Devon, England. The whole council was up for election and the council stayed under no overall control.
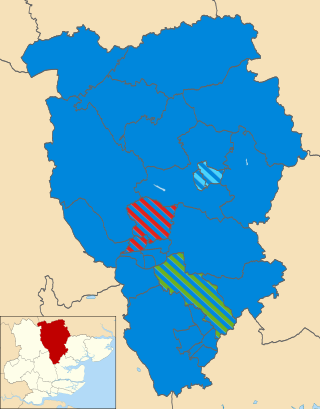
The 2015 Braintree District Council election was scheduled to take place on 7 May 2015 to elect members of Braintree District Council in England. This was on the same day as other local elections.
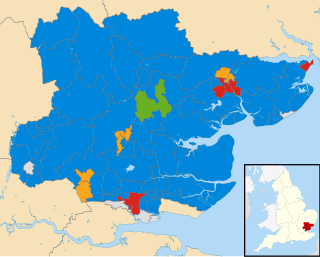
Elections to Essex County Council took place on 4 May 2017 as part of the 2017 local elections. All 75 councillors were elected from 70 electoral divisions, which each returned either one or two councillors by first-past-the-post voting for a four-year term of office.
The 2019 Braintree District Council election took place on 2 May 2019 to elect members of Braintree District Council in England. This was on the same day as other local elections.
The 2019 Herefordshire Council election took place on 2 May 2019 to elect 52 of 53 members of Herefordshire Council in England. The election in Ross North ward was deferred until 6 June 2019 following the death of the UKIP candidate.
The 2021 Essex County Council election took place on 6 May 2021 as part of the 2021 United Kingdom local elections. All 75 councillors were elected from 70 electoral divisions, with each returning either one or two councillors by first-past-the-post voting for a four-year term of office.
Elections to Isle of Wight Council took place on 6 May 2021 as part of the 2021 United Kingdom local elections. These were held at the same time as the elections for the Hampshire Police and Crime Commissioner. The elections saw the Conservatives lose control of the council, losing seats against the national trend for the party.
Elections to Cannock Chase District Council took place on 6 May 2021 on the same day as the Staffordshire County council election and other local elections in England. These elections were due to take place on 7 May 2020 but were delayed by 12 months due to the coronavirus pandemic. All but two of the council's wards were up for election, meaning a total of 13 councillors were elected.
The 2022 Calderdale Metropolitan Borough Council election took place on 5 May 2022 to elect members of Calderdale Metropolitan Borough Council in England. One third of councillors — 17 out of 51, plus one vacancy in Ovenden ward were up for election. The election took place alongside other local elections across the United Kingdom.
Elections to Colchester Borough Council took place on 5 May 2022. Eighteen members of the council were elected: one from 16 of the 17 wards, and two councillors from New Town & Christ Church ward, following the death of incumbent councillor Nick Cope, elected in 2019 and due to serve until 2023.
The 2023 United Kingdom local elections were held on Thursday, 4 May 2023 in England and on Thursday 18 May 2023 in Northern Ireland. These included district councils, unitary authorities, and directly elected mayors in England, and included all local councils in Northern Ireland. Notably, these elections were the first to be held under the Elections Act 2022, a new voter identification law that required voters to show photo ID when attending a polling station, and was a cause for controversy.
The 2023 South Kesteven District Council election took place on 4 May 2023 to elect all 56 members of South Kesteven District Council in Lincolnshire, England. This was on the same day as other local elections across England.
The 2023 Torridge District Council election took place on 4 May 2023, to elect all 36 members of Torridge District Council in Devon, England.
The 2023 Cannock Chase District election took place on 4 May 2023 to elect 17 of the 41 councillors on Cannock Chase District Council in Staffordshire, England. on the same day as other local elections in England, including to eight parish councils in the district. The usual nominal third of the council was up for election, plus there were two vacancies to be filled, meaning a total of 17 councillors were elected.