1976 Braintree District Council election

Last updated
1976 Braintree District Council election
Flag of Essex.svg
  1973 6 May 1976 (1976-05-06) 1979  

All 58 seats to Braintree District Council
30 seats needed for a majority
Turnout49.3% (Increase2.svg1.5%)
 First partySecond partyThird party
  No image wide.svg No image wide.svg No image wide.svg
Party Conservative Labour Independent
Last election15 seats, 30.2%22 seats, 39.2%15 seats, 17.6%
Seats won3988
Seat changeIncrease2.svg 24Decrease2.svg 14Decrease2.svg 7
Popular vote33,99824,0716,409
Percentage48.0%34.0%9.0%
SwingIncrease2.svg 17.8%Decrease2.svg 5.2%Decrease2.svg 8.6%

 Fourth partyFifth partySixth party
  No image wide.svg No image wide.svg No image wide.svg
Party Liberal Residents Ind. Conservative
Last election3 seats, 9.8%1 seat, 1.8%2 seats, 0.9%
Seats won111
Seat changeDecrease2.svg 2Steady2.svgDecrease2.svg 1
Popular vote4,3651,7270
Percentage6.2%2.4%0.0%
SwingDecrease2.svg 3.6%Increase2.svg 0.6%Decrease2.svg 0.9%

Council control before election


No overall control

Council control after election


Conservative

The 1976 Braintree District Council election took place on 6 May 1976 to elect members of Braintree District Council in England. [1] This was on the same day as other local elections.

Contents

Summary

Election result

1976 Braintree District Council election
PartySeatsGainsLossesNet gain/lossSeats %Votes %Votes+/−
  Conservative 39Increase2.svg 2467.248.033,998+17.8
  Labour 8Decrease2.svg 1413.834.024,071–5.2
  Independent 8Decrease2.svg 713.89.06,409–8.6
  Liberal 1Decrease2.svg 21.76.24,365–3.6
  Residents 1Steady2.svg1.72.41,727+0.6
  Ind. Conservative 1Decrease2.svg 11.70.00–0.9
  Independent Liberal 0Steady2.svg0.00.2148N/A
  Communist 0Steady2.svg0.00.2144–0.4

Ward results

Black Notley

Black Notley
PartyCandidateVotes%±%
Conservative E. Mills* 369 74.2 +17.2
Labour J. Hall12825.8–4.3
Majority24148.5+21.6
Turnout 49743.0+3.3
Registered electors 1,185
Conservative hold Swing Increase2.svg10.8

No Independent candidate as previous (12.9%).

Bumpstead

Bumpstead
PartyCandidateVotes%±%
Conservative S. Drapkin Unopposed
Registered electors 1,210
Conservative hold

Castle Headingham

Castle Headingham
PartyCandidateVotes%±%
Conservative L. Hipkins 376 45.4 N/A
Labour J. Lynch*30436.7–14.4
Independent Liberal L. Brown14817.9N/A
Majority728.7N/A
Turnout 82865.8+15.8
Registered electors 1,271
Conservative gain from Labour Swing N/A

No Independent candidate as previous (48.9%).

Coggeshall

Coggeshall
PartyCandidateVotes%±%
Conservative D. McMillan 857 48.6 N/A
Conservative B. Smith 814 46.2 N/A
Independent W. Drake* 597 33.9 –1.8
Liberal W. Onions*55331.4–15.3
Labour C. Causton47326.8–1.9
Labour B. Smith45425.8–2.7
Labour D. Simpson38121.6N/A
Liberal D. Sibley33919.2N/A
Turnout 1,76348.0+3.5
Registered electors 3,673
Conservative gain from Independent
Conservative gain from Liberal
Independent hold

Colne Engaine & Greenstead Green

Colne Engaine & Greenstead Green
PartyCandidateVotes%±%
Ind. Conservative G. Courtauld* Unopposed
Registered electors 1,303
Ind. Conservative hold

Cressing

Cressing
PartyCandidateVotes%±%
Conservative E. Yockney 271 49.9 +4.2
Independent A. Allen*15428.4–25.9
Labour M. Hills11821.7N/A
Majority11721.5N/A
Turnout 54346.1+16.3
Registered electors 1,179
Conservative gain from Independent Swing Increase2.svg15.1

Earls Colne

Earls Colne
PartyCandidateVotes%±%
Independent L. Dearsley* 600 51.5 +4.6
Independent P. Taylor* 588 50.5 –2.5
Labour R. Turp27123.3+12.1
Turnout 1,16557.3+6.4
Registered electors 2,033
Independent hold
Independent hold

No Conservative candidate as previous (35.7%).

Gosfield

Gosfield
PartyCandidateVotes%±%
Independent D. Marlow 349 55.9 +7.6
Conservative B. Brooks27544.1N/A
Majority7411.9N/A
Turnout 62460.1+22.1
Registered electors 1,040
Independent gain from Independent Swing N/A

No Independent candidate (Seymour) as previous (51.8%).

Halstead Holy Trinity

Halstead Holy Trinity
PartyCandidateVotes%±%
Labour R. Mayes 765 42.4 –13.6
Labour K. Jones 696 38.6 –10.0
Conservative C. Covell 670 37.1 N/A
Labour N. Bugbee*57231.7–14.9
Residents D. Fuller54930.4N/A
Turnout 1,80552.3+3.1
Registered electors 3,451
Labour hold
Labour hold
Conservative gain from Labour

No Liberal candidate as previous (44.0%).

Halstead St. Andrew's

Halstead St. Andrew's
PartyCandidateVotes%±%
Residents E. McDowell* 684 42.1 +2.7
Conservative O. Joyce* 543 33.4 –2.2
Conservative E. Starling50331.0–1.2
Residents M. Gage49430.4+0.4
Labour A. Bird26516.3–8.6
Labour D. Brede26116.1–8.7
Turnout 1,62555.0–3.6
Registered electors 2,954
Residents hold
Conservative hold

Hatfield Peverel

Hatfield Peverel
PartyCandidateVotes%±%
Conservative C. Leicester* 806 55.1 –1.8
Conservative D. Claydon* 770 52.6 +2.5
Independent M. Voysey56938.9N/A
Labour O. Deane28719.6–23.5
Labour P. Williams23716.2–26.2
Turnout 1,46454.8+11.7
Registered electors 2,671
Conservative hold
Conservative hold

Kelvedon

Kelvedon
PartyCandidateVotes%±%
Independent B. Andrews* 920 54.6 N/A
Conservative M. Edwards 690 40.9 +19.7
Independent J. De Deene Yule* 663 39.3 +1.7
Independent B. Kentish*60636.0+6.1
Conservative A. Howard48829.0–17.7
Conservative D. Openshaw46527.6+7.7
Labour A. Bennett33319.8+4.0
Labour D. Wicks32419.2+3.8
Turnout 1,68555.5+2.4
Registered electors 3,036
Independent hold
Conservative hold
Independent hold

No. 1 (Braintree: East)

No. 1 (Braintree: East)
PartyCandidateVotes%±%
Conservative P. Adams 993 50.5 +22.8
Conservative J. Chapman 967 49.1 +23.9
Conservative J. Haley 953 48.4 +23.3
Conservative D. Platt 946 48.1 +24.8
Labour G. Warren*88444.9+2.2
Labour H. Warren*84442.9+2.5
Labour W. Clarke82742.0+3.6
Labour I. Kerlogue77939.6+2.0
Turnout 1,96838.9–2.1
Registered electors 5,059
Conservative gain from Labour

No Liberal (24.7%) or Communist (5.0%) candidates as previous.

No. 2 (Braintree: West)

No. 2 (Braintree: West)
PartyCandidateVotes%±%
Conservative S. Harper* 1,389 51.1 +16.7
Conservative D. Legg* 1,272 46.8 +16.9
Liberal J. Ross* 1,229 45.2 +3.2
Conservative H. Everitt 1,203 44.2 +17.3
Liberal D. Harvey1,10440.6+4.8
Conservative C. Murcott1,02037.5+14.3
Labour G. Keggen65724.2+0.6
Labour E. Lynch64023.5+4.0
Labour F. Childs56020.6+2.7
Labour M. Skirvington52819.4+2.3
Turnout 2,72055.7–5.9
Registered electors 4,883
Conservative hold
Conservative hold
Liberal hold
Conservative gain from Liberal

No. 3 (Bocking: North)

No. 3 (Bocking: North)
PartyCandidateVotes%±%
Conservative E. Davis 939 50.3 +9.3
Conservative M. Tregaron 935 50.1 +9.2
Conservative A. Cross 903 48.4 +10.1
Labour A. Everard*83144.5–14.6
Labour A. Millam*74640.0–9.5
Labour R. Watson71138.1–15.8
Turnout 1,86749.3+8.4
Registered electors 3,786
Conservative gain from Labour

No. 4 (Bocking: South)

No. 4 (Bocking: South)
PartyCandidateVotes%±%
Conservative A. Comfort 1,298 48.0 +22.0
Conservative R. Perkin 1,238 45.8 +25.2
Conservative R. Davis 1,164 43.0 +23.2
Conservative T. Adcock 1,109 41.0 +21.5
Labour G. Warne*1,09040.3–5.0
Labour J. Perks1,04038.5+2.4
Labour R. Suckling*1,00037.0–1.9
Labour A. Mackenzie*82730.6–2.4
Liberal D. Colchester50318.6–10.1
Liberal B. Meech47917.7–9.4
Turnout 2,70442.9–12.7
Registered electors 6,302
Conservative gain from Labour

No. 7 (Witham: West)

No. 7 (Witham: West)
PartyCandidateVotes%±%
Conservative D. Willetts 935 58.7 +42.0
Conservative M. Lager 888 55.7 +40.2
Labour E. Hatton50031.4+5.7
Labour J. Halton42826.9+2.3
Communist F. Brown1449.0+1.0
Turnout 1,59440.2+1.3
Registered electors 3,966
Conservative gain from Independent

No Independent (38.7%, 33.0%) or Liberal (10.9%) candidates as previous.

No. 8 (Witham: North)

No. 8 (Witham: North)
PartyCandidateVotes%±%
Labour A. Bentley* 688 51.5 +7.4
Labour S. Smith* 668 50.0 +5.5
Conservative E. Quick56342.1+26.1
Conservative F. Mansbridge55241.3+28.8
Turnout 1,33635.4–0.1
Registered electors 3,774
Labour hold
Labour hold

No Independent candidates as previous (26.0%, 13.4%, 12.3%).

No. 9 (Witham: Rivenhall South)

No. 9 (Witham: Rivenhall South)
PartyCandidateVotes%±%
Labour J. Lyon* 655 51.1 +1.4
Labour R. Bartlett* 601 46.8 –7.2
Conservative P. Cutmore56944.3+9.5
Conservative A. Pembroke55943.6–2.4
Turnout 1,28356.9+6.0
Registered electors 2,254
Labour hold
Labour hold

No. 10 (Witham: Rivenhall South)

No. 10 (Witham: Rivenhall South)
PartyCandidateVotes%±%
Conservative K. Richards 325 35.5 N/A
Labour C. Edwards* 305 33.3 +0.1
Labour R. Edwards28631.2–7.5
Turnout 91656.5+14.6
Registered electors 1,621
Conservative gain from Labour
Labour hold

No. 11 (Witham: Central)

No. 11 (Witham: Central)
PartyCandidateVotes%±%
Independent H. Pitchworth* 339 58.1 +11.8
Conservative P. Gibbs20635.3–6.2
Labour D. Oliver386.5+1.3
Majority13322.8+18.0
Turnout 58357.7+4.9
Registered electors 1,013
Independent hold Swing Increase2.svg9.0

No Liberal candidate as previous (7.1%).

No. 12 (Witham: South)

No. 12 (Witham: South)
PartyCandidateVotes%±%
Labour J. Howe* 475 55.5 +0.3
Conservative T. Stead38144.5N/A
Majority9411.0+0.6
Turnout 85648.2+1.6
Registered electors 1,776
Labour hold Swing N/A

No Independent candidate as previous (44.8%).

Panfield

Panfield
PartyCandidateVotes%±%
Conservative R. Chandler* 399 59.3 +6.9
Labour C. Evans27440.7–6.9
Majority12518.6+13.8
Turnout 67359.7+13.6
Registered electors 1,136
Conservative hold Swing Increase2.svg6.9

Rayne

Rayne
PartyCandidateVotes%±%
Conservative C. Crossman 517 65.4 N/A
Liberal F. Little15820.0N/A
Labour K. Locke*11514.6–21.4
Majority35945.4N/A
Turnout 79053.1+12.1
Registered electors 1,491
Conservative gain from Independent Swing N/A

Sible Headingham

Sible Headingham
PartyCandidateVotes%±%
Independent G. Tanner* 787 82.2 +45.7
Conservative H. Hall 719 75.1 +40.3
Labour C. Funnell19820.7–8.0
Labour E. Gray16617.3+2.7
Turnout 95841.2–20.5
Registered electors 2,325
Independent hold
Conservative hold

Stour Valley Central

Stour Valley Central
PartyCandidateVotes%±%
Conservative K. Nott* 431 77.9 +6.5
Labour P. Wallis12222.1–6.5
Majority30955.9+13.0
Turnout 55350.6+3.9
Registered electors 1,095
Conservative hold Swing Increase2.svg6.5

Stour Valley North

Stour Valley North
PartyCandidateVotes%±%
Conservative C. Basham Unopposed
Registered electors 1,051
Conservative gain from Independent

Stour Valley South

Stour Valley South
PartyCandidateVotes%±%
Conservative R. Clark 506 68.1 +20.2
Independent A. Champion23731.9N/A
Majority26936.2+35.8
Turnout 74351.8–1.4
Registered electors 1,434
Conservative hold Swing N/A

No Independent (Nott, 47.5%) or Labour (4.5%) candidates as previous.

Terling

Terling
PartyCandidateVotes%±%
Conservative G. Isted* 425 78.0 +13.5
Labour C. Foy12022.0–13.5
Majority30556.0+26.9
Turnout 54544.1–1.1
Registered electors 1,239
Conservative hold Swing Increase2.svg13.5

Three Fields

Three Fields
PartyCandidateVotes%±%
Conservative R. Hawkins* 941 63.4 +24.0
Conservative O. Montefiore* 856 57.7 +25.9
Labour G. Hildrey59940.4+11.3
Turnout 1,48460.0+13.6
Registered electors 2,473
Conservative hold
Conservative hold

No Independent candidates as previous (31.5%, 30.5%, 20.6%, 14.4%).

Upper Colne

Upper Colne
PartyCandidateVotes%±%
Conservative D. Johnson* Unopposed
Registered electors 1,223
Conservative hold

Yeldham

Yeldham
PartyCandidateVotes%±%
Conservative R. Liming Unopposed
Registered electors 1,228
Conservative gain from Ind. Conservative

Related Research Articles

<span class="mw-page-title-main">Etobicoke—Lakeshore</span> Federal electoral district in Ontario, Canada

Etobicoke—Lakeshore is a federal electoral district in Ontario, Canada, that has been represented in the House of Commons of Canada since 1968.

Braintree District Council in Essex, England is elected every four years. Since the last comprehensive boundary changes in 2015, 49 councillors have been elected from 26 wards.

Thanet District Council elections are held every four years to elect Thanet District Council in Kent, England. Since the last boundary changes in 2003 the council has comprised 56 councillors representing 23 wards.

The first ever Guildford Borough Council full-council elections were held on 7 June 1973. The Conservatives won control of the council with a majority of 16, winning 29 of the 42 seats.

<span class="mw-page-title-main">2004 Colchester Borough Council election</span>

The 2004 Colchester Borough Council election took place on 10 June 2004 to elect members of Colchester Borough Council in Essex, England. This was the same day as the other 2004 United Kingdom local elections and as the 2004 European Parliament Elections. One third of the seats were up for election and the council stayed under no overall control.

An election to Essex County Council took place on 7 June 2001 as part of the 2001 United Kingdom local elections. 79 councillors were elected from various electoral divisions, which returned either one or two county councillors each by first-past-the-post voting for a four-year term of office. The electoral divisions were the same as those used at the previous election in 1997.
<span class="mw-page-title-main">2015 Braintree District Council election</span> Local election held in the United Kingdom

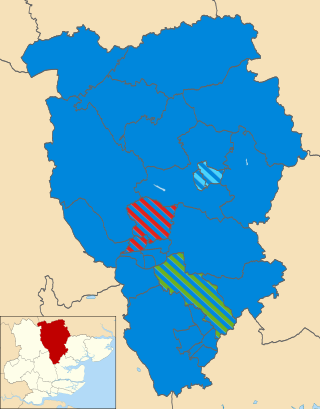
The 2015 Braintree District Council election was scheduled to take place on 7 May 2015 to elect members of Braintree District Council in England. This was on the same day as other local elections.

<span class="mw-page-title-main">2011 West Oxfordshire District Council election</span>

The 2011 West Oxfordshire District Council election took place on 5 May 2011 to elect members of West Oxfordshire District Council in Oxfordshire, England. One third of the council was up for election and the Conservative Party stayed in overall control of the council.

The 1999 Richmondshire District Council election took place on 6 May 1999 to elect members of Richmondshire District Council in North Yorkshire, England. The whole council was up for election and independents lost overall control of the council to no overall control.

<span class="mw-page-title-main">2018 City of Bradford Metropolitan District Council election</span>

The 2018 City of Bradford Metropolitan District Council took place on 3 May 2018 to elect members of Bradford District Council in England. This was on the same day as other local elections. One councillor was elected in each ward for a four-year term so the councillors elected in 2018 last stood for election in 2014. Each ward is represented by three councillors, the election of which is staggered, so only one third of the councillors were elected in this election. Before the election there was a Labour majority and afterwards Labour had increased their majority.
<span class="mw-page-title-main">2018 Southend-on-Sea Borough Council election</span>

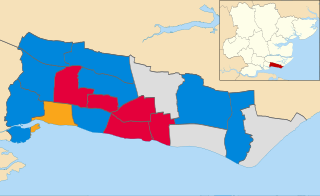
Elections to Southend-on-Sea Borough Council took place on 3 May 2018. This was on the same day as other local elections across the United Kingdom.

The 2018 Rochford District Council election took place on 3 May 2018 to elect members of Rochford District Council in England. This was on the same day as other local elections.

<span class="mw-page-title-main">2019 Braintree District Council election</span> Local election in the United Kingdom

The 2019 Braintree District Council election took place on 2 May 2019 to elect members of Braintree District Council in England. This was on the same day as other local elections.
<span class="mw-page-title-main">1999 Braintree District Council election</span>

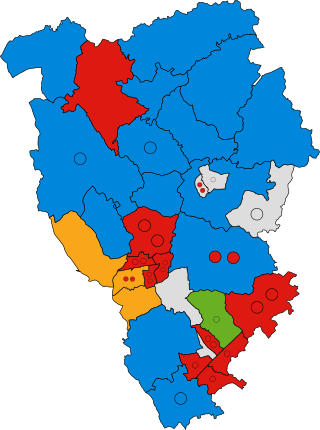
The 1999 Braintree District Council election took place on 6 May 1999 to elect members of Braintree District Council in England. This was on the same day as other local elections.

The 2003 Braintree District Council election took place on 1 May 2003 to elect members of Braintree District Council in England. This was on the same day as other local elections.

<span class="mw-page-title-main">2022 Colchester Borough Council election</span>

Elections to Colchester Borough Council took place on 5 May 2022. Eighteen members of the council were elected: one from 16 of the 17 wards, and two councillors from New Town & Christ Church ward, following the death of incumbent councillor Nick Cope, elected in 2019 and due to serve until 2023.
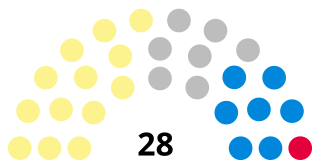
<span class="mw-page-title-main">2022 Angus Council election</span> Angus Council election

Elections to Angus Council took place on 5 May 2022, the same day as the 31 other Scottish local government elections. As with other Scottish council elections, it was held using single transferable vote (STV) – a form of proportional representation – in which multiple candidates are elected in each ward and voters rank candidates in order of preference.
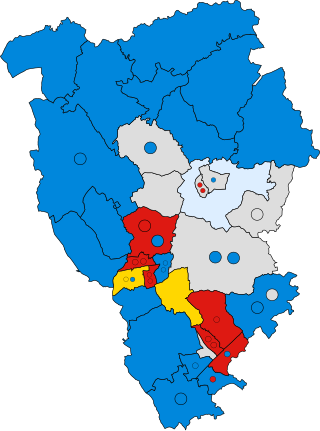
<span class="mw-page-title-main">1979 Braintree District Council election</span> English election

The 1979 Braintree District Council election took place on 3 May 1979 to elect members of Braintree District Council in England. This was on the same day as the 1979 UK general election and other local elections across the United Kingdom.
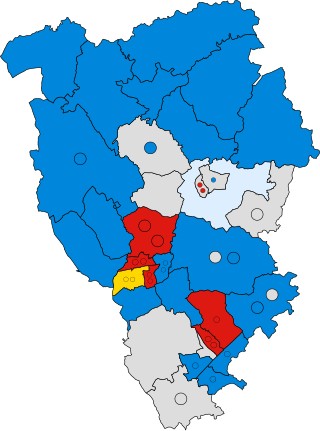
<span class="mw-page-title-main">1983 Braintree District Council election</span> Braintree District Council election

The 1983 Braintree District Council election took place on 5 May 1983 to elect members of Braintree District Council in England. This was on the same day as other local elections.

References

  1. "Braintree District Council Election Results 1973 to 2011" (PDF). Colin Rallings and Michael Thrasher. www.electionscentre.co.uk. Retrieved 30 December 2022.