This article relies largely or entirely on a single source .(July 2021) |
| |||||||||||||||||||||||||||||||||||||||||||||||||||||||||||
All 56 seats to Chelmsford Borough Council 29 seats needed for a majority | |||||||||||||||||||||||||||||||||||||||||||||||||||||||||||
---|---|---|---|---|---|---|---|---|---|---|---|---|---|---|---|---|---|---|---|---|---|---|---|---|---|---|---|---|---|---|---|---|---|---|---|---|---|---|---|---|---|---|---|---|---|---|---|---|---|---|---|---|---|---|---|---|---|---|---|
|
The 1995 Chelmsford Borough Council election took place on 4 May 1995 to elect members of Chelmsford Borough Council in England. This was on the same day as other local elections.
Party | Seats | Gains | Losses | Net gain/loss | Seats % | Votes % | Votes | +/− | |
---|---|---|---|---|---|---|---|---|---|
Liberal Democrats | 32 | 16 | 5 | 11 | 57.1 | 40.9 | 43,751 | +3.3 | |
Conservative | 13 | 2 | 17 | 15 | 23.2 | 28.5 | 30,441 | -14.0 | |
Labour | 7 | 5 | 0 | 5 | 12.5 | 26.6 | 28,470 | +11.7 | |
Independent | 4 | 1 | 2 | 1 | 7.1 | 3.5 | 3,774 | -0.4 | |
Green | 0 | 0 | 0 | 0.0 | 0.5 | 515 | +0.3 | ||
Party | Candidate | Votes | % | ±% | |
---|---|---|---|---|---|
Labour | W. Horslen | 1,014 | 62.9 | +18.7 | |
Labour | A. Longden | 958 | 59.4 | +18.0 | |
Liberal Democrats | L. Foster | 311 | 19.3 | -10.6 | |
Liberal Democrats | I. Gale | 286 | 17.7 | -12.2 | |
Conservative | C. Hodges | 234 | 14.5 | -6.3 | |
Conservative | C. Lee | 225 | 14.0 | -7.1 | |
Turnout | 1,612 | 40.1 | -6.4 | ||
Labour hold | |||||
Labour hold | |||||
Party | Candidate | Votes | % | ±% | |
---|---|---|---|---|---|
Liberal Democrats | C. Davies | 1,430 | 54.6 | +3.6 | |
Liberal Democrats | C. Rackham | 1,305 | 49.8 | +3.5 | |
Liberal Democrats | T. Miller | 1,270 | 48.5 | -3.8 | |
Conservative | J. Chandler | 614 | 23.4 | -12.3 | |
Conservative | M. Knowles | 587 | 22.4 | -12.4 | |
Labour | L. Hobbs | 567 | 21.6 | +11.4 | |
Conservative | P. Start | 551 | 21.0 | -13.4 | |
Labour | O. Ephraim | 544 | 20.8 | +10.1 | |
Labour | D. Shinn | 527 | 20.1 | +9.9 | |
Turnout | 2,621 | 43.6 | -9.5 | ||
Liberal Democrats hold | |||||
Party | Candidate | Votes | % | ±% | |
---|---|---|---|---|---|
Liberal Democrats | M. Dilloway | 687 | 65.6 | +6.1 | |
Labour | F. Lucking | 178 | 17.0 | +9.6 | |
Conservative | P. Thorne | 157 | 15.0 | -9.8 | |
Green | E. Burgess | 26 | 2.5 | -5.8 | |
Majority | 509 | 48.6 | +13.9 | ||
Turnout | 1,048 | 40.7 | -10.1 | ||
Liberal Democrats hold | Swing | 1.8 | |||
Party | Candidate | Votes | % | ±% | |
---|---|---|---|---|---|
Independent | D. Ashford | 1,049 | 51.6 | +7.4 | |
Liberal Democrats | G. Pooley | 710 | 35.0 | +11.6 | |
Conservative | C. Cole | 620 | 30.5 | -6.9 | |
Labour | H. Chad | 486 | 23.9 | +8.8 | |
Labour | R. Quinton | 420 | 20.7 | +10.4 | |
Green | A. Thomson | 160 | 7.9 | N/A | |
Turnout | 2,031 | 39.1 | -9.3 | ||
Independent hold | |||||
Liberal Democrats gain from Conservative |
Party | Candidate | Votes | % | ±% | |
---|---|---|---|---|---|
Liberal Democrats | M. Bracken | 973 | 47.6 | +7.7 | |
Liberal Democrats | B. Gammie | 965 | 47.3 | +7.8 | |
Conservative | J. Candler | 637 | 31.2 | -11.1 | |
Conservative | J. Melville | 600 | 29.4 | -10.6 | |
Labour | S. Horslen | 402 | 19.7 | +6.0 | |
Labour | R. Kennedy | 396 | 19.4 | +6.1 | |
Turnout | 2,042 | 47.4 | -2.0 | ||
Liberal Democrats gain from Conservative | |||||
Liberal Democrats gain from Conservative |
Party | Candidate | Votes | % | ±% | |
---|---|---|---|---|---|
Liberal Democrats | P. Evans | 476 | 50.9 | +14.7 | |
Conservative | B. Cooper | 295 | 31.5 | -13.4 | |
Labour | M. Bloomer | 165 | 17.6 | -1.4 | |
Majority | 181 | 19.3 | — | ||
Turnout | 936 | 48.4 | -12.4 | ||
Liberal Democrats gain from Conservative | Swing | 14.1 | |||
Party | Candidate | Votes | % | ±% | |
---|---|---|---|---|---|
Independent | A. Dixon | 528 | 70.0 | +18.8 | |
Labour | J. Spurgeon | 226 | 30.0 | +14.5 | |
Majority | 302 | 40.0 | +22.0 | ||
Turnout | 754 | 42.8 | -12.1 | ||
Independent hold | Swing | 2.2 | |||
Party | Candidate | Votes | % | ±% | |
---|---|---|---|---|---|
Conservative | J. Potter | 672 | 35.4 | -10.7 | |
Conservative | R. Thorne | 665 | 35.1 | -10.7 | |
Labour | M. Briault | 628 | 33.1 | +14.1 | |
Labour | A. Final | 595 | 31.4 | +15.5 | |
Liberal Democrats | J. Clarke | 568 | 30.0 | -3.1 | |
Liberal Democrats | J. Hutchon | 426 | 22.5 | N/A | |
Turnout | 1,896 | 41.2 | -1.3 | ||
Conservative hold | |||||
Party | Candidate | Votes | % | ±% | |
---|---|---|---|---|---|
Liberal Democrats | G. Allen | 1,205 | 65.7 | +21.9 | |
Liberal Democrats | F. Mountain | 1,042 | 56.8 | +10.6 | |
Conservative | V. Makin | 409 | 22.3 | -21.0 | |
Conservative | D. Lee | 401 | 21.9 | -20.5 | |
Labour | J. Bliss | 313 | 17.1 | +9.0 | |
Labour | S. O'Brien | 265 | 14.4 | +5.3 | |
Turnout | 1,835 | 41.1 | -11.8 | ||
Liberal Democrats hold | |||||
Party | Candidate | Votes | % | ±% | |
---|---|---|---|---|---|
Conservative | A. Willsher | 551 | 55.7 | -12.9 | |
Labour | J. Burrow | 269 | 27.2 | +14.7 | |
Liberal Democrats | M. Noble | 169 | 17.1 | -1.8 | |
Majority | 282 | 28.5 | -21.2 | ||
Turnout | 989 | 43.3 | -6.5 | ||
Conservative hold | Swing | 13.8 | |||
Party | Candidate | Votes | % | ±% | |
---|---|---|---|---|---|
Conservative | C. Kingsley | 1,240 | 43.7 | -10.0 | |
Conservative | M. Hurrell | 1,218 | 42.9 | -11.2 | |
Conservative | M. Holoway | 1,183 | 41.7 | N/A | |
Independent | J. Bacon | 862 | 30.4 | -12.2 | |
Liberal Democrats | M. Staines | 790 | 27.8 | +5.5 | |
Liberal Democrats | L. O'Brien | 780 | 27.5 | +6.5 | |
Liberal Democrats | D. Whiteing | 754 | 26.6 | +5.0 | |
Labour | W. Jardine | 310 | 10.9 | +5.6 | |
Labour | L. Cawston | 300 | 10.6 | +5.0 | |
Labour | D. Newton | 243 | 8.6 | +4.0 | |
Green | C. Budgey | 241 | 8.5 | N/A | |
Turnout | 2,839 | 44.3 | -7.3 | ||
Conservative hold | |||||
Conservative gain from Independent |
Party | Candidate | Votes | % | ±% | |
---|---|---|---|---|---|
Conservative | I. Clenaghan | 655 | 59.1 | -13.0 | |
Liberal Democrats | J. Braithwaite | 271 | 24.4 | +10.3 | |
Labour | R. Jones | 183 | 16.5 | +2.7 | |
Majority | 384 | 34.7 | -23.3 | ||
Turnout | 1,109 | 46.6 | -3.2 | ||
Conservative hold | Swing | 11.7 | |||
Party | Candidate | Votes | % | ±% | |
---|---|---|---|---|---|
Liberal Democrats | D. Jones | 1,128 | 62.5 | +13.0 | |
Liberal Democrats | C. Stephenson | 1,085 | 60.1 | +2.7 | |
Labour | D. Hopgood | 384 | 21.3 | +7.6 | |
Labour | Y. Cleary | 375 | 20.8 | +9.5 | |
Conservative | D. Cruickshank | 331 | 18.3 | -9.8 | |
Conservative | S. Cruickshank | 314 | 17.4 | -9.6 | |
Turnout | 1,806 | 44.6 | -5.2 | ||
Liberal Democrats hold | |||||
Party | Candidate | Votes | % | ±% | |
---|---|---|---|---|---|
Liberal Democrats | W. Hale | 980 | 39.0 | +4.1 | |
Liberal Democrats | K. Francis | 960 | 38.2 | +2.5 | |
Liberal Democrats | V. Sadowsky | 959 | 38.1 | +5.7 | |
Conservative | C. Cave | 740 | 29.4 | -19.0 | |
Conservative | Y. Miller | 688 | 27.3 | -16.2 | |
Labour | R. Cawston | 679 | 27.0 | +11.9 | |
Labour | A. Scammell | 651 | 25.9 | +12.2 | |
Conservative | D. Stevenson | 634 | 25.2 | -15.5 | |
Labour | M. Pearson | 608 | 24.2 | +9.4 | |
Independent | S. Stratton | 170 | 6.8 | N/A | |
Turnout | 2,516 | 44.5 | -5.5 | ||
Liberal Democrats gain from Conservative | |||||
Liberal Democrats gain from Conservative |
Party | Candidate | Votes | % | ±% | |
---|---|---|---|---|---|
Liberal Democrats | R. Monk | 1,188 | 48.8 | +7.0 | |
Liberal Democrats | C. Barrett | 1,165 | 47.8 | +4.7 | |
Liberal Democrats | A. Johnston | 1,148 | 47.1 | +7.5 | |
Labour | R. Essery | 595 | 24.4 | +10.7 | |
Conservative | A. Lewis | 583 | 23.9 | -15.0 | |
Conservative | D. Kimberlin | 570 | 23.4 | -14.1 | |
Labour | D. Howell | 568 | 23.3 | +11.2 | |
Conservative | C. Wickers | 528 | 21.7 | -15.5 | |
Labour | P. Bennett | 519 | 21.3 | +9.5 | |
Turnout | 2,435 | 42.6 | -8.8 | ||
Liberal Democrats hold | |||||
Party | Candidate | Votes | % | ±% | |
---|---|---|---|---|---|
Conservative | E. Mickelborough | 588 | 40.8 | N/A | |
Independent | E. Roberts | 526 | 36.5 | N/A | |
Labour | R. Patterson | 420 | 29.1 | N/A | |
Labour | T. Mahon | 414 | 28.7 | N/A | |
Liberal Democrats | N. Sutcliffe | 294 | 20.4 | N/A | |
Turnout | 1,441 | 36.0 | N/A | ||
Conservative hold | |||||
Independent hold | |||||
Party | Candidate | Votes | % | ±% | |
---|---|---|---|---|---|
Liberal Democrats | M. Hutchon | 816 | 47.4 | +0.2 | |
Liberal Democrats | F. Page | 810 | 47.0 | ±0.0 | |
Labour | B. Rudkin | 481 | 27.9 | +14.7 | |
Labour | A. Wilson | 471 | 27.3 | +14.4 | |
Conservative | E. Alliston | 392 | 22.8 | -14.3 | |
Conservative | I. Day | 340 | 19.7 | -17.0 | |
Turnout | 1,723 | 39.6 | -4.1 | ||
Liberal Democrats hold | |||||
Party | Candidate | Votes | % | ±% | |
---|---|---|---|---|---|
Conservative | J. Norton | 429 | 59.7 | N/A | |
Labour | M. Viney | 195 | 27.2 | N/A | |
Liberal Democrats | V. Davies | 94 | 13.1 | N/A | |
Majority | 234 | 32.5 | N/A | ||
Turnout | 718 | 39.8 | N/A | ||
Conservative gain from Independent | Swing | ||||
Party | Candidate | Votes | % | ±% | |
---|---|---|---|---|---|
Conservative | J. Allen | 839 | 51.7 | -13.1 | |
Conservative | M. Moulds | 721 | 44.4 | -18.2 | |
Conservative | C. Stephenson | 717 | 44.2 | -19.1 | |
Labour | R. Davis | 453 | 27.9 | N/A | |
Liberal Democrats | S. King | 447 | 27.5 | -0.5 | |
Liberal Democrats | P. Broad | 432 | 26.6 | -0.9 | |
Labour | M. Hoy | 409 | 25.2 | N/A | |
Labour | I. Potter | 400 | 24.6 | N/A | |
Liberal Democrats | D. Sykes | 391 | 24.1 | -1.4 | |
Turnout | 1,623 | 28.1 | -13.2 | ||
Conservative hold | |||||
Party | Candidate | Votes | % | ±% | |
---|---|---|---|---|---|
Independent | P. Martin | 639 | 34.7 | +2.7 | |
Liberal Democrats | I. Roberts | 626 | 34.0 | +5.8 | |
Liberal Democrats | J. Goldfinch | 599 | 32.6 | +4.9 | |
Liberal Democrats | J. Deakin | 569 | 30.9 | +10.0 | |
Conservative | L. Denston | 528 | 28.7 | -19.2 | |
Labour | J. Barnett | 492 | 26.7 | +14.7 | |
Conservative | J. Theobold | 478 | 26.0 | -16.4 | |
Conservative | B. Pead | 430 | 23.4 | -19.0 | |
Labour | A. Hilton | 382 | 20.8 | +9.4 | |
Labour | W. Shaw | 361 | 19.6 | +8.9 | |
Turnout | 1,840 | 29.8 | -9.7 | ||
Independent gain from Conservative | |||||
Liberal Democrats gain from Conservative | |||||
Liberal Democrats gain from Conservative |
Party | Candidate | Votes | % | ±% | |
---|---|---|---|---|---|
Liberal Democrats | W. Lane | 1,295 | 60.1 | +19.0 | |
Liberal Democrats | S. Linger | 1,201 | 55.7 | +13.1 | |
Liberal Democrats | M. Mackroy | 1,174 | 54.5 | +17.4 | |
Conservative | D. Hepworth | 716 | 33.2 | -9.7 | |
Conservative | S. Poyser | 649 | 30.1 | -10.8 | |
Conservative | A. Tween | 649 | 30.1 | -10.6 | |
Labour | M. Horslen | 560 | 26.0 | +13.6 | |
Labour | S. Haigh | 559 | 25.9 | +13.0 | |
Labour | L. Pearson | 524 | 24.3 | +13.5 | |
Independent | R. Parker | 74 | 3.4 | N/A | |
Turnout | 2,156 | 32.4 | -13.1 | ||
Liberal Democrats gain from Conservative | |||||
Liberal Democrats hold | |||||
Party | Candidate | Votes | % | ±% | |
---|---|---|---|---|---|
Liberal Democrats | R. Webb | 820 | 44.9 | +9.3 | |
Liberal Democrats | R. Webb | 819 | 44.9 | +7.9 | |
Liberal Democrats | A. Lee | 798 | 43.7 | N/A | |
Conservative | D. Lumley | 555 | 30.4 | -22.8 | |
Conservative | F. Vella | 508 | 27.8 | -19.4 | |
Conservative | M. Hurley | 495 | 27.1 | -19.1 | |
Labour | M. Dyer | 375 | 20.5 | +10.4 | |
Labour | C. Dyer | 354 | 19.4 | +7.2 | |
Labour | S. Emmerson | 333 | 18.2 | +8.9 | |
Green | L. Burnett | 88 | 4.8 | N/A | |
Turnout | 1,826 | 34.5 | -7.0 | ||
Liberal Democrats gain from Conservative | |||||
Liberal Democrats gain from Conservative |
Party | Candidate | Votes | % | ±% | |
---|---|---|---|---|---|
Labour | R. Chad | 1,501 | 42.0 | +12.4 | |
Labour | E. Baldwin | 1,393 | 39.0 | +11.3 | |
Labour | J. Devane | 1,301 | 36.4 | +9.8 | |
Liberal Democrats | C. Young | 1,196 | 33.4 | -8.9 | |
Liberal Democrats | K. Hay | 1,146 | 32.0 | -8.3 | |
Liberal Democrats | D. Edgson-Smith | 1,130 | 31.6 | -8.5 | |
Conservative | K. Carr | 662 | 18.5 | -7.1 | |
Conservative | K. Pauley | 639 | 17.9 | -7.1 | |
Conservative | R. Paddon | 619 | 17.3 | -6.9 | |
Turnout | 3,576 | 53.3 | ±0.0 | ||
Labour gain from Liberal Democrats | |||||
Labour gain from Liberal Democrats |
Party | Candidate | Votes | % | ±% | |
---|---|---|---|---|---|
Liberal Democrats | P. Harvey | 1,398 | 54.8 | +7.7 | |
Liberal Democrats | A. Hall | 1,255 | 49.2 | +6.1 | |
Conservative | R. Alcock | 882 | 34.6 | -11.1 | |
Conservative | A. Glunn | 781 | 30.6 | -10.4 | |
Labour | J. McLean | 328 | 12.9 | +5.2 | |
Labour | D. Selby | 289 | 11.3 | +3.7 | |
Turnout | 2,551 | 53.4 | -5.1 | ||
Liberal Democrats hold | |||||
Liberal Democrats gain from Conservative |
Party | Candidate | Votes | % | ±% | |
---|---|---|---|---|---|
Labour | N. Spurgeon | 912 | 39.4 | +12.2 | |
Labour | J. McGreevy | 900 | 38.9 | +12.9 | |
Liberal Democrats | J. Hunnable | 895 | 38.7 | -1.8 | |
Liberal Democrats | J. Thackray | 887 | 38.3 | -1.8 | |
Conservative | A. Blevins | 390 | 16.9 | -10.9 | |
Conservative | M. Fuller | 386 | 16.7 | -10.5 | |
Turnout | 2,314 | 50.1 | -0.1 | ||
Labour gain from Liberal Democrats | |||||
Labour gain from Liberal Democrats |
Party | Candidate | Votes | % | ±% | |
---|---|---|---|---|---|
Conservative | R. Grimwood | 411 | 45.9 | -19.3 | |
Liberal Democrats | R. Phillips | 311 | 34.7 | -0.1 | |
Labour | G. Shearwood | 174 | 19.4 | N/A | |
Majority | 100 | 11.2 | -19.2 | ||
Turnout | 894 | 37.2 | -5.1 | ||
Conservative hold | Swing | 9.6 | |||
Party | Candidate | Votes | % | ±% | |
---|---|---|---|---|---|
Liberal Democrats | M. Sinclair | 738 | 35.4 | +14.8 | |
Liberal Democrats | T. Willis | 673 | 32.3 | +16.2 | |
Labour | B. Grainger | 661 | 31.7 | +12.5 | |
Labour | P. Blackwood | 655 | 31.5 | +12.7 | |
Conservative | A. Sach | 604 | 29.0 | -23.1 | |
Conservative | P. Hutchinson | 560 | 26.9 | -23.9 | |
Turnout | 2,082 | 46.9 | -1.9 | ||
Liberal Democrats gain from Conservative | |||||
Liberal Democrats gain from Conservative |
The Borough of Basildon is a local government district with borough status in Essex, England. It is named after its largest town, Basildon, where the council is based. The borough also includes the towns of Billericay and Wickford and surrounding rural areas.
The City of Chelmsford is a local government district with borough and city status in Essex, England. It is named after its main settlement, Chelmsford, which is also the county town of Essex. As well as the settlement of Chelmsford itself, the district also includes the surrounding rural area and the town of South Woodham Ferrers.
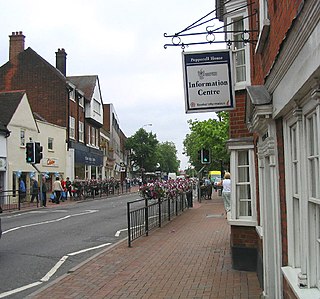
The Borough of Brentwood is a local government district with borough status in Essex, England. The borough is named after its main town of Brentwood, where the council is based; it includes several villages and the surrounding rural area.
Maldon and East Chelmsford was a parliamentary constituency represented in the House of Commons of the Parliament of the United Kingdom. From 1997 to 2010 it elected one Member of Parliament (MP) by the first past the post system of election.
Braintree is a constituency in Essex represented in the House of Commons of the UK Parliament since 2015 by James Cleverly, a member of the Conservative Party.
West Chelmsford was a parliamentary constituency represented in the House of Commons of the Parliament of the United Kingdom. From 1997 to 2010 it elected one Member of Parliament (MP) by the first past the post system of election.
Saffron Walden is a constituency in Essex, represented in the House of Commons of the UK Parliament since 2017 by Kemi Badenoch, a Conservative.
East Ham was a local government district in the far south west of Essex from 1878 to 1965. It extended from Wanstead Flats in the north to the River Thames in the south and from Green Street in the west to Barking Creek in the east. It was part of the London postal district and Metropolitan Police District.
Chelmsford is a constituency in Essex represented in the House of Commons of the UK Parliament since 2017 by Vicky Ford of the Conservative Party.
Chelmsford City Council in Essex, England is elected every four years. Since the last boundary changes in 2003 the council has comprised 57 councillors elected from 24 wards.
Maldon is a constituency in Essex represented in the House of Commons of the UK Parliament since its recreation in 2010 by Sir John Whittingdale, a Conservative.
Essex County Council is the county council that governs the non-metropolitan county of Essex in England. It has 75 councillors, elected from 70 divisions, and has been under Conservative majority control since 2001. The council meets at County Hall in the centre of Chelmsford. It is a member of the East of England Local Government Association.
Rettendon is a small village and civil parish in the Borough of Chelmsford in Essex, England, about 8 miles (13 km) south east of the city of Chelmsford. Situated near the River Crouch, the village was once owned by the Bishop of Ely. The A130 formerly passed through the village. There are a number of listed buildings in the parish.
The 2011 Basildon Council election took place on 5 May 2011 to elect members of Basildon Borough Council in Essex, England. One third of the council was up for election and the Conservative party stayed in overall control of the council.
Elections to Chelmsford Borough Council were held in 2011 alongside local elections in other parts of the United Kingdom.
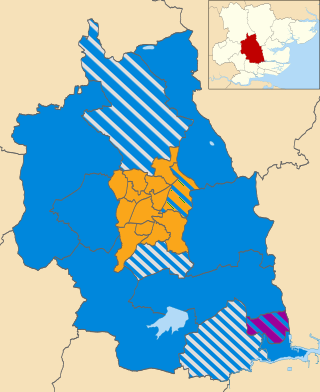
The 2019 Chelmsford City Council election took place on 2 May 2019 to elect members of Chelmsford City Council in England. This was on the same day as other local elections.
The 1991 Chelmsford Borough Council election took place on 2 May 1991 to elect members of Chelmsford Borough Council in England. This was on the same day as other local elections.
The 1999 Chelmsford Borough Council election took place on 6 May 1999 to elect members of Chelmsford Borough Council in England. This was on the same day as other local elections.
The 2003 Chelmsford Borough Council election took place on 1 May 2003 to elect members of Chelmsford Borough Council in England. This was on the same day as other local elections.
The 2007 Chelmsford Borough Council election took place on 3 May 2007 to elect members of Chelmsford Borough Council in England. This was on the same day as other local elections.