| ||||||||||||||||||||||||||||||||||||||||||||||||||||||||||||||||||||
12 of the 33 seats to Harlow District Council 17 seats needed for a majority | ||||||||||||||||||||||||||||||||||||||||||||||||||||||||||||||||||||
---|---|---|---|---|---|---|---|---|---|---|---|---|---|---|---|---|---|---|---|---|---|---|---|---|---|---|---|---|---|---|---|---|---|---|---|---|---|---|---|---|---|---|---|---|---|---|---|---|---|---|---|---|---|---|---|---|---|---|---|---|---|---|---|---|---|---|---|---|
| ||||||||||||||||||||||||||||||||||||||||||||||||||||||||||||||||||||
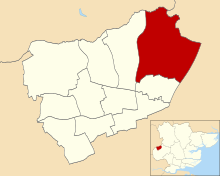
Map showing the results of contested wards in the 2007 Harlow District Council elections. | ||||||||||||||||||||||||||||||||||||||||||||||||||||||||||||||||||||
|
The 2007 Harlow District Council election took place on 3 May 2007 to elect members of Harlow District Council in Essex, England. One third of the council was up for election and the council stayed under no overall control. [1]
After the election, the composition of the council was
After the last election in 2006 the Conservatives had 12 seats, Labour 11 and the Liberal Democrats 10. [3] However, in January 2007 John Goddard left the Conservative group to sit as an independent, [4] [5] meaning that going into the 2007 election both the Conservative and Labour parties had 11 councillors. [6]
12 seats were contested at the election, with 2 seats being available in Church Langley ward after Sam Warren stood down from the council. [7]
The Liberal Democrats lost 2 seats to fall to 8 councillors, 1 each to the Conservative and Labour parties, who both finished with 12 councillors. [7] The closest result came in Toddbrook ward where Labour held the seat with a 15-vote majority over the Conservatives, while both the Conservative and Liberal Democrat group leaders, Andrew Johnson and Chris Millington won seats in Church Langley and Bush Fair wards respectively. [7] Overall turnout at the election was 34.75%, down from 36.93% in 2006. [8]
Following the election a coalition between Labour and the Liberal Democrats continued to run the council. [7] [9]
Party | Seats | Gains | Losses | Net gain/loss | Seats % | Votes % | Votes | +/− | |
---|---|---|---|---|---|---|---|---|---|
Conservative | 6 | 1 | 0 | 1 | 50.0 | 45.8 | 9,876 | 5.6 | |
Labour | 4 | 1 | 0 | 1 | 33.3 | 31.9 | 6,876 | 0.2 | |
Liberal Democrats | 2 | 0 | 2 | 2 | 16.7 | 20.2 | 4,362 | 5.6 | |
Respect | 0 | 0 | 0 | 0 | 1.2 | 250 | 0.2 | ||
Independent | 0 | 0 | 0 | 0 | 0.9 | 204 | 0.1 |
Party | Candidate | Votes | % | ±% | |
---|---|---|---|---|---|
Liberal Democrats | Christopher Millington | 855 | 41.4 | -7.3 | |
Labour | Terry Brandon | 796 | 38.5 | +4.6 | |
Conservative | Shona Johnson | 414 | 20.0 | +2.5 | |
Majority | 59 | 2.9 | -11.9 | ||
Turnout | 2,065 | 36.5 | -2.6 | ||
Liberal Democrats hold | Swing | ||||
Party | Candidate | Votes | % | ±% | |
---|---|---|---|---|---|
Conservative | Andrew Johnson | 1,266 | |||
Conservative | Tony Hall | 1,135 | |||
Labour | Kenneth Lawrie | 287 | |||
Liberal Democrats | Laura Rideout | 196 | |||
Liberal Democrats | James Rideout | 183 | |||
Turnout | 3,067 | 27.9 | -4.1 | ||
Conservative hold | Swing | ||||
Party | Candidate | Votes | % | ±% | |
---|---|---|---|---|---|
Conservative | Patrick McClarnon | 1,011 | 55.1 | +4.0 | |
Labour | Norman Knight | 617 | 33.6 | +1.2 | |
Liberal Democrats | Ian Rideout | 208 | 11.3 | -5.2 | |
Majority | 394 | 21.5 | +2.8 | ||
Turnout | 1,836 | 36.1 | -2.5 | ||
Conservative hold | Swing | ||||
Party | Candidate | Votes | % | ±% | |
---|---|---|---|---|---|
Labour | Mark Wilkinson | 909 | 45.0 | +4.8 | |
Conservative | Clive Souter | 879 | 43.5 | +7.6 | |
Liberal Democrats | Alan Lawrence | 234 | 11.6 | -1.5 | |
Majority | 30 | 1.5 | -2.8 | ||
Turnout | 2,022 | 37.6 | -0.8 | ||
Labour hold | Swing | ||||
Party | Candidate | Votes | % | ±% | |
---|---|---|---|---|---|
Labour | Jean Clark | 881 | 49.2 | +6.0 | |
Conservative | Russell Perrin | 700 | 39.1 | +3.5 | |
Liberal Democrats | Robert Pailing | 211 | 11.8 | -9.4 | |
Majority | 181 | 10.1 | +2.5 | ||
Turnout | 1,792 | 34.0 | -1.5 | ||
Labour hold | Swing | ||||
Party | Candidate | Votes | % | ±% | |
---|---|---|---|---|---|
Liberal Democrats | Lesley Rideout | 752 | 36.5 | -0.5 | |
Labour | Michael Danvers | 740 | 35.9 | +0.2 | |
Conservative | Jane Steer | 570 | 27.6 | +0.3 | |
Majority | 12 | 0.6 | -0.7 | ||
Turnout | 2,062 | 41.1 | -2.6 | ||
Liberal Democrats hold | Swing | ||||
Party | Candidate | Votes | % | ±% | |
---|---|---|---|---|---|
Labour | Edna Stevens | 642 | 34.7 | +2.8 | |
Conservative | Mark Gough | 613 | 33.2 | +7.4 | |
Liberal Democrats | Jim Pailing | 594 | 32.1 | -10.2 | |
Majority | 29 | 1.5 | |||
Turnout | 1,849 | 34.9 | -0.6 | ||
Labour gain from Liberal Democrats | Swing | ||||
Party | Candidate | Votes | % | ±% | |
---|---|---|---|---|---|
Conservative | Sue Livings | 976 | 54.5 | -2.0 | |
Labour | John Childs | 398 | 22.2 | -3.9 | |
Liberal Democrats | Nick Macy | 214 | 11.9 | -5.5 | |
Independent | Chris Ford | 204 | 11.4 | +11.4 | |
Majority | 578 | 32.3 | +0.9 | ||
Turnout | 1,792 | 37.2 | -1.9 | ||
Conservative hold | Swing | ||||
Party | Candidate | Votes | % | |
---|---|---|---|---|
Conservative | Lee Dangerfield | 685 | 42.8 | |
Liberal Democrats | Christopher Robins | 588 | 36.7 | |
Labour | Dennis Palmer | 329 | 20.5 | |
Majority | 97 | 6.1 | ||
Turnout | 1,602 | 31.8 | ||
Conservative gain from Liberal Democrats | ||||
Party | Candidate | Votes | % | ±% | |
---|---|---|---|---|---|
Conservative | Sarah-Jane Dangerfield | 857 | 55.5 | +1.5 | |
Labour | Suzanne Ennifer | 482 | 31.2 | +0.1 | |
Liberal Democrats | Kuzna Jackson | 205 | 13.3 | -1.6 | |
Majority | 375 | 24.3 | +1.4 | ||
Turnout | 1,544 | 29.1 | -1.9 | ||
Conservative hold | Swing | ||||
Party | Candidate | Votes | % | ±% | |
---|---|---|---|---|---|
Labour | Bob Davis | 795 | 41.0 | +0.2 | |
Conservative | David Carter | 770 | 39.8 | +1.7 | |
Respect | Maureen Topley | 250 | 12.9 | +2.0 | |
Liberal Democrats | Julian Watkiss | 122 | 6.3 | -3.9 | |
Majority | 25 | 1.2 | -1.5 | ||
Turnout | 1,937 | 37.4 | -3.2 | ||
Labour hold | Swing | ||||
A by-election was held in Little Parndon and Hare Street on 25 October 2007 after the death of Labour councillor Jack Jesse. [10] [11] The seat was held for Labour by the former council leader Michael Danvers with a majority of 196 votes over the Conservatives. [10] [11]
Party | Candidate | Votes | % | ±% | |
---|---|---|---|---|---|
Labour | Michael Danvers | 794 | 52.6 | +3.4 | |
Conservative | Shona Johnson | 598 | 39.6 | +0.5 | |
Liberal Democrats | Nicholas Macy | 117 | 7.8 | -4.0 | |
Majority | 196 | 13.0 | +2.9 | ||
Turnout | 1,509 | 28.4 | -5.6 | ||
Labour hold | Swing | ||||
A by-election was held in Toddbrook ward on 25 October 2007 after the death of Labour councillor Roy Collyer. [10] [11] The seat was gained for the Conservatives by David Carter with a majority of 15 votes over Labour. [10]
Party | Candidate | Votes | % | ±% | |
---|---|---|---|---|---|
Conservative | David Carter | 728 | 45.2 | +5.4 | |
Labour | Terry Brandon | 713 | 44.3 | +3.3 | |
Respect | Maureen Topley | 102 | 6.3 | -6.6 | |
Liberal Democrats | Julian Watkiss | 67 | 4.2 | -2.1 | |
Majority | 15 | 0.9 | |||
Turnout | 1,610 | 30.5 | -6.9 | ||
Conservative gain from Labour | Swing | ||||
Elections to the Borough Council in Slough, England, were held on 3 May 2007. One third of the council was up for election. This was the 122nd Slough general local authority election since Slough became a local government unit in 1863.
The 1998 Harlow District Council election took place on 7 May 1998 to elect members of Harlow District Council in Essex, England. One third of the council was up for election and the Labour party stayed in overall control of the council.
The 2003 Harlow District Council election took place on 1 May 2003 to elect members of Harlow District Council in Essex, England. One third of the council was up for election and the council stayed under no overall control.
The 2008 Harlow District Council election took place on 1 May 2008 to elect members of Harlow District Council in Essex, England. One third of the council was up for election and the Conservative party gained overall control of the council from no overall control.
The 2003 St Albans City and District Council election took place on 1 May 2003 to elect members of St Albans District Council in Hertfordshire, England. One third of the council was up for election and the council stayed under no overall control.
The 2014 St Albans City and District Council election took place on 22 May 2014 to elect members of St Albans District Council in Hertfordshire, England. One third of the council was up for election and the council stayed under no overall control.
The 2012 Huntingdonshire District Council election took place on 3 May 2012 to elect members of Huntingdonshire District Council in Cambridgeshire, England. One third of the council was up for election and the Conservative Party stayed in overall control of the council.
The 2007 Rother District Council election took place on 3 May 2007 to elect members of Rother District Council in East Sussex, England. The whole council was up for election and the Conservative Party stayed in overall control of the council.
The 2011 West Berkshire Council election took place on 5 May 2011 to elect members of West Berkshire Council in Berkshire, England. The whole council was up for election and the Conservative Party stayed in overall control of the council.
The 2010 Harlow District Council election took place on 6 May 2010 to elect members of Harlow District Council in Essex, England. One third of the council was up for election and the Conservative party stayed in overall control of the council.
The 2011 Harlow District Council election took place on 5 May 2011 to elect members of Harlow District Council in Essex, England. One third of the council was up for election and the Conservative Party stayed in overall control of the council.
The 2012 Harlow District Council election took place on 3 May 2012 to elect members of Harlow District Council in Essex, England. One third of the council was up for election and the Labour Party gained overall control of the council from the Conservative Party.
The 2014 Harlow District Council election took place on 22 May 2014 to elect members of Harlow District Council in Essex, England. One third of the council was up for election and the Labour Party stayed in overall control of the council.
The 2007 Wychavon District Council election took place on 3 May 2007 to elect members of Wychavon District Council in Worcestershire, England. The whole council was up for election and the Conservative party stayed in overall control of the council.
The 2011 Wychavon District Council election took place on 5 May 2011 to elect members of Wychavon District Council in Worcestershire, England. The whole council was up for election and the Conservative Party stayed in overall control of the council.
The 2015 Wychavon District Council election took place on 7 May 2015 to elect members of Wychavon District Council in Worcestershire, England. The whole council was up for election and the Conservative Party stayed in overall control of the council.
The 2006 West Oxfordshire District Council election took place on 4 May 2006 to elect members of West Oxfordshire District Council in Oxfordshire, England. One third of the council was up for election and the Conservative Party stayed in overall control of the council.
The 2007 West Oxfordshire District Council election took place on 3 May 2007 to elect members of West Oxfordshire District Council in Oxfordshire, England. One third of the council was up for election and the Conservative Party stayed in overall control of the council.
The 2012 West Oxfordshire District Council election took place on 3 May 2012 to elect members of West Oxfordshire District Council in Oxfordshire, England. One third of the council was up for election and the Conservative Party stayed in overall control of the council.
The 2016 Harlow District Council election took place on 5 May 2016 to elect members of Harlow District Council in England. This was on the same day as other local elections.