![]() | |||||||||||||||||||||||||||||||||||||||||||||||||||||||||||
| |||||||||||||||||||||||||||||||||||||||||||||||||||||||||||
All 68 seats to Aberdeenshire Council 35 seats needed for a majority | |||||||||||||||||||||||||||||||||||||||||||||||||||||||||||
---|---|---|---|---|---|---|---|---|---|---|---|---|---|---|---|---|---|---|---|---|---|---|---|---|---|---|---|---|---|---|---|---|---|---|---|---|---|---|---|---|---|---|---|---|---|---|---|---|---|---|---|---|---|---|---|---|---|---|---|
| |||||||||||||||||||||||||||||||||||||||||||||||||||||||||||
![]() 2007 Aberdeenshire Council Election Results Map |
Elections to Aberdeenshire Council were held on 3 May 2007 the same day as the other Scottish local government elections and the Scottish Parliament general election. The election was the first one using 19 new wards created as a result of the Local Governance (Scotland) Act 2004, each ward would elect three or four councillors using the single transferable vote system form of proportional representation. The new wards replaced 68 single-member wards which used the plurality (first past the post) system of election.
The council remained under no overall control and a coalition was formed between the Liberal Democrats and the Conservatives.
At the previous election in 2003 the Liberal Democrats won 28 seats, falling 7 seats short of an overall majority. The SNP, Conservative and Independent groups also fell well short of an overall majority.
Party | Seats | Vote share |
---|---|---|
Liberal Democrats | 28 | 33.5% |
SNP | 18 | 27.6% |
Conservative | 11 | 21.0% |
Independent | 11 | 14.5% |
Source: [1]
There was one by-election in the 2003-07 term. The seat was held by the Conservatives.
Party | 2003 election | Dissolution |
---|---|---|
Liberal Democrats | 28 | 28 |
SNP | 18 | 18 |
Conservative | 11 | 11 |
Independent | 11 | 11 |
Source: [2]
Party | Seats | Gains | Losses | Net gain/loss | Seats % | Votes % | Votes | +/− | |
---|---|---|---|---|---|---|---|---|---|
Liberal Democrats | 24 | - | - | ![]() | 35.3 | 25.2 | 24,175 | ![]() | |
SNP | 22 | - | - | ![]() | 32.4 | 34.5 | 33,120 | ![]() | |
Conservative | 14 | - | - | ![]() | 20.6 | 20.8 | 19,946 | ![]() | |
Independent | 8 | - | - | ![]() | 11.8 | 12.7 | 12,182 | ![]() | |
Labour | 0 | - | - | ![]() | 0.0 | 5.4 | 5,189 | ![]() | |
Scottish Green | 0 | - | - | ![]() | 0.0 | 1.1 | 1,097 | New | |
Solidarity | 0 | - | - | ![]() | 0.0 | 0.1 | 112 | New | |
BNP | 0 | - | - | ![]() | 0.0 | 0.1 | 87 | New |
Note: "Votes" are the first preference votes. The net gain/loss and percentage changes relate to the result of the previous Scottish local elections on 1 May 2003. This may differ from other published sources showing gain/loss relative to seats held at dissolution of Scotland's councils.
Party | Candidate | FPv% | Count | ||||||||
---|---|---|---|---|---|---|---|---|---|---|---|
1 | 2 | 3 | 4 | 5 | 6 | 7 | 8 | ||||
SNP | Ian Gray | 24.0 | 1,088 | 1,092 | 1,103 | 1,142 | |||||
Liberal Democrats | Jack Mair | 15.3 | 694 | 704 | 713 | 773 | 773 | 848 | 915 | 1,132 | |
Independent | John Cox | 15.2 | 691 | 707 | 742 | 791 | 791 | 925 | 1,055 | 1,257 | |
Conservative | Neil Chalmers | 13.6 | 616 | 626 | 640 | 666 | 666 | 741 | 792 | ||
SNP | Kathryn Parr | 11.0 | 500 | 509 | 525 | 554 | 558 | 609 | |||
Independent | Sandy Buchan | 8.4 | 383 | 398 | 438 | 475 | 475 | ||||
Scottish Green | Jonny Barton | 6.6 | 298 | 301 | 319 | ||||||
Independent | John Calder | 3.8 | 172 | 180 | |||||||
Independent | Ian Page | 2.1 | 94 | ||||||||
Electorate: 8,815 Valid: 4,536 Spoilt: 105 Quota: 1,135 Turnout: 53.1% |
Party | Candidate | FPv% | Count | ||
---|---|---|---|---|---|
1 | 2 | ||||
SNP | Mitchell Burnett | 47.7 | 1,798 | ||
Conservative | John Duncan | 24.3 | 914 | 1,060 | |
Independent | Sydney Mair | 20.4 | 770 | 975 | |
Liberal Democrats | Ian Findlay | 7.6 | 286 | 422 | |
Electorate: 7,563 Valid: 3,768 Spoilt: 53 Quota: 943 Turnout: 50.9% |
Party | Candidate | FPv% | Count | |||||||
---|---|---|---|---|---|---|---|---|---|---|
1 | 2 | 3 | 4 | 5 | 6 | 7 | ||||
SNP | Brian Topping | 27.1 | 1,487 | |||||||
SNP | Ian Tait | 20.6 | 1,131 | |||||||
Independent | Michael Watt | 15.1 | 831 | 865 | 869 | 890 | 918 | 1,041 | 1,370 | |
SNP | Andy Ritchie | 14.5 | 795 | 1,022 | 1,037 | 1,046 | 1,060 | 1,090 | 1,165 | |
Independent | Dennis Duthie | 9.3 | 509 | 520 | 522 | 554 | 587 | 728 | ||
Conservative | Bob Sim | 8.5 | 466 | 482 | 484 | 490 | 522 | |||
Liberal Democrats | Dominique-Paul Lonchay | 3.0 | 164 | 167 | 168 | 171 | ||||
Independent | James Milne | 2.0 | 109 | 116 | 116 | |||||
Electorate: 11,011 Valid: 5,492 Spoilt: 168 Quota: 1,099 Turnout: 51.8% |
Party | Candidate | FPv% | Count | ||||||||
---|---|---|---|---|---|---|---|---|---|---|---|
1 | 2 | 3 | 4 | 5 | 6 | 7 | 8 | ||||
SNP | Sandy Stronach | 20.2 | 1,096 | ||||||||
Independent | Norman Smith | 19.4 | 1,054 | 1,054 | 1,080 | 1,142 | |||||
Conservative | Peter Chapman | 17.2 | 933 | 933 | 974 | 1,022 | 1,031 | 1,087 | |||
Independent | Albert Howe | 14.6 | 790 | 790 | 822 | 911 | 933 | 1,016 | 1,016 | 1,283 | |
SNP | Norma Thomson | 13.2 | 718 | 726 | 771 | 804 | 812 | 870 | 870 | ||
Labour | Carol Donald | 5.9 | 318 | 318 | 363 | 378 | 381 | ||||
Independent | Jim Conn | 4.9 | 265 | 265 | 290 | ||||||
Liberal Democrats | Betty May | 4.7 | 253 | 253 | |||||||
Electorate: 10,020 Valid: 5,427 Spoilt: 91 Quota: 1,086 Turnout: 55.4% |
Party | Candidate | FPv% | Count | |||||||
---|---|---|---|---|---|---|---|---|---|---|
1 | 2 | 3 | 4 | 5 | 6 | 7 | ||||
SNP | Anne Allan | 22.4 | 1,018 | |||||||
Independent | Alan Buchan | 20.9 | 948 | 948 | ||||||
SNP | Fiona McRae | 15.0 | 682 | 696 | 699 | 713 | 735 | 763 | 1,316 | |
Conservative | Robert Thomas | 14.4 | 655 | 655 | 659 | 667 | 704 | 803 | 819 | |
SNP | Sandy Allan | 12.9 | 585 | 666 | 671 | 685 | 718 | 752 | ||
Liberal Democrats | Andrew Hassan | 6.3 | 288 | 290 | 292 | 304 | 356 | |||
Independent | Ian Cowie | 5.6 | 256 | 257 | 265 | 289 | ||||
Solidarity | Steven Will | 2.5 | 112 | 113 | 115 | |||||
Electorate: 10,274 Valid: 4,544 Spoilt: 150 Quota: 909 Turnout: 46.0% |
Party | Candidate | FPv% | Count | |||||
---|---|---|---|---|---|---|---|---|
1 | 2 | 3 | 4 | 5 | ||||
SNP | Stephen Smith | 29.4 | 1,205 | |||||
SNP | Stuart Pratt | 21.6 | 888 | 1,016 | 1,032 | |||
Liberal Democrats | Sam Coull | 21.0 | 861 | 870 | 894 | 895 | 1,032 | |
Independent | Raymond Matthew | 13.0 | 535 | 542 | 637 | 638 | 767 | |
Conservative | Steven Owen | 10.3 | 422 | 425 | 443 | 443 | ||
Independent | Veronica Johnston | 4.7 | 193 | 196 | ||||
Electorate: 8,813 Valid: 4,104 Spoilt: 108 Quota: 1,027 Turnout: 48.1% |
Party | Candidate | FPv% | Count | |||||
---|---|---|---|---|---|---|---|---|
1 | 2 | 3 | 4 | 5 | ||||
SNP | Sandy Duncan | 41.9 | 1,916 | |||||
Conservative | Alistair Duffus Strachan | 17.4 | 796 | 882 | 901 | 932 | ||
Liberal Democrats | Anne Robertson | 17.3 | 790 | 948 | 962 | 1,071 | 1,372 | |
Independent | Alisan Norrie | 16.4 | 748 | 900 | 935 | 971 | 1,304 | |
Labour | Ann Marie Sheal | 5.1 | 232 | 270 | 279 | |||
BNP | Gary Raikes | 1.9 | 87 | 119 | ||||
Electorate: 8,679 Valid: 4,569 Spoilt: 52 Quota: 1,143 Turnout: 53.5% |
Party | Candidate | FPv% | Count | |||||
---|---|---|---|---|---|---|---|---|
1 | 2 | 3 | 4 | 5 | ||||
SNP | Allan Hendry | 33.6 | 2,035 | |||||
Liberal Democrats | Paul Johnston | 27.4 | 1,661 | |||||
Conservative | Jim Gifford | 17.1 | 1,034 | 1,141 | 1,182 | 1,261 | ||
Liberal Democrats | John Kevin Loveday | 11.2 | 677 | 855 | 1,134 | 1,210 | 1,227 | |
Labour | Steve Thomson | 7.7 | 469 | 558 | 586 | 613 | 618 | |
Independent | Howard Kershaw | 3.1 | 188 | 290 | 306 | |||
Electorate: 11,047 Valid: 6,064 Spoilt: 59 Quota: 1,213 Turnout: 55.9% |
Party | Candidate | FPv% | Count | |||||
---|---|---|---|---|---|---|---|---|
1 | 2 | 3 | 4 | 5 | ||||
SNP | Rob Merson | 40.5 | 2,458 | |||||
Liberal Democrats | Isobel Davidson | 23.2 | 1,407 | |||||
Conservative | Gillian Louise Owen | 14.4 | 872 | 1,033 | 1,053 | 1,197 | 1,274 | |
Liberal Democrats | Debra Margaret Storr | 8.6 | 524 | 777 | 899 | 1,049 | 1,326 | |
Labour | Ann Thorpe | 7.5 | 456 | 587 | 599 | 648 | ||
Independent | Diane Ripley | 5.8 | 352 | 542 | 555 | |||
Electorate: 11,186 Valid: 6,069 Spoilt: 69 Quota: 1,214 Turnout: 55.4% |
Party | Candidate | FPv% | Count | ||||||
---|---|---|---|---|---|---|---|---|---|
1 | 2 | 3 | 4 | 5 | 6 | ||||
SNP | Alison Grant | 35.5 | 1,555 | ||||||
Liberal Democrats | Sheena Margaret Lonchay | 22.2 | 973 | 1,063 | 1,085 | 1,169 | |||
Liberal Democrats | Hazel Al-Kowarri | 18.4 | 807 | 884 | 899 | 981 | 1,027 | 1,358 | |
Conservative | David Clucas | 15.8 | 694 | 746 | 775 | 821 | 830 | ||
Labour | Ricky Simpson | 6.0 | 263 | 293 | 303 | ||||
Independent | Terry Rigby | 2.1 | 93 | 125 | |||||
Electorate: 8,036 Valid: 4,385 Spoilt: 58 Quota: 1,097 Turnout: 55.7% |
Party | Candidate | FPv% | Count | ||||||
---|---|---|---|---|---|---|---|---|---|
1 | 2 | 3 | 4 | 5 | 6 | ||||
SNP | Bryan Hunter Stuart | 29.6 | 1,515 | ||||||
Liberal Democrats | Mike Raeburn | 25.7 | 1,316 | ||||||
Liberal Democrats | Martin Kitts-Hayes | 16.9 | 865 | 975 | 1,172 | ||||
Conservative | Richard Cowling | 14.9 | 762 | 823 | 837 | 864 | 928 | 1,190 | |
Labour | Ellis Thorpe | 11.1 | 567 | 637 | 659 | 693 | 737 | ||
Independent | John Sangster | 1.7 | 87 | 165 | 175 | 192 | |||
Electorate: 9,361 Valid: 5,148 Spoilt: 86 Quota: 1,030 Turnout: 56.3% |
Party | Candidate | FPv% | Count | ||||
---|---|---|---|---|---|---|---|
1 | 2 | 3 | 4 | ||||
SNP | Fergie Hood | 31.9 | 1,420 | ||||
Liberal Democrats | Martin Anthony Ford | 23.7 | 1,054 | 1,118 | |||
Liberal Democrats | Nan Cullinane | 21.8 | 968 | 1,025 | 1,030 | 1,206 | |
Conservative | Gordon Naismith | 15.5 | 687 | 726 | 726 | 769 | |
Labour | Sheila Henderson | 7.1 | 317 | 345 | 345 | ||
Electorate: 8,185 Valid: 4,446 Spoilt: 56 Quota: 1,112 Turnout: 54.9% |
Party | Candidate | FPv% | Count | ||||||
---|---|---|---|---|---|---|---|---|---|
1 | 2 | 3 | 4 | 5 | 6 | ||||
Liberal Democrats | Gurudeo Singh Saluja | 27.3 | 1,558 | ||||||
Conservative | Ron McKail | 22.9 | 1,306 | ||||||
SNP | Amanda Allan | 21.6 | 1,230 | ||||||
Independent | Mark Cullen | 14.8 | 845 | 896 | 945 | 967 | 1,031 | 1,407 | |
Liberal Democrats | Sheila Thomson | 8.1 | 460 | 736 | 774 | 794 | 935 | ||
Labour | Ona Ramsay | 5.3 | 301 | 325 | 333 | 344 | |||
Electorate: 10,567 Valid: 5,700 Spoilt: 39 Quota: 1,141 Turnout: 55.0% |
Party | Candidate | FPv% | Count | |||||||
---|---|---|---|---|---|---|---|---|---|---|
1 | 2 | 3 | 4 | 5 | 6 | 7 | ||||
SNP | Joanna Strathdee | 30.7 | 1,839 | |||||||
Conservative | Moira Ingleby | 27.3 | 1,635 | |||||||
Liberal Democrats | Richard C Stroud | 16.4 | 978 | 1,077 | 1,145 | 1,170 | 1,280 | |||
Liberal Democrats | Alistair Ross | 13.6 | 812 | 907 | 979 | 1,012 | 1,088 | 1,143 | 1,378 | |
Labour | Bryan Begg | 6.3 | 375 | 424 | 444 | 456 | 501 | 508 | ||
Scottish Green | Jake Williams | 4.2 | 251 | 340 | 376 | 421 | ||||
Independent | David Hutchison | 1.5 | 91 | 135 | 177 | |||||
Electorate: 11,162 Valid: 5,981 Spoilt: 82 Quota: 1,197 Turnout: 54.7% |
Party | Candidate | FPv% | Count | |||||
---|---|---|---|---|---|---|---|---|
1 | 2 | 3 | 4 | 5 | ||||
Conservative | Marcus Humphrey | 29.3 | 1,444 | |||||
Liberal Democrats | Peter Argyle | 26.1 | 1,286 | |||||
Conservative | Bruce Luffman | 20.5 | 1,009 | 1,160 | 1,172 | 1,218 | 1,625 | |
SNP | Carol Douglas | 20.1 | 991 | 1,009 | 1,021 | 1,078 | ||
Labour | Angus Murdoch | 4.0 | 196 | 202 | 213 | |||
Electorate: 8,467 Valid: 4,926 Spoilt: 75 Quota: 1,232 Turnout: 59.5% |
Party | Candidate | FPv% | Count | |||||
---|---|---|---|---|---|---|---|---|
1 | 2 | 3 | 4 | 5 | ||||
Conservative | Jill Webster | 35.6 | 1,570 | |||||
SNP | Linda Clark | 24.2 | 1,068 | 1,140 | ||||
Liberal Democrats | Karen Clark | 18.0 | 795 | 876 | 885 | 1,029 | 1,691 | |
Liberal Democrats | Jean Henretty | 15.3 | 300 | 790 | 798 | 857 | ||
Labour | Andy Brown | 6.8 | 300 | 326 | 331 | |||
Electorate: 7,996 Valid: 4,409 Spoilt: 46 Quota: 1,103 Turnout: 56.3% |
Party | Candidate | FPv% | Count | |||||||
---|---|---|---|---|---|---|---|---|---|---|
1 | 2 | 3 | 4 | 5 | 6 | 7 | ||||
SNP | Alastair Bews | 27.8 | 1,426 | |||||||
Conservative | Carl H Nelson | 18.4 | 946 | 972 | 1,008 | 1,065 | ||||
Liberal Democrats | Paul Melling | 16.8 | 864 | 957 | 978 | 1,124 | ||||
Liberal Democrats | Ian Mollison | 12.1 | 619 | 652 | 689 | 799 | 863 | 875 | 1,119 | |
Independent | Henry Irvine-Fortescue | 11.2 | 575 | 613 | 659 | 707 | 713 | 723 | ||
Labour | Jim Milne | 10.5 | 540 | 586 | 596 | |||||
Independent | Michelle Reid-Hay | 3.2 | 162 | 194 | ||||||
Electorate: 9,980 Valid: 5,132 Spoilt: 37 Quota: 1,027 Turnout: 52.4% |
Party | Candidate | FPv% | Count | |||||||||||
---|---|---|---|---|---|---|---|---|---|---|---|---|---|---|
1 | 2 | 3 | 4 | 5 | 6 | 7 | 8 | 9 | 10 | 11 | ||||
Conservative | Wendy Agnew | 24.9 | 1,433 | |||||||||||
SNP | Graeme Clark | 18.9 | 1,086 | 1,107 | 1,112 | 1,117 | 1,126 | 1,154 | ||||||
Liberal Democrats | Mike Sullivan | 11.0 | 636 | 656 | 657 | 668 | 684 | 700 | 701 | 741 | 797 | 931 | 1,105 | |
Conservative | Sandy Wallace | 10.9 | 629 | 730 | 735 | 737 | 751 | 760 | 760 | 779 | 823 | 853 | ||
Liberal Democrats | Peter Bellarby | 9.8 | 563 | 590 | 596 | 605 | 620 | 633 | 633 | 723 | 780 | 880 | 980 | |
Labour | Bridget O'Hare | 8.0 | 463 | 470 | 473 | 479 | 482 | 493 | 493 | 524 | 558 | |||
Independent | Bob Michie | 4.9 | 282 | 299 | 314 | 333 | 366 | 430 | 430 | 470 | ||||
Scottish Green | Karen Anne Allan | 4.2 | 242 | 253 | 258 | 264 | 272 | 285 | 286 | |||||
Independent | George Alexander Forbes Emslie | 2.8 | 160 | 177 | 182 | 189 | 201 | |||||||
Independent | Ken Venters | 1.9 | 108 | 116 | 132 | 139 | ||||||||
Independent | Dermot John Hearty | 1.5 | 85 | 87 | 89 | |||||||||
Independent | David Wood | 1.3 | 73 | 79 | ||||||||||
Electorate: 10,770 Valid: 5,760 Spoilt: 90 Quota: 1,153 Turnout: 54.8% |
Party | Candidate | FPv% | Count | ||||||||
---|---|---|---|---|---|---|---|---|---|---|---|
1 | 2 | 3 | 4 | 5 | 6 | 7 | 8 | ||||
SNP | Jean Dick | 23.0 | 1,262 | ||||||||
Conservative | George Carr | 20.5 | 1,123 | ||||||||
Liberal Democrats | Tom Fleming | 16.6 | 909 | 940 | 945 | 1,046 | 1,144 | ||||
Liberal Democrats | Bill Howatson | 13.8 | 759 | 775 | 778 | 815 | 850 | 879 | 1,021 | 1,291 | |
Labour | Gill Bayfield | 7.1 | 392 | 406 | 407 | 442 | 455 | 459 | |||
Independent | David Nelson | 7.1 | 391 | 404 | 407 | 432 | 596 | 601 | 659 | ||
Independent | Robert Gairn Davidson | 6.2 | 342 | 355 | 358 | 403 | |||||
Scottish Green | Kate Anderson | 5.6 | 306 | 336 | 338 | ||||||
Electorate: 10,436 Valid: 5,484 Spoilt: 48 Quota: 1,097 Turnout: 53.3% |
As no party group had the required 35 seats to have an overall majority, the council remained under no overall control and after negotiations, a coalition was formed between the Liberal Democrats and the Conservatives.
Cllr Ian Tait resigned from the SNP on 28 July 2008 and now sits as an Independent Scottish Nationalist.
Cllr Debra Storr resigned from the Liberal Democrats on 18 November 2008 and on 5 March 2009 she joined the Scottish Green Party. She was a member of the Democratic Independent Group on the council.
Cllr Martin Ford resigned from the Liberal Democrats on 23 November 2008 and on 5 March 2009 he joined the Scottish Green Party. He is a member of the Democratic Independent Group on the council.
On 23 January 2009, Cllr Sam Coull resigned from the Liberal Democrats. Since 5 March 2009 he sits as a member of the Democratic Independent Group
On 23 January 2009, Cllr Paul Johnston left the Liberal Democrat Council Group. He was subsequently expelled from the Liberal Democrats. Since 5 March 2009 he sits as a member of the Democratic Independent Group.
Cllr Andy Ritchie resigned from the SNP on 1 April 2009 and now sits as an Independent.
Cllr Mark Cullen is also a member of the Democratic Independent Group on the council.
On 21 February 2012 Banff and District Cllr John Cox ceased to be an Independent and joined the Scottish National Party.
There was a Troup by-election held on 1 May 2008 to fill the vacancy which arose with the death of the SNP's Michael Burnett on 4 February 2008. The by-election was won by the SNP's Bob Watson.
Party | Candidate | FPv% | Count | ||
---|---|---|---|---|---|
1 | |||||
SNP | Bob Watson | 62.83 | 1,721 | ||
Conservative | Lisa Watt | 18.80 | 515 | ||
Liberal Democrats | Edward Acton | 18.36 | 503 | ||
SNP hold | Swing | ||||
Electorate: 7,589 Valid: 2,739 Spoilt: 16 Quota: 1,371 Turnout: 2,755 (36.3%) |
There was an Aboyne, Upper Deeside and Donside by-election held on 23 April 2009 to fill the vacancy which arose with the resignation of the Conservative's Bruce Luffman in 2009. The by-election was won by the Liberal Democrat's Rosemary Bruce.
Party | Candidate | FPv% | Count | |||||
---|---|---|---|---|---|---|---|---|
1 | 2 | 3 | 4 | 5 | ||||
Conservative | Jo Pick | 31.47 | 1,144 | 1,148 | 1,152 | 1,241 | 1,468 | |
Liberal Democrats | Rosemary Bruce | 26.66 | 969 | 975 | 981 | 1,180 | 1,566 | |
Independent | William Forbes | 23.16 | 842 | 845 | 855 | 1,003 | ||
SNP | George Parkinson | 16.97 | 617 | 621 | 636 | |||
BNP | Roy Jones | 1.21 | 44 | 44 | ||||
Independent | David Hutchison | 0.52 | 19 | |||||
Liberal Democrats gain from Conservative | Swing | |||||||
Electorate: 8,357 Valid: 3,635 Spoilt: 20 Quota: 1,819 Turnout: 3,655 (43.7%) |
The Politics of Aberdeen, Scotland have changed significantly in recent years. In 1996, under the Local Government etc. (Scotland) Act 1994, Grampian Regional Council and Aberdeen District Council were dissolved, creating the new unitary Aberdeen City Council to represent the city's council area.
Elections to Glasgow City Council were held on 3 May 2007, the same day as the other Scottish local government elections and the Scottish Parliament general election. The election was the first one using 21 new wards created as a result of the Local Governance (Scotland) Act 2004, each ward elected three or four councillors using the single transferable vote system form of proportional representation. The new wards replaced 79 single-member wards which used the plurality system of election. It also saw the election of Glasgow's first councillors for the Scottish Greens and for Solidarity.
The 2007 Aberdeen City Council election took place on 3 May 2007 to elect members of Aberdeen City Council, at the same time as the Scottish Parliament general election. The election was the first one using 13 new wards created as a result of the Local Governance (Scotland) Act 2004, with each ward electing three or four councillors using the single transferable vote system a form of proportional representation. The new wards replaced 43 single-member wards, which used the plurality system of election.
Elections to The Moray Council were held on 3 May 2007, the same day as the Scottish Parliament election. The election was the first using the eight new wards created under the Local Governance (Scotland) Act 2004. 26 councillors were elected. Each ward elected either 3 or 4 members, using the STV electoral system. Previously there were single-member wards which used the first past the post electoral system.
Elections to Aberdeenshire Council were held on 3 May 2012, on the same day as the other Scottish local government elections. The election used the 19 wards created as a result of the Local Governance (Scotland) Act 2004, with each ward electing three or four Councillors using the single transferable vote system form of proportional representation, with 68 Councillors being elected.
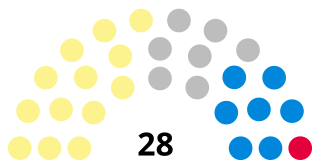
Elections to the Moray Council were held on 3 May 2012, the same day as the other 31 local authorities in Scotland. The election used the eight wards created under the Local Governance (Scotland) Act 2004, with 26 councillors being elected. Each ward elected either 3 or 4 members, using the STV electoral system.
Elections to Argyll and Bute Council were held on 3 May 2012 on the same day as the 31 other local authorities in Scotland. The election used the eleven wards created under the Local Governance (Scotland) Act 2004, with 36 councillors being elected. Each ward elected either 3 or 4 members, using the STV electoral system.
The 2012 North Ayrshire Council election took place on 3 May 2012 to elect members of North Ayrshire Council. The election used the eight wards created as a result of the Local Governance (Scotland) Act 2004, with each ward electing three or four councillors using the single transferable vote system form of proportional representation, with 30 Councillors being elected.
The 2017 Aberdeen City Council election took place on 4 May 2017 to elect members of Aberdeen City Council. The election used the 13 wards created as a result of the Local Governance (Scotland) Act 2004, with each ward electing three or four Councillors using the single transferable vote system a form of proportional representation, with a total of 45 Councillors elected, an increase in two members from 2012.
Elections to Aberdeenshire Council were held on 4 May 2017, on the same day as the other Scottish local government elections. The election used the 19 wards created as a result of the Local Governance (Scotland) Act 2004, with each ward electing three or four councillors using the single transferable vote system form of proportional representation, with 70 councillors being elected, an increase of two members compared to 2012.
Elections to The Highland Council were held on 5 May 2022, the same day as the 31 other Scottish local government elections. As with other Scottish council elections, it was held using single transferable vote (STV) – a form of proportional representation – in which multiple candidates are elected in each ward and voters rank candidates in order of preference.
Elections to South Lanarkshire Council took place on 5 May 2022 on the same day as the 31 other Scottish local government elections. As with other Scottish council elections, it was held using single transferable vote (STV) – a form of proportional representation – in which multiple candidates are elected in each ward and voters rank candidates in order of preference.
Elections to Dumfries and Galloway Council took place on 5 May 2022 on the same day as the 31 other Scottish local government elections. As with other Scottish council elections, it was held using single transferable vote (STV) – a form of proportional representation – in which multiple candidates are elected in each ward and voters rank candidates in order of preference.
Elections to Angus Council took place on 5 May 2022, the same day as the 31 other Scottish local government elections. As with other Scottish council elections, it was held using single transferable vote (STV) – a form of proportional representation – in which multiple candidates are elected in each ward and voters rank candidates in order of preference.
Elections to South Ayrshire Council took place on 5 May 2022 on the same day as the 31 other Scottish local government elections. As with other Scottish council elections, it was held using single transferable vote (STV) – a form of proportional representation – in which multiple candidates are elected in each ward and voters rank candidates in order of preference.
Elections to Argyll and Bute Council took place on 5 May 2022, the same day as the 31 other Scottish local government elections. As with other Scottish council elections, it was held using single transferable vote (STV)—a form of proportional representation—in which multiple candidates are elected in each ward and voters rank candidates in order of preference. New ward boundaries were proposed by Boundaries Scotland in 2021, which would have reduced the total number of councillors to 34. However, these were rejected by the Scottish Parliament and the boundaries used at the previous election remained in place.
Elections to Aberdeenshire Council took place on Thursday 5 May 2022 on the same day as the 31 other Scottish local government elections. As with other Scottish council elections, it was held using single transferable vote (STV) – a form of proportional representation – in which multiple candidates are elected in each ward and voters rank candidates in order of preference.
Elections to Aberdeen City Council took place on 5 May 2022 on the same day as the 31 other Scottish local government elections. As with other Scottish council elections, it was held using single transferable vote (STV) – a form of proportional representation – in which multiple candidates are elected in each ward and voters rank candidates in order of preference.
Elections to Clackmannanshire Council took place on 5 May 2022, the same day as the 31 other Scottish local government elections. As with other Scottish council elections, it was held using single transferable vote (STV)—a form of proportional representation—in which multiple candidates are elected in each ward and voters rank candidates in order of preference.
Elections to the Aberdeenshire Council were held on 1 May 2003, the same day as the other Scottish local government elections and the Scottish Parliament general election. This was the last election to use the first-past-the-post voting system across 68 single member wards.
{{cite web}}
: CS1 maint: archived copy as title (link){{cite web}}
: CS1 maint: archived copy as title (link)