| |||||||||||||||||||||||||||||||||
All 48 seats to West Dorset District Council 25 seats needed for a majority | |||||||||||||||||||||||||||||||||
---|---|---|---|---|---|---|---|---|---|---|---|---|---|---|---|---|---|---|---|---|---|---|---|---|---|---|---|---|---|---|---|---|---|
| |||||||||||||||||||||||||||||||||
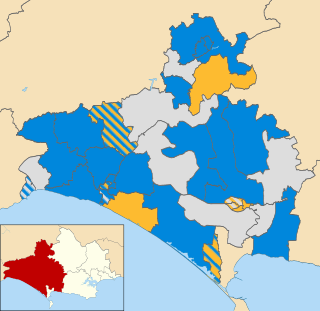
Map showing the results of the 2007 West Dorset District Council elections. | |||||||||||||||||||||||||||||||||
|
The 2007 West Dorset District Council election was held on Thursday 3 May 2007 to elect councillors to West Dorset District Council in England. It took place on the same day as other district council elections in the United Kingdom. The entire council was up for election.
The 2007 election saw the Conservatives maintain their majority control of the District Council. [1]
Party | Candidate | Votes | % | ±% | |
---|---|---|---|---|---|
Liberal Democrats | Caroline Lucy Payne * | 813 | 48.6 | N/A | |
Liberal Democrats | Janet Irene Page | 712 | – | ||
Conservative | C. Etherington | 705 | 42.2 | N/A | |
Conservative | R. Knox | 704 | – | ||
Independent | M. Garcia | 154 | 9.2 | N/A | |
Turnout | 48.8 | ||||
Registered electors | 3,306 | ||||
Liberal Democrats hold | |||||
Liberal Democrats gain from Conservative |
Party | Candidate | Votes | % | ±% | |
---|---|---|---|---|---|
Conservative | W. Mellish | 432 | 47.8 | N/A | |
Liberal Democrats | T. Rogers | 419 | 46.4 | +12.5 | |
Green | G. Black | 52 | 5.8 | N/A | |
Majority | 13 | 1.4 | N/A | ||
Turnout | 59.7 | +21.1 | |||
Registered electors | 1,514 | ||||
Conservative gain from Independent | Swing | ||||
Party | Candidate | Votes | % | ±% | |
---|---|---|---|---|---|
Conservative | Ronald William Coatsworth * | 474 | 70.6 | –7.9 | |
Liberal Democrats | G. Fifield | 134 | 20.0 | –1.5 | |
Green | Julian Jones | 63 | 9.4 | N/A | |
Majority | 340 | 50.7 | –6.4 | ||
Turnout | 40.6 | +9.6 | |||
Registered electors | 1,668 | ||||
Conservative hold | Swing | ||||
Party | Candidate | Votes | % | ±% | |
---|---|---|---|---|---|
Conservative | R. Stoodley * | 561 | 31.5 | +3.8 | |
Liberal Democrats | Rosamond Catherine Kayes | 543 | 34.2 | +6.4 | |
Liberal Democrats | Christopher Martin Ray * | 514 | – | ||
Conservative | K. Day | 466 | – | ||
Green | N. Judd | 173 | 10.9 | N/A | |
Independent | C. Sparkes | 156 | 9.8 | N/A | |
Labour | R. Nicholls | 155 | 9.8 | –13.2 | |
Turnout | 40.5 | +6.9 | |||
Registered electors | 3,431 | ||||
Conservative hold | Swing | ||||
Liberal Democrats hold | Swing | ||||
Party | Candidate | Votes | % | ±% | |
---|---|---|---|---|---|
Conservative | Sandra Ann Brown * | 1,061 | 33.2 | +3.4 | |
Liberal Democrats | Karl Gareth Wallace | 779 | 24.4 | +12.4 | |
Independent | David Robert Tett * | 755 | 23.6 | –1.7 | |
Liberal Democrats | Dave Rickard | 689 | – | ||
Conservative | D. Wallace | 656 | – | ||
Liberal Democrats | J. Hunt | 612 | – | ||
Conservative | L. Wallace | 547 | – | ||
Green | T. Dickson | 391 | 12.2 | +2.6 | |
Labour | L. Begley | 211 | 6.6 | –13.1 | |
Turnout | 45.5 | +7.8 | |||
Registered electors | 4,720 | ||||
Conservative hold | Swing | ||||
Liberal Democrats gain from Conservative | Swing | ||||
Independent hold | Swing | ||||
Party | Candidate | Votes | % | ±% | |
---|---|---|---|---|---|
Conservative | Alan John Thacker * | 429 | 65.1 | N/A | |
Liberal Democrats | M. Lane | 230 | 34.9 | N/A | |
Majority | 199 | 30.2 | N/A | ||
Turnout | 45.8 | N/A | |||
Registered electors | 1,587 | ||||
Conservative gain from Independent |
Party | Candidate | Votes | % | ±% | |
---|---|---|---|---|---|
Conservative | Jacqualyne Frances Irene Sewell * | 474 | 70.5 | +12.1 | |
Liberal Democrats | Teresa Georgina Harrison | 198 | 29.5 | –12.1 | |
Majority | 276 | 41.1 | +24.2 | ||
Turnout | 45.3 | –0.3 | |||
Registered electors | 1,493 | ||||
Conservative hold | Swing | ||||
Party | Candidate | Votes | % | ±% | |
---|---|---|---|---|---|
Liberal Democrats | M. Parsons * | 531 | 49.3 | –17.9 | |
Conservative | J. Cook | 482 | 44.8 | +12.0 | |
Green | L. Edwards | 64 | 5.9 | N/A | |
Majority | 49 | 4.5 | –29.9 | ||
Turnout | 64.9 | +5.8 | |||
Registered electors | 1,662 | ||||
Liberal Democrats hold | Swing | ||||
Party | Candidate | Votes | % | ±% | |
---|---|---|---|---|---|
Liberal Democrats | S. Friar * | 407 | 46.5 | –12.6 | |
Conservative | T. Cook | 377 | 43.1 | +2.2 | |
Independent | P. Jenkins | 91 | 10.4 | N/A | |
Majority | 30 | 3.4 | –14.9 | ||
Turnout | 52.4 | +5.7 | |||
Registered electors | 1,677 | ||||
Liberal Democrats hold | Swing | ||||
Party | Candidate | Votes | % | ±% | |
---|---|---|---|---|---|
Conservative | Sarah Jane East * | 1,150 | 59.3 | –14.9 | |
Conservative | Andrew Frederick Horsington * | 1,131 | – | ||
Liberal Democrats | P. McGuinness | 540 | 27.8 | N/A | |
Labour | L. Ahern | 249 | 12.8 | N/A | |
Turnout | 47.4 | +6.4 | |||
Registered electors | 3,626 | ||||
Conservative hold | Swing | ||||
Party | Candidate | Votes | % | ±% | |
---|---|---|---|---|---|
Independent | D. Newson * | unopposed | N/A | N/A | |
Registered electors | 1,516 | ||||
Independent hold | |||||
Party | Candidate | Votes | % | ±% | |
---|---|---|---|---|---|
Conservative | Thomas William George Bartlett * | 605 | 66.2 | +5.1 | |
Liberal Democrats | D. Gardner | 309 | 33.8 | –5.1 | |
Majority | 296 | 32.4 | +10.3 | ||
Turnout | 51.5 | +5.9 | |||
Registered electors | 1,794 | ||||
Conservative hold | Swing | ||||
Party | Candidate | Votes | % | ±% | |
---|---|---|---|---|---|
Liberal Democrats | Ian Charles Gardner * | 739 | 45.4 | +3.2 | |
Conservative | Elaine Elizabeth Whyte | 733 | 45.0 | +6.1 | |
Liberal Democrats | M. Rogers * | 672 | – | ||
Liberal Democrats | J. Worth | 669 | – | ||
Conservative | Margaret Jean Dunseith | 656 | – | ||
Conservative | R. Fleming | 654 | – | ||
Labour | T. Gould | 156 | 9.6 | N/A | |
Labour | K. Parish | 133 | – | ||
Labour | R. Wyatt | 124 | – | ||
Turnout | 37.4 | +8.8 | |||
Registered electors | 4,394 | ||||
Liberal Democrats hold | Swing | ||||
Conservative hold | Swing | ||||
Liberal Democrats hold | Swing | ||||
Party | Candidate | Votes | % | ±% | |
---|---|---|---|---|---|
Conservative | Gillian Esme Summers * | 449 | 66.4 | –1.1 | |
Liberal Democrats | T. Fifield | 227 | 33.6 | +1.1 | |
Majority | 222 | 32.8 | –2.2 | ||
Turnout | 45.2 | +6.2 | |||
Registered electors | 1,506 | ||||
Conservative hold | Swing | ||||
Party | Candidate | Votes | % | ±% | |
---|---|---|---|---|---|
Liberal Democrats | Enid Stella Jones * | 838 | 48.0 | –11.1 | |
Liberal Democrats | Timothy Charles Nelson Harries * | 659 | – | ||
Conservative | R. Martindale | 458 | 26.2 | –14.7 | |
Independent | A. Delgoffe | 267 | 15.3 | N/A | |
Labour | O. Trevett | 182 | 10.4 | N/A | |
Turnout | 40.3 | +4.3 | |||
Registered electors | 3,446 | ||||
Liberal Democrats hold | Swing | ||||
Party | Candidate | Votes | % | ±% | |
---|---|---|---|---|---|
Liberal Democrats | Andrew James Canning * | 726 | 43.2 | +4.4 | |
Liberal Democrats | Susan Caroline Hosford | 636 | – | ||
Conservative | A. Beard * | 551 | 32.8 | +5.6 | |
Conservative | V. Allan | 519 | – | ||
Independent | V. Waddington-Black | 404 | 24.0 | N/A | |
Turnout | 43.7 | +1.7 | |||
Registered electors | 3,437 | ||||
Liberal Democrats hold | Swing | ||||
Liberal Democrats gain from Independent | Swing | ||||
Party | Candidate | Votes | % | ±% | |
---|---|---|---|---|---|
Liberal Democrats | Molly Rennie * | 1,007 | 60.1 | +3.0 | |
Liberal Democrats | Robin Potter * | 940 | – | ||
Conservative | J. Halewood | 668 | 39.9 | –3.0 | |
Conservative | N. Matthews | 578 | – | ||
Turnout | 49.4 | +9.4 | |||
Registered electors | 3,326 | ||||
Liberal Democrats hold | Swing | ||||
Party | Candidate | Votes | % | ±% | |
---|---|---|---|---|---|
Liberal Democrats | David Trevor Jones * | 764 | 37.7 | – | |
Independent | David John Barrett * | 755 | 37.2 | –3.3 | |
Liberal Democrats | A. Harries | 495 | – | ||
Conservative | J. Cooke | 360 | 17.8 | –3.9 | |
Labour | J. Fell | 149 | 7.3 | N/A | |
Turnout | 45.2 | +3.2 | |||
Registered electors | 3,408 | ||||
Liberal Democrats hold | Swing | ||||
Independent hold | Swing | ||||
Party | Candidate | Votes | % | ±% | |
---|---|---|---|---|---|
Conservative | Naomi Mary Penfold * | 711 | 80.1 | N/A | |
Liberal Democrats | S. Morris | 177 | 19.9 | N/A | |
Majority | 534 | 60.1 | N/A | ||
Turnout | 50.9 | N/A | |||
Registered electors | 1,771 | ||||
Conservative gain from Independent |
Party | Candidate | Votes | % | ±% | |
---|---|---|---|---|---|
Independent | T. Frost * | unopposed | N/A | N/A | |
Registered electors | 1,527 | ||||
Independent hold | |||||
Party | Candidate | Votes | % | ±% | |
---|---|---|---|---|---|
Conservative | Mark Brandon Roberts * | 441 | 66.3 | +16.2 | |
Liberal Democrats | M. Ray | 224 | 33.7 | +12.7 | |
Majority | 217 | 32.6 | +11.4 | ||
Turnout | 46.3 | +4.9 | |||
Registered electors | 1,451 | ||||
Conservative hold | Swing | ||||
Party | Candidate | Votes | % | ±% | |
---|---|---|---|---|---|
Liberal Democrats | Daryl Whane Turner | 769 | 39.9 | N/A | |
Independent | Patrick William James Hicks | 591 | – | ||
Conservative | Owen Keith Lovell * | 568 | 29.5 | –17.5 | |
Conservative | K. Meech * | 420 | – | ||
Independent | S. Williams | 283 | – | ||
Turnout | 47.8 | +14.5 | |||
Registered electors | 3,129 | ||||
Liberal Democrats hold | Swing | ||||
Independent gain from Independent | Swing | ||||
Party | Candidate | Votes | % | ±% | |
---|---|---|---|---|---|
Conservative | N. Patmore * | unopposed | N/A | N/A | |
Registered electors | 1,600 | ||||
Conservative gain from Independent |
Party | Candidate | Votes | % | ±% | |
---|---|---|---|---|---|
Conservative | Michael Disney Robinson | 451 | 62.0 | +11.2 | |
Liberal Democrats | L. Thomas | 277 | 38.0 | –11.2 | |
Majority | 174 | 23.9 | +22.3 | ||
Turnout | 50.8 | –5.0 | |||
Registered electors | 1,437 | ||||
Conservative hold | Swing | ||||
Party | Candidate | Votes | % | ±% | |
---|---|---|---|---|---|
Conservative | Anthony Paul Robin Alford * | 395 | 67.4 | +5.3 | |
Liberal Democrats | J. Wymer | 191 | 32.6 | –5.3 | |
Majority | 204 | 34.8 | +10.7 | ||
Turnout | 35.2 | –7.8 | |||
Registered electors | 1,676 | ||||
Conservative hold | Swing | ||||
Party | Candidate | Votes | % | ±% | |
---|---|---|---|---|---|
Conservative | P. Read | 818 | 55.5 | +3.0 | |
Conservative | Teresa Mary Seall * | 770 | – | ||
Liberal Democrats | D. Burden | 467 | 31.7 | N/A | |
Liberal Democrats | R. Armstrong | 441 | – | ||
Labour | G. Napper | 190 | 12.9 | N/A | |
Labour | W. Napper | 177 | – | ||
Turnout | 50.5 | +8.0 | |||
Registered electors | 2,924 | ||||
Conservative hold | Swing | ||||
Party | Candidate | Votes | % | ±% | |
---|---|---|---|---|---|
Conservative | N. Barker * | 644 | 85.0 | N/A | |
Liberal Democrats | C. Savory | 114 | 15.0 | N/A | |
Majority | 530 | 69.9 | N/A | ||
Turnout | 46.2 | N/A | |||
Registered electors | 1,659 | ||||
Conservative hold | Swing | ||||
Party | Candidate | Votes | % | ±% | |
---|---|---|---|---|---|
Conservative | Robert Patrick Gordon Cooke * | unopposed | N/A | N/A | |
Registered electors | 1,839 | ||||
Conservative gain from Independent |
Party | Candidate | Votes | % | ±% | |
---|---|---|---|---|---|
Conservative | Robert Andrew Gould * | 599 | 81.5 | N/A | |
Liberal Democrats | J. Jones | 136 | 18.5 | N/A | |
Majority | 463 | 63.0 | N/A | ||
Turnout | 45.0 | N/A | |||
Registered electors | 1,634 | ||||
Conservative hold | |||||
Party | Candidate | Votes | % | ±% | |
---|---|---|---|---|---|
Conservative | Terence Peter Farmer * | 813 | 46.8 | +3.1 | |
Conservative | Dominic Charles Elliot | 789 | – | ||
Green | Jenny Susan Greene | 441 | 25.4 | –7.1 | |
Liberal Democrats | C. Gloster | 295 | 17.0 | N/A | |
Liberal Democrats | J. McGuinness | 286 | – | ||
Labour | Graham Parish | 188 | 10.8 | –13.1 | |
Turnout | 42.5 | +8.5 | |||
Registered electors | 3,544 | ||||
Conservative hold | Swing | ||||
Party | Candidate | Votes | % | ±% | |
---|---|---|---|---|---|
Conservative | Peter Robert Shorland * | 926 | 64.8 | +8.4 | |
Conservative | Marjorie Snowden * | 878 | – | ||
Liberal Democrats | S. Friar | 503 | 35.2 | –8.4 | |
Liberal Democrats | S. Hewson | 459 | – | ||
Turnout | 42.2 | +8.6 | |||
Registered electors | 3,464 | ||||
Conservative hold | Swing | ||||
Party | Candidate | Votes | % | ±% | |
---|---|---|---|---|---|
Independent | Stephen John Slade * | unopposed | N/A | N/A | |
Registered electors | 1,678 | ||||
Independent hold | |||||
Party | Candidate | Votes | % | ±% | |
---|---|---|---|---|---|
Conservative | Margaret Rose Lawrence | 402 | 55.1 | –14.7 | |
Liberal Democrats | Josephine Jones | 327 | 44.9 | +14.7 | |
Majority | 75 | 10.7 | –28.9 | ||
Turnout | 53.4 | +12.1 | |||
Registered electors | 1,371 | ||||
Conservative hold | Swing | ||||
Dorset is a ceremonial county in South West England. It is bordered by Somerset to the north-west, Wiltshire to the north and the north-east, Hampshire to the east, the Isle of Wight across the Solent to the south-east, the English Channel to the south, and Devon to the west. The largest settlement is Bournemouth, and the county town is Dorchester.
Weymouth and Portland was a local government district with borough status in Dorset, England from 1974 to 2019. It consisted of the resort of Weymouth and the Isle of Portland, and includes the areas of Wyke Regis, Preston, Melcombe Regis, Upwey, Broadwey, Southill, Nottington, Westham, Radipole, Chiswell, Castletown, Fortuneswell, Weston, Southwell and Easton; the latter six being on the Isle of Portland.
East Dorset was a local government district in Dorset, England. Its council met in Wimborne Minster between 2016 and 2019.
Christchurch Borough Council in Dorset, England, existed from 1974 to 2019, when it was abolished and subsumed into Bournemouth, Christchurch and Poole Council.
Bournemouth Borough Council was the local authority of Bournemouth in Dorset, England and ceased to exist on 1 April 2019. It was a unitary authority, although between 1974 and 1997 it was an administrative district council with Dorset. Previously most of the borough was part of Hampshire.
Kennet was a non-metropolitan district in Wiltshire, England. It was abolished on 1 April 2009 and replaced by Wiltshire Council.
East Dorset District Council in Dorset, England existed from 1973 to 2019, when it was abolished and subsumed into Dorset Council.
The 2011 West Dorset District Council election was held on Thursday 5 May 2011 to elect councillors to West Dorset District Council in England. It took place on the same day as other district council elections in the United Kingdom. The whole of this 48-seat council was up for election.
The 2007 East Dorset District Council election took place on 3 May 2007 to elect members of East Dorset District Council in Dorset, England. The whole council was up for election and the Conservative Party stayed in overall control of the council.
The 2015 West Dorset District Council election was held on Thursday 7 May 2015 to elect councillors to West Dorset District Council in England. It took place on the same day as the general election other district council elections in the United Kingdom. A series of boundary changes saw the number of councillors reduced from 48 to 44.
The 2015 East Dorset District Council election took place on 7 May 2015 in order to elect members of the East Dorset District Council in Dorset, England. The whole council was up for election after boundary changes reduced the number of seats by seven. The Conservative Party stayed in overall control of the council.
West Dorset District Council in Dorset, England existed from 1974 to 2019. The council was abolished and subsumed into Dorset Council in 2019.
Dorset Council is a unitary local authority for the district of Dorset, encompassing almost all of the county of the same name (Dorset) except for the district of Bournemouth, Christchurch and Poole. Created in April 2019, the council was formed when the county moved from a two-tier county council and district council system to a one-tier system, with the county divided into two districts administered by two independent unitary authorities.
The 2019 Dorset Council election was held on Thursday 2 May 2019 to elect councillors to the new Dorset Council in England. It took place on the same day as other district council elections in the United Kingdom.
The 1973 West Dorset District Council election was held on Thursday 10 May 1973 to elect councillors to the new West Dorset District Council in England. It took place on the same day as other district council elections in the United Kingdom.
The 1987 West Dorset District Council election was held on Thursday 7 May 1987 to elect councillors to West Dorset District Council in England. It took place on the same day as other district council elections in the United Kingdom. The entire council was up for election as West Dorset returned to whole councils elections, after previously having been elected in thirds.
The 1991 West Dorset District Council election was held on Thursday 2 May 1991 to elect councillors to West Dorset District Council in England. It took place on the same day as other district council elections in the United Kingdom. The entire council was up for election. District boundary changes took place before the election but the number of seats remained the same.
The 1995 West Dorset District Council election was held on Thursday 4 May 1995 to elect councillors to West Dorset District Council in England. It took place on the same day as other district council elections in the United Kingdom. The entire council was up for election.
The 1999 West Dorset District Council election was held on Thursday 6 May 1999 to elect councillors to West Dorset District Council in England. It took place on the same day as other district council elections in the United Kingdom. The entire council was up for election.
The 2003 West Dorset District Council election was held on Thursday 1 May 2003 to elect councillors to West Dorset District Council in England. It took place on the same day as other district council elections in the United Kingdom. The entire council was up for election. Following boundary changes the number of wards were reduced by five, and the number of seats reduced from 55 to 48.