The 2007 Wear Valley District Council election [2] took place on 3 May 2007 to elect members of Wear Valley District Council in England. This took place on the same day as other local elections across the UK.
All of the seats being contested were last contested in 2003. [3]
Party | Candidate | Votes | % | ±% | |
---|---|---|---|---|---|
Liberal Democrats | Samuel Zair | 374 | 52.2 | ||
Liberal Democrats | Sharon Ord | 248 | |||
Labour | Bill Wade | 181 | 25.2 | ||
Labour | Frederick Anderson | 176 | |||
Conservative | Colin Firby | 162 | 22.6 | ||
Conservative | Hazel Lodge | 160 | |||
Turnout | 29.1 | ||||
Liberal Democrats gain from Labour | Swing | ||||
Liberal Democrats gain from Independent | Swing | ||||
Party | Candidate | Votes | % | ±% | |
---|---|---|---|---|---|
Liberal Democrats | Neil Harrison | 600 | 36.7 | ||
Liberal Democrats | Alan Anderson | 597 | |||
Labour | Barbara Laurie | 559 | 34.1 | ||
Conservative | Colin Raine | 478 | 29.2 | ||
Conservative | Jim Tague | 458 | |||
Liberal Democrats | Graham Snaith | 451 | |||
Conservative | John Gasston | 437 | |||
Labour | Keith Stokeld | 431 | |||
Turnout | 39.7 | ||||
Liberal Democrats hold | Swing | ||||
Labour hold | Swing | ||||
Party | Candidate | Votes | % | ±% | |
---|---|---|---|---|---|
Liberal Democrats | Tommy Taylor | 516 | 51 | ||
Liberal Democrats | Diane Hardaker | 506 | |||
Labour | Neil Stonehouse | 495 | 49 | ||
Labour | Lucy Thompson | 465 | |||
Labour | Norman Strongman | 370 | |||
Turnout | 31.1 | ||||
Liberal Democrats hold | Swing | ||||
Liberal Democrats gain from Labour | Swing | ||||
Labour hold | Swing | ||||
Party | Candidate | Votes | % | ±% | |
---|---|---|---|---|---|
Liberal Democrats | Patricia Jopling | 222 | 54.7 | ||
Labour | Graeme McKellar | 184 | 45.3 | ||
Turnout | 30 | ||||
Liberal Democrats gain from Labour | Swing | ||||
Party | Candidate | Votes | % | ±% | |
---|---|---|---|---|---|
Labour | Eddie Murphy | 625 | 43.9 | ||
Labour | Geoff Mowbray | 622 | |||
Liberal Democrats | Ann Carrick | 580 | 40.7 | ||
Labour | Peter Sung | 541 | |||
Liberal Democrats | David English | 504 | |||
Liberal Democrats | Gavin Jopling | 449 | |||
BNP | Robert Muir | 219 | 15.3 | ||
Turnout | 33.2 | ||||
Labour hold | Swing | ||||
Liberal Democrats gain from Labour | Swing | ||||
Party | Candidate | Votes | % | ±% | |
---|---|---|---|---|---|
Liberal Democrats | Dorothy Burn | 361 | 59.3 | ||
Liberal Democrats | Gary Henry | 346 | |||
Labour | Margaret Ingledew | 248 | 40.7 | ||
Labour | Sandra Lethbridge | 222 | |||
Turnout | 28.6 | ||||
Liberal Democrats hold | Swing | ||||
Party | Candidate | Votes | % | ±% | |
---|---|---|---|---|---|
Labour | Robert Yorke | 35.1 | |||
Liberal Democrats | Vince Perkins | 290 | 34.1 | ||
Liberal Democrats | John Fenwick | 280 | |||
Conservative | Peter Laws | 262 | 30.8 | ||
Labour | Olwyn Gunn | 260 | |||
Conservative | Alisha Lynas | 250 | |||
Turnout | 36.1 | ||||
Labour gain from Liberal Democrats | Swing | ||||
Liberal Democrats hold | Swing | ||||
Party | Candidate | Votes | % | ±% | |
---|---|---|---|---|---|
Liberal Democrats | Betty Todd | 443 | 53.8 | ||
Labour | John Lethbridge | 381 | 46.2 | ||
Liberal Democrats | John Huntington | 371 | |||
Labour | Reg Davison | 368 | |||
Turnout | 29.9 | ||||
Liberal Democrats hold | Swing | ||||
Labour hold | Swing | ||||
Party | Candidate | Votes | % | ±% | |
---|---|---|---|---|---|
Liberal Democrats | John Bailey | 336 | 74.7 | ||
Labour | Steven Cason | 114 | 25.3 | ||
Turnout | 32.8 | ||||
Liberal Democrats gain from Labour | Swing | ||||
Party | Candidate | Votes | % | ±% | |
---|---|---|---|---|---|
Liberal Democrats | Kenneth Bowser | 270 | 53.9 | ||
Labour | David Nevins | 231 | 46.1 | ||
Turnout | 35.1 | ||||
Liberal Democrats gain from Labour | Swing | ||||
Party | Candidate | Votes | % | ±% | |
---|---|---|---|---|---|
Independent | John Shuttleworth | 640 | 88.6 | ||
Conservative | Christopher Houghton | 82 | 11.4 | ||
Turnout | 59.6 | ||||
Independent hold | Swing | ||||
Party | Candidate | Votes | % | ±% | |
---|---|---|---|---|---|
Independent | Thomas Mews | 579 | 36.1 | ||
Independent | Angela Bolam | 510 | |||
Labour | William Hobson | 421 | 26.3 | ||
Conservative | Christopher Rowell | 359 | 22.4 | ||
Liberal Democrats | Anthony Simpson | 244 | 15.2 | ||
Turnout | 43.1 | ||||
Independent hold | Swing | ||||
Independent gain from Labour | Swing | ||||
Party | Candidate | Votes | % | ±% | |
---|---|---|---|---|---|
Labour | Colin Hayton | 418 | 34.2 | ||
Labour | Jeff Gale | 407 | |||
Independent | Ron Grogan | 399 | 32.6 | ||
Labour | Jack Walker | 334 | |||
Liberal Democrats | David Halliday | 246 | 20.1 | ||
Conservative | Harvey Morgan | 161 | 13.2 | ||
Turnout | 29.4 | ||||
Labour hold | Swing | ||||
Independent hold | Swing | ||||
Party | Candidate | Votes | % | ±% | |
---|---|---|---|---|---|
Liberal Democrats | Colin Mairs | 556 | 50.2 | ||
Labour | Margaret Douthwaite | 552 | 49.8 | ||
Liberal Democrats | John Ferguson | 539 | |||
Liberal Democrats | Pauline Fenwick | 455 | |||
Labour | Christine Wilson | 432 | |||
Labour | Andrew Turner | 372 | |||
Turnout | 31.2 | ||||
Liberal Democrats gain from Labour | Swing | ||||
Labour hold | Swing | ||||
Liberal Democrats hold | Swing | ||||
Party | Candidate | Votes | % | ±% | |
---|---|---|---|---|---|
Labour | Roger Ward | 384 | 55.6 | ||
Labour | Rose Seabury | 337 | |||
Liberal Democrats | Eileen Gooch | 307 | 44.4 | ||
Liberal Democrats | James Gooch | 296 | |||
Turnout | 31.2 | ||||
Labour hold | Swing | ||||
Party | Candidate | Votes | % | ±% | |
---|---|---|---|---|---|
Labour | David Kingston | 676 | 55.5 | ||
Labour | Alan Sinclair | 663 | |||
Labour | Joe Buckham | 642 | |||
Liberal Democrats | John Ferguson | 543 | 44.5 | ||
Turnout | 29.3 | ||||
Labour hold | Swing | ||||
Party | Candidate | Votes | % | ±% | |
---|---|---|---|---|---|
Labour | Margaret Pinkney | 256 | 48.8 | ||
Conservative | Becky Brunskill | 172 | 32.8 | ||
Liberal Democrats | Anne Glynn | 97 | 18.5 | ||
Turnout | 42.3 | ||||
Liberal Democrats gain from Labour | Swing | ||||
Party | Candidate | Votes | % | ±% | |
---|---|---|---|---|---|
Independent | Vere Shuttleworth | 618 | 68.1 | ||
Independent | Desmond Wilson | 500 | |||
Conservative | Christopher Rowell | 289 | 31.9 | ||
Conservative | Christopher Rowell | 274 | |||
Turnout | 36.4 | ||||
Independent hold | Swing | ||||
Party | Candidate | Votes | % | ±% | |
---|---|---|---|---|---|
Labour | David Wilson | 404 | 58 | ||
Labour | June Lee | 375 | |||
Labour | Charlie Kay | 368 | |||
Liberal Democrats | Lesley Zair | 292 | 42 | ||
Liberal Democrats | Pauline Ferguson | 278 | |||
Turnout | 21.9 | ||||
Labour hold | Swing | ||||
Elections to the Vale of White Horse District Council, the local authority for the Vale of White Horse in Oxfordshire, England take place every four years.
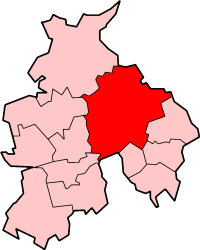
The election of councillors to Allerdale Borough Council in Cumbria, England took place every four years. The council was established in 1974 and it was abolished in 2023. The last elections were in 2019.
Maldon District Council in Essex, England is elected every four years.
Blaby District Council elections are held every four years. Blaby District Council is the local authority for the non-metropolitan district of Blaby in Leicestershire, England. Since the last boundary changes in 2023 the council has comprised 36 councillors representing 17 wards, with each ward electing one, two or three councillors.
Chelmsford City Council in Essex, England is elected every four years. Since the last boundary changes in 2003 the council has comprised 57 councillors elected from 24 wards.
Chichester District Council in West Sussex, England is elected every four years. Since the last boundary changes in 2003, 48 councillors have been elected from 29 wards.
Durham County Council elections are held every four years. Durham County Council is the local authority for the unitary authority of County Durham. The county council was first created in 1889 as an upper-tier authority, had its powers and territory reformed in 1974 under the Local Government Act 1972, and became a unitary authority in 2009, when the lower-tier district councils in the area were abolished. Since becoming a unitary authority, 126 councillors have been elected from 63 wards.
East Devon District Council is the local authority for East Devon in England. The council is elected every four years. Sixty councillors are elected from 30 wards since the last boundary changes in 2019.
South Oxfordshire District Council, a non-metropolitan district council in Oxfordshire, England is elected every four years.
North East Derbyshire District Council elections are held every four years. North East Derbyshire District Council is the local authority for the non-metropolitan district of North East Derbyshire in Derbyshire, England. Since the last boundary changes in 2019, 53 councillors have been elected from 24 wards.
Hambleton District Council was established in 1974 and abolished in 2023. It was elected every four years.
Uttlesford District Council is elected every four years.
Mid Sussex District Council is elected every four years.
Dover District Council is the local authority for the Dover District in Kent, England. The council is elected every four years.
Horsham District Council in West Sussex, England, is elected every four years.
One third of Mole Valley District Council in Surrey, England is elected each year, followed by one year when there is an election to Surrey County Council instead.
Gravesham Borough Council elections are held every four years to elect Gravesham Borough Council in Kent, England. Since the last boundary changes in 2023, the council has comprised 39 councillors, representing 17 wards.
Malvern Hills District Council elections are held every four years. Malvern Hills District Council is the local authority for the non-metropolitan district of Malvern Hills in Worcestershire, England. Since the last boundary changes in 2003, 38 councillors have been elected from 22 wards.
Ribble Valley Borough Council elections are held every four years. Ribble Valley Borough Council is the local authority for the non-metropolitan district of Ribble Valley in Lancashire, England. Since the last boundary changes in 2019, 40 councillors have been elected from 26 wards.
The 2019 North Tyneside Metropolitan Borough Council election took place on 2 May 2019 to elect members of North Tyneside Metropolitan Borough Council in England. This took place on the same day as other local elections across the UK including the first of 2019 North of Tyne mayoral election.