Elections to Stockport Metropolitan Borough Council were held on 3 May 2007. One third of the council was up for election. The Liberal Democrats retained overall control of the council with a majority of 9 councillors. The overall turnout was 36.7%.
Following the election, the make up of the council was as follows;
Party | Seats [1] | +/- | % votes | |
---|---|---|---|---|
Liberal Democrat | 36 | +1 | ||
Labour | 15 | 0 | ||
Conservative | 9 | -1 | ||
Heald Green Ratepayer | 3 | 0 |
Party | Candidate | Votes | % | ±% | |
---|---|---|---|---|---|
Liberal Democrats | Foster-Grime, H. | 2,525 | 47.5 | ||
Conservative | McCarron, R.B. | 2457 | 46.3 | ||
BNP | Gordon, D.R. | 186 | 3.5 | ||
Labour | Priestly, K.A. | 143 | 2.7 | ||
Majority | 68 | 1.3 | |||
Rejected ballots | 10 | 0.2 | |||
Turnout | 5321 | 50.7 | |||
Liberal Democrats gain from Conservative | Swing | ||||
Party | Candidate | Votes | % | ±% | |
---|---|---|---|---|---|
Conservative | Bellis, P.J. | 2,713 | 56.5 | ||
Liberal Democrats | Grice, L. | 1787 | 37.2 | ||
UKIP | Perry, D.M. | 155 | 3.2 | ||
Labour | Dykes, B.M. | 151 | 3.1 | ||
Majority | 926 | 19.3 | |||
Rejected ballots | 7 | 0.1 | |||
Turnout | 4813 | 49.6 | |||
Conservative hold | Swing | ||||
Party | Candidate | Votes | % | ±% | |
---|---|---|---|---|---|
Liberal Democrats | Wilson, M. | 2,018 | 65.8 | ||
Conservative | Gibbons, K. | 695 | 22.7 | ||
Labour | Stanway, C. | 354 | 11.5 | ||
Majority | 1323 | 43.1 | |||
Rejected ballots | 26 | 0.8 | |||
Turnout | 3093 | 28.3 | |||
Liberal Democrats hold | Swing | ||||
Party | Candidate | Votes | % | ±% | |
---|---|---|---|---|---|
Liberal Democrats | Margaret P. McLay | 1,993 | 46.8 | ||
Conservative | Rogers, J.D. | 1902 | 44.6 | ||
Labour | Bray, P.H. | 366 | 8.6 | ||
Majority | 91 | 2.1 | |||
Rejected ballots | 8 | 0.2 | |||
Turnout | 4269 | 39 | |||
Liberal Democrats hold | Swing | ||||
Party | Candidate | Votes | % | ±% | |
---|---|---|---|---|---|
Labour | Chris Murphy | 1,233 | 49.6 | ||
Liberal Democrats | Walker, C. | 998 | 40.1 | ||
Conservative | Heginbotham, J.E. | 257 | 10.3 | ||
Majority | 235 | 9.4 | |||
Rejected ballots | 17 | 0.7 | |||
Turnout | 2505 | 25.1 | |||
Labour hold | Swing | ||||
Party | Candidate | Votes | % | ±% | |
---|---|---|---|---|---|
Liberal Democrats | King, P. | 2,416 | 52.7 | ||
Conservative | Rankin, J.A. | 1762 | 38.4 | ||
Labour | Owen, C. | 409 | 8.9 | ||
Majority | 654 | 14.3 | |||
Rejected ballots | 19 | 0.4 | |||
Turnout | 4606 | 40.6 | |||
Liberal Democrats hold | Swing | ||||
Party | Candidate | Votes | % | ±% | |
---|---|---|---|---|---|
Liberal Democrats | Porgess, P. | 2,086 | 58.8 | ||
Conservative | Radmore, C. | 1010 | 28.5 | ||
Labour | Harrop, B.A. | 275 | 7.8 | ||
UKIP | Peake, H. | 174 | 4.9 | ||
Majority | 1076 | 30.4 | |||
Rejected ballots | 9 | 0.3 | |||
Turnout | 3554 | 35.9 | |||
Liberal Democrats hold | Swing | ||||
Party | Candidate | Votes | % | ±% | |
---|---|---|---|---|---|
Liberal Democrats | Wyatt, S.M. | 2,350 | 52.3 | ||
Conservative | Roscoe, M.L. | 1714 | 38.1 | ||
Labour | Sinclair, K.L. | 160 | 3.6 | ||
Green | Leaver, D.N. | 137 | 3 | ||
UKIP | Peake, C.A. | 136 | 3 | ||
Majority | 636 | 14.1 | |||
Rejected ballots | 8 | 0.2 | |||
Turnout | 4505 | 44.1 | |||
Liberal Democrats hold | Swing | ||||
Party | Candidate | Votes | % | ±% | |
---|---|---|---|---|---|
Liberal Democrats | Roy Driver | 1,235 | 38.3 | ||
Labour | Hendley, B.J. | 1070 | 33.1 | ||
Conservative | Holgate, C. | 500 | 15.5 | ||
BNP | Stansfield, P.D. | 323 | 10 | ||
UKIP | Crossley, M. | 100 | 3.1 | ||
Majority | 165 | 5.1 | |||
Rejected ballots | 16 | 0.5 | |||
Turnout | 3244 | 30.2 | |||
Liberal Democrats hold | Swing | ||||
Party | Candidate | Votes | % | ±% | |
---|---|---|---|---|---|
Labour | Richard Coaton | 1,558 | 45.5 | ||
Liberal Democrats | Rawling, A. | 1139 | 33.2 | ||
Conservative | Charlesworth, Beryl | 444 | 13 | ||
BNP | Chadfield, R. | 285 | 8.3 | ||
Majority | 419 | 12.2 | |||
Rejected ballots | 10 | 0.3 | |||
Turnout | 3436 | 32.2 | |||
Labour hold | Swing | ||||
Party | Candidate | Votes | % | ±% | |
---|---|---|---|---|---|
Liberal Democrats | Corris, C. | 2,265 | 53.8 | ||
Conservative | Lewis-Booth, J.A. | 1647 | 39.1 | ||
Labour | Bradley, Y.C. | 298 | 7.1 | ||
Majority | 618 | 14.7 | |||
Rejected ballots | 17 | 0.4 | |||
Turnout | 4227 | 39.4 | |||
Liberal Democrats hold | Swing | ||||
Party | Candidate | Votes | % | ±% | |
---|---|---|---|---|---|
Independent | Eileen Sylvia Humphreys | 2,370 | 62.7 | ||
Liberal Democrats | Roberts-Jones, D.M. | 524 | 13.9 | ||
Conservative | Stevenson, R.J. | 406 | 10.7 | ||
BNP | Skill, R.C. | 263 | 7 | ||
Labour | Junejo, M.A. | 214 | 5.7 | ||
Majority | 1846 | 48.9 | |||
Rejected ballots | 5 | 0.1 | |||
Turnout | 3782 | 37.8 | |||
Independent hold | Swing | ||||
Party | Candidate | Votes | % | ±% | |
---|---|---|---|---|---|
Conservative | Jackie Jones | 1,939 | 49.8 | ||
Labour | Pollard, M. | 1124 | 28.9 | ||
Liberal Democrats | Moss, P. | 448 | 11.5 | ||
Green | Cuff, J. | 381 | 9.8 | ||
Majority | 815 | 20.9 | |||
Rejected ballots | 8 | 0.2 | |||
Turnout | 3900 | 37.1 | |||
Conservative hold | Swing | ||||
Party | Candidate | Votes | % | ±% | |
---|---|---|---|---|---|
Labour | Breen, O. | 1,647 | 40.3 | ||
Conservative | Lees, B.M. | 1624 | 39.8 | ||
Liberal Democrats | Mustafa, M.G. | 423 | 10.4 | ||
Green | Hardman, T. | 391 | 9.6 | ||
Majority | 23 | 0.6 | |||
Rejected ballots | 11 | 0.3 | |||
Turnout | 4096 | 38.1 | |||
Labour hold | Swing | ||||
Party | Candidate | Votes | % | ±% | |
---|---|---|---|---|---|
Liberal Democrats | Jenny Humphreys* | 1,324 | 43.9 | ||
Labour | Lechner, B. | 808 | 26.8 | ||
Conservative | Charlesworth, Barry | 412 | 13.7 | ||
BNP | Warner, D.N. | 380 | 12.6 | ||
Independent | Russell, B. | 94 | 3.1 | ||
Majority | 516 | 17.1 | |||
Rejected ballots | 7 | 0.2 | |||
Turnout | 3025 | 29.1 | |||
Liberal Democrats hold | Swing | ||||
Party | Candidate | Votes | % | ±% | |
---|---|---|---|---|---|
Liberal Democrats | Bispham, A.J. | 2,089 | 51.6 | ||
Conservative | Walsh, C. | 1226 | 30.3 | ||
Green | Preston, M. | 376 | 9.3 | ||
Labour | Townsend, S. | 268 | 6.6 | ||
Independent | Russell, L. | 88 | 2.2 | ||
Majority | 863 | 21.3 | |||
Rejected ballots | 11 | 0.3 | |||
Turnout | 4058 | 41.7 | |||
Liberal Democrats hold | Swing | ||||
Party | Candidate | Votes | % | ±% | |
---|---|---|---|---|---|
Liberal Democrats | Baker, C. | 2,099 | 53.4 | ||
Conservative | Labrey, K.E. | 1215 | 30.9 | ||
Green | Reid, G.D. | 225 | 5.7 | ||
Labour | Rowbottom, D.E. | 205 | 5.2 | ||
UKIP | Moore, A.H. | 188 | 4.8 | ||
Majority | 884 | 22.5 | |||
Rejected ballots | 6 | 0.2 | |||
Turnout | 3938 | 40.9 | |||
Liberal Democrats hold | Swing | ||||
Party | Candidate | Votes | % | ±% | |
---|---|---|---|---|---|
Liberal Democrats | Wendy Meikle | 1,582 | 48.0 | ||
Conservative | Lewis-Booth, N. | 552 | 16.7 | ||
BNP | Maher, S.P. | 430 | 13.0 | ||
Labour | Ball, S. | 371 | 11.2 | ||
Independent | Ryan, K. | 363 | 11.0 | ||
Majority | 1030 | 31.2 | |||
Rejected ballots | 7 | 0.2 | |||
Turnout | 3305 | 31.6 | |||
Liberal Democrats hold | Swing | ||||
Party | Candidate | Votes | % | ±% | |
---|---|---|---|---|---|
Labour | David Owen | 1,522 | 53.8 | ||
Conservative | Hannay, A. | 564 | 19.9 | ||
BNP | Bennett, P.R. | 420 | 14.8 | ||
Liberal Democrats | Davenport, A. | 323 | 11.4 | ||
Majority | 958 | 33.9 | |||
Rejected ballots | 16 | 0.6 | |||
Turnout | 2845 | 27.2 | |||
Labour hold | Swing | ||||
Party | Candidate | Votes | % | ±% | |
---|---|---|---|---|---|
Labour | Brett, W.J. | 1,415 | 48.8 | ||
Conservative | Burt, S. | 545 | 18.8 | ||
Liberal Democrats | Langley, D. | 486 | 16.8 | ||
UKIP | Price, G. | 454 | 15.7 | ||
Majority | 870 | 30 | |||
Rejected ballots | 7 | 0.2 | |||
Turnout | 2907 | 27.8 | |||
Labour hold | Swing | ||||
Party | Candidate | Votes | % | ±% | |
---|---|---|---|---|---|
Liberal Democrats | Alexander, B. | 2,016 | 46.3 | ||
Conservative | Holt, L.M. | 1751 | 40.2 | ||
Labour | Rothwell, J.M. | 369 | 8.5 | ||
Green | Pease, K. | 220 | 5.1 | ||
Majority | 265 | 6.1 | |||
Rejected ballots | 7 | 0.2 | |||
Turnout | 4363 | 44.8 | |||
Liberal Democrats hold | Swing | ||||
Stockport Metropolitan Borough Council (SMBC) is the local authority for the Metropolitan Borough of Stockport, Greater Manchester, England. The council is currently run by a Liberal Democrat minority administration. At the 2023 local elections, the Liberal Democrats gained two more seats, increasing their lead over the Labour Party to six seats, and retaining minority control. This lead is now five seats after one of the Liberal Democrats’ councillors resigned the whip, days after being re-elected. The Liberal Democrats currently have 29 seats, Labour 24, and the Heald Green Ratepayers, Greens and the Edgeley Community Association each holding 3. There is 1 independent.
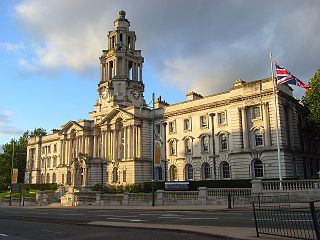
The Metropolitan Borough of Stockport is a metropolitan borough of Greater Manchester in England. It is south-east of central Manchester and south of Tameside. As well as the towns of Stockport, Bredbury and Marple, it includes the outlying villages and suburbs of Hazel Grove, Bramhall, Cheadle, Cheadle Hulme, Gatley, Reddish, Woodley and Romiley. In 2021, it had a population of 295,243, making it the fourth-most populous borough of Greater Manchester.
Stockport Metropolitan Borough Council elections are generally held three years out of every four, with a third of the council being elected each time. Stockport Metropolitan Borough Council is the local authority for the metropolitan borough of Metropolitan Borough of Stockport in Greater Manchester, England. Since the last boundary changes in 2004, 63 councillors have been elected from 21 wards. New ward boundaries are being prepared to take effect from the 2023 election.
Elections to Stockport Metropolitan Borough Council were held on 7 May 1998. One third of the council was up for election and the council stayed under no overall control.
Elections to Stockport Metropolitan Borough Council were held on 1 May 2008. One third of the council was up for election. The Liberal Democrats held overall control of the council.
Elections to Stockport Metropolitan Borough Council were held on 6 May 2010 when one third of the seats were up for election. The Liberal Democrats retained the majority that they had held continuously since 2002.
Hazel Grove is an electoral ward in the Metropolitan Borough of Stockport. It elects three Councillors to Stockport Metropolitan Borough Council using the first past the post electoral method, electing one Councillor every year without election on the fourth.
Elections to Stockport Metropolitan Borough Council were held on 5 May 2011, with one third of the seats up for election.
Marple North is an electoral ward in the Metropolitan Borough of Stockport. It elects three Councillors to Stockport Metropolitan Borough Council using the first past the post electoral method, electing one Councillor every year without election on the fourth.
Marple South and High Lane is an electoral ward in the Metropolitan Borough of Stockport. It elects three Councillors to Stockport Metropolitan Borough Council using the first past the post electoral method, electing one Councillor every year without election on the fourth.
The 2012 Stockport Metropolitan Borough Council election took place on 3 May 2012 to elect members of Stockport Metropolitan Borough Council in England. It was on the same day as other 2012 United Kingdom local elections.
Brinnington and Central is an electoral ward in the Metropolitan Borough of Stockport. It elects three Councillors to Stockport Metropolitan Borough Council using the first past the post electoral method, electing one Councillor every year without election on the fourth.
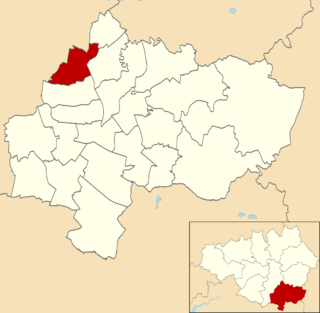
Heatons North is an electoral ward in the Metropolitan Borough of Stockport, Greater Manchester, England. It elects three Councillors to Stockport Metropolitan Borough Council using the first past the post electoral method, electing one Councillor every year without election on the fourth.
Offerton is an electoral ward in the Metropolitan Borough of Stockport. It elects three Councillors to Stockport Metropolitan Borough Council using the first-past-the-post electoral method, electing one Councillor every year without election on the fourth.
Stepping Hill was an electoral ward in the Metropolitan Borough of Stockport that existed from its creation for the 2004 Stockport Metropolitan Borough Council election until its abolition due to boundary changes in 2023. It elected three councillors to Stockport Metropolitan Borough Council using the first past the post electoral method, electing one Councillor every year without election on the fourth. The ward was abolished in the boundary changes preceding the 2023 Stockport Metropolitan Borough Council election. The ward was split up, with the largest part of it going to the new ward of Norbury & Woodsmoor. The parts of Great Moor and Little Moor that were within the ward were moved into the Offerton ward, and a very small area was moved into the Hazel Grove ward.
The 2015 Stockport Metropolitan Borough Council election took place on 7 May 2015 to elect members of Stockport Metropolitan Borough Council in England. This was on the same day as other local elections and the UK General Election. Stockport Council is elected in thirds which means that in each three member local ward, one councillor is elected every year, except every four years which is classed as fallow year. The last fallow year was 2013, when no local government elections took place in the borough. Those councillors elected with serve a four-year term expiring in 2019.
The 2006 Stockport Metropolitan Borough Council election took place on 4 May 2006 to elect members of Stockport Metropolitan Borough Council in England. This was on the same day as other local elections. One third of the council was up for election, with each successful candidate serving a four-year term of office, expiring in 2010. The Liberal Democrats held overall control of the council.
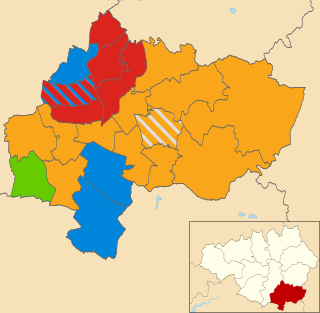
The 2004 Stockport Metropolitan Borough Council election took place on 10 June 2004 to elect members of Stockport Metropolitan Borough Council in England. This was on the same day as other local elections. Due to demographic changes in the Borough since its formation in 1973, and in common with most other English Councils in 2004, boundary changes were implemented in time for these elections. Due to these changes, it was necessary for the whole Council to be re-elected for the first time since 1973. The Liberal Democrats held overall control of the council.
Elections to Stockport Metropolitan Borough Council were held on 1 May 2003. One third of the council was up for election. The council remained in no overall control and this was the last Stockport local elections before the ward boundary changes came into effect for the 2004 local elections.
The 2022 Stockport Metropolitan Borough Council election took place 5 May 2022 to elect members of Stockport Metropolitan Borough Council. This was on the same day as other local elections. 21 of the 63 seats were up for election.