![]() | |||||||||||||||||||||||||||||||||||||||||||||||||
| |||||||||||||||||||||||||||||||||||||||||||||||||
21 of 63 seats to Trafford Metropolitan Borough Council 32 seats needed for a majority | |||||||||||||||||||||||||||||||||||||||||||||||||
---|---|---|---|---|---|---|---|---|---|---|---|---|---|---|---|---|---|---|---|---|---|---|---|---|---|---|---|---|---|---|---|---|---|---|---|---|---|---|---|---|---|---|---|---|---|---|---|---|---|
| |||||||||||||||||||||||||||||||||||||||||||||||||
![]() Map of results of 1998 election | |||||||||||||||||||||||||||||||||||||||||||||||||
|
Elections to Trafford Council were held on 7 May 1998. One-third of the council was up for election, with each successful candidate to serve a four-year term of office, expiring in 2002. The Labour Party held overall control of the council. [1]
Party | Votes | Seats | Full Council | |||||||
Labour Party | 24,844 (44.2%) | ![]() | 12 (57.1%) | 12 / 21 | ![]() | 36 (57.1%) | 36 / 63 | |||
Conservative Party | 25,185 (44.8%) | ![]() | 8 (38.1%) | 8 / 21 | ![]() | 23 (36.5%) | 23 / 63 | |||
Liberal Democrats | 5,114 (9.1%) | ![]() | 1 (4.8%) | 1 / 21 | ![]() | 4 (6.3%) | 4 / 63 | |||
Independent | 773 (1.4%) | ![]() | 0 (0.0%) | 0 / 21 | ![]() | 0 (0.0%) | 0 / 63 | |||
Socialist Labour Party | 266 (0.5%) | N/A | 0 (0.0%) | 0 / 21 | N/A | 0 (0.0%) | 0 / 63 |
36 | 4 | 23 |
Party | Candidate | Votes | % | ±% | |
---|---|---|---|---|---|
Conservative | S. F. M. Fildes | 1,700 | 50.7 | +1.4 | |
Labour | J. C. Graham | 1,501 | 44.8 | -3.6 | |
Independent | P. J. Royle | 77 | 2.3 | +2.3 | |
Independent | A. L. Brookes | 74 | 2.2 | +2.2 | |
Majority | 199 | 5.9 | -2.3 | ||
Turnout | 3,352 | 37.6 | -0.6 | ||
Conservative gain from Independent | Swing | ||||
Party | Candidate | Votes | % | ±% | |
---|---|---|---|---|---|
Conservative | M. C. Harney* | 2,042 | 66.3 | +5.0 | |
Liberal Democrats | C. Musgrove | 550 | 17.9 | -1.1 | |
Labour | R. G. Monkhouse | 486 | 15.8 | -4.0 | |
Majority | 1,492 | 48.4 | +6.9 | ||
Turnout | 3,078 | 32.7 | -5.5 | ||
Conservative hold | Swing | ||||
Party | Candidate | Votes | % | ±% | |
---|---|---|---|---|---|
Labour | J. E. Baugh* | 1,704 | 51.3 | +6.9 | |
Conservative | D. C. Simm | 1,383 | 41.6 | -5.6 | |
Liberal Democrats | D. Jones | 238 | 7.2 | -1.2 | |
Majority | 321 | 9.7 | +6.8 | ||
Turnout | 3,325 | 38.3 | -5.4 | ||
Labour hold | Swing | ||||
Party | Candidate | Votes | % | ±% | |
---|---|---|---|---|---|
Conservative | D. R. Higgins | 1,879 | 61.9 | +12.9 | |
Labour | J. Bagnoli | 833 | 27.5 | -8.3 | |
Liberal Democrats | Y. R. Clarke | 322 | 10.6 | -4.6 | |
Majority | 1,046 | 34.4 | -21.3 | ||
Turnout | 3,034 | 38.3 | -3.8 | ||
Conservative hold | Swing | ||||
Party | Candidate | Votes | % | ±% | |
---|---|---|---|---|---|
Labour | G. G. Kanes | 1,029 | 86.0 | +3.4 | |
Independent | S. Finch | 80 | 6.7 | +6.7 | |
Independent | M. E. Hindley | 45 | 3.8 | +3.8 | |
Independent | G. Hindley | 42 | 3.5 | +3.5 | |
Majority | 949 | 79.3 | +20.5 | ||
Turnout | 1,196 | 20.1 | -7.4 | ||
Labour hold | Swing | ||||
Party | Candidate | Votes | % | ±% | |
---|---|---|---|---|---|
Labour | P. W. Mitchell* | 1,384 | 68.6 | +3.8 | |
Independent | M. Ali | 377 | 18.7 | +1.0 | |
Conservative | L. G. Peck | 256 | 12.7 | -4.8 | |
Majority | 1,007 | 49.9 | +2.9 | ||
Turnout | 2,017 | 27.5 | -1.7 | ||
Labour hold | Swing | ||||
Party | Candidate | Votes | % | ±% | |
---|---|---|---|---|---|
Conservative | E. R. Eadie* | 1,688 | 59.1 | +1.5 | |
Labour | M. H. Rasul | 1,170 | 40.9 | -1.5 | |
Majority | 518 | 18.2 | |||
Turnout | 2,858 | 39.2 | |||
Conservative hold | Swing | ||||
Party | Candidate | Votes | % | ±% | |
---|---|---|---|---|---|
Labour | F. Mottley | 1,449 | 48.6 | -1.2 | |
Conservative | J. R. Reilly | 1,438 | 48.2 | -2.0 | |
Socialist Labour | J. D. Flannery | 95 | 3.2 | +3.2 | |
Majority | 11 | 0.4 | +0.1 | ||
Turnout | 2,982 | 38.4 | -4.6 | ||
Labour gain from Conservative | Swing | ||||
Party | Candidate | Votes | % | ±% | |
---|---|---|---|---|---|
Conservative | T. R. Seddon* | 1,754 | 53.4 | +10.9 | |
Labour | M. G. H. Barker | 1,532 | 46.6 | +4.9 | |
Majority | 222 | 6.8 | +6.0 | ||
Turnout | 3,286 | 42.8 | -3.4 | ||
Conservative hold | Swing | ||||
Party | Candidate | Votes | % | ±% | |
---|---|---|---|---|---|
Conservative | M. Lucas* | 2,069 | 70.7 | +11.0 | |
Liberal Democrats | R. M. Elliott | 438 | 15.0 | -12.0 | |
Labour | A. D . McNee | 420 | 14.4 | +1.1 | |
Majority | 1,631 | 55.7 | +23.1 | ||
Turnout | 2,927 | 34.0 | -8.1 | ||
Conservative hold | Swing | ||||
Party | Candidate | Votes | % | ±% | |
---|---|---|---|---|---|
Labour | J. A. Lloyd | 1,576 | 64.3 | +5.2 | |
Conservative | A. Kelly | 875 | 35.7 | -5.2 | |
Majority | 701 | 28.6 | +10.4 | ||
Turnout | 2,451 | 33.0 | -2.4 | ||
Labour hold | Swing | ||||
Party | Candidate | Votes | % | ±% | |
---|---|---|---|---|---|
Conservative | B. D. Rigby* | 2,155 | 63.3 | +13.2 | |
Labour | J. Bennett | 952 | 28.0 | -7.1 | |
Liberal Democrats | G. P. Rogers | 297 | 8.7 | -6.1 | |
Majority | 1,203 | 35.3 | +20.9 | ||
Turnout | 3,404 | 34.7 | -3.6 | ||
Conservative hold | Swing | ||||
Party | Candidate | Votes | % | ±% | |
---|---|---|---|---|---|
Labour | J. R. Haydock* | 956 | 64.3 | -2.5 | |
Conservative | E. J. Kelson | 531 | 35.7 | +2.5 | |
Majority | 425 | 28.6 | -5.0 | ||
Turnout | 1,487 | 24.4 | -8.0 | ||
Labour hold | Swing | ||||
Party | Candidate | Votes | % | ±% | |
---|---|---|---|---|---|
Labour | B. Brotherton* | 1,533 | 53.0 | +9.4 | |
Conservative | C. E. McEwen | 778 | 26.9 | +3.6 | |
Liberal Democrats | A. Vernon | 580 | 20.1 | -13.0 | |
Majority | 755 | 26.1 | +15.7 | ||
Turnout | 2,891 | 36.9 | -8.9 | ||
Labour hold | Swing | ||||
Party | Candidate | Votes | % | ±% | |
---|---|---|---|---|---|
Labour | P. Gratrix* | 1,380 | 54.1 | +5.4 | |
Conservative | R. D. Baldwin | 880 | 34.5 | -3.5 | |
Liberal Democrats | K. Clarke | 256 | 10.0 | -3.3 | |
Socialist Labour | L. M. Wright | 36 | 1.4 | +1.4 | |
Majority | 500 | 19.6 | +8.9 | ||
Turnout | 2,552 | 33.4 | -6.9 | ||
Labour hold | Swing | ||||
Party | Candidate | Votes | % | ±% | |
---|---|---|---|---|---|
Labour | L. T. Murkin* | 1,481 | 59.8 | -2.5 | |
Conservative | P. A. Almond | 805 | 32.5 | +2.5 | |
Liberal Democrats | T. J. P. Corbett | 189 | 7.6 | 0 | |
Majority | 676 | 27.3 | -5.0 | ||
Turnout | 2,475 | 28.8 | -6.4 | ||
Labour hold | Swing | ||||
Party | Candidate | Votes | % | ±% | |
---|---|---|---|---|---|
Labour | S. A. Adshead* | 1,449 | 59.5 | -2.8 | |
Conservative | K. G. Summerfield | 851 | 35.0 | -2.7 | |
Socialist Labour | P. J. Hibberd | 135 | 5.5 | +5.5 | |
Majority | 598 | 24.5 | 0 | ||
Turnout | 2,435 | 32.0 | -8.1 | ||
Labour hold | Swing | ||||
Party | Candidate | Votes | % | ±% | |
---|---|---|---|---|---|
Labour | S. Beaumont* | 944 | 72.3 | -4.0 | |
Conservative | S. M. Dirikis | 361 | 27.7 | +5.5 | |
Majority | 583 | 44.6 | -9.5 | ||
Turnout | 1,305 | 20.9 | -7.1 | ||
Labour hold | Swing | ||||
Party | Candidate | Votes | % | ±% | |
---|---|---|---|---|---|
Conservative | A. Bowker | 1,414 | 45.8 | +4.8 | |
Liberal Democrats | D. C. R. Horstead* | 844 | 27.4 | -8.0 | |
Labour | M. E. Atherton | 827 | 26.8 | +3.2 | |
Majority | 570 | 18.4 | |||
Turnout | 3,085 | 34.6 | -6.2 | ||
Conservative gain from Liberal Democrats | Swing | ||||
Party | Candidate | Votes | % | ±% | |
---|---|---|---|---|---|
Labour | D. Acton* | 1,645 | 58.9 | -3.0 | |
Conservative | D. M. H. Nicklin | 1,068 | 38.3 | +0.2 | |
Independent | N. J. Barrett | 78 | 2.8 | ||
Majority | 577 | 20.6 | -3.2 | ||
Turnout | 2,791 | 37.1 | -6.0 | ||
Labour hold | Swing | ||||
Party | Candidate | Votes | % | ±% | |
---|---|---|---|---|---|
Liberal Democrats | M. D. Cragg | 1,400 | 43.1 | -16.4 | |
Conservative | R. G. Strafford | 1,258 | 38.7 | +14.6 | |
Labour | M. E. Rose | 593 | 18.2 | +1.8 | |
Majority | 142 | 4.4 | -31.0 | ||
Turnout | 3,251 | 34.4 | -1.0 | ||
Liberal Democrats hold | Swing | ||||
The 1998 United Kingdom local elections were held on Thursday 7 May 1998. All London borough council seats were elected as well a third of the seats on each of the Metropolitan Boroughs. Some unitary authorities and District councils also had elections. There were no local elections in Scotland, Wales or Northern Ireland.
The 1998 Kingston upon Thames Council election was held on 7 May 1998. The whole council was up for election and the Liberal Democrats lost overall control of the council to a Conservative led minority administration.
Trafford Metropolitan Borough Council elections are generally held three years out of every four, with a third of the council being elected each time. Trafford Metropolitan Borough Council, generally known as Trafford Council, is the local authority for the metropolitan borough of Trafford in Greater Manchester, England. Since the last boundary changes in 2023, 63 councillors have been elected from 21 wards.
Elections to Liverpool City Council were held on 7 May 1998. One third of the council was up for election and the Liberal Democrat party took control of the council from the Labour party.
The 1998 Bolton Metropolitan Borough Council election took place on 7 May 1998 to elect members of Bolton Metropolitan Borough Council in Greater Manchester, England. One third of the council was up for election and the Labour Party kept overall control of the council.
Elections to Bexley London Borough Council were held on 7 May 1998. The whole council was up for election and the Conservative Party gained control of the council from no overall control. The electoral system used was the "first past the post", meaning that each seat was given to the candidate with the most votes.
The 1997 United Kingdom local elections took place on Thursday 1 May 1997 in England, and Wednesday 21 May 1997 in Northern Ireland. Elections took place for all of the English country councils, some English unitary authorities and all of the Northern Ireland districts. The local elections were held on the same day as the 1997 general election.
The 1999 Craven District Council election took place on 6 May 1999 to elect members of Craven District Council in North Yorkshire, England. One third of the council was up for election and the Conservative Party gained overall control of the council from no overall control.
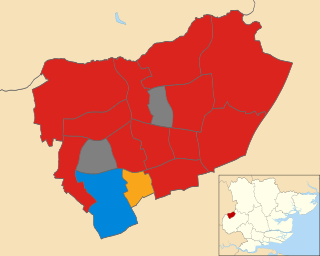
The 1998 Harlow District Council election took place on 7 May 1998 to elect members of Harlow District Council in Essex, England. One third of the council was up for election and the Labour party stayed in overall control of the council.
Elections to Croydon Council in London, England were held on 7 May 1998. The whole council was up for election and the Labour Party stayed in overall control of the council. For the first time in a local election two polling stations were situated in supermarkets.
Elections for the London Borough of Merton were held on 7 May 1998 to elect members of Merton London Borough Council in London, England. This was on the same day as other local elections in England and a referendum on the Greater London Authority; in the latter, Merton voted in favour of creating the Greater London Authority by 72.2% on a 37.6% turnout.
The 1998 Wyre Forest District Council election took place on 7 May 1998 to elect members of Wyre Forest District Council in Worcestershire, England. One-third of the council was up for election and the Labour Party stayed in overall control of the council.
The 2002 elections to Southwark Council were held in the London Borough of Southwark, England, on 2 May 2002. The whole council was up for election, with boundary changes since the last election in 1998, reducing the number of seats by one. There were 63 seats in 21 wards. The Council moved from Labour controlled to no overall control, with a minority Liberal Democrat executive. Turnout was 26.2%.
Elections to Greenwich Council were held in May 2002. The whole council was up for election for the first time since the 1998 election.
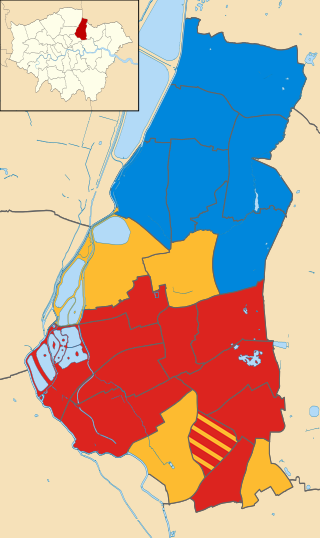
Elections to Waltham Forest Council were held in May 2002. The whole council was up for election for the first time since the 1998 election. These elections were the first held on new ward boundaries which increased the total number of Councillors by 2, from 58 to 60.
The 1998 Election to Waltham Forest Council, a borough in London. England was held in May 1998. The whole council was up for election for the first time since the 1994 election.
The 1998 Cheltenham Council election took place on 7 May 1998 to elect members of Cheltenham Borough Council in Gloucestershire, England. One third of the council was up for election and the Liberal Democrats stayed in overall control of the council.
The Broxbourne Council election, 1998 was held to elect council members of the Broxbourne Borough Council, the local government authority of the borough of Broxbourne, Hertfordshire, England.
The 1998 Hammersmith and Fulham Council election took place on 7 May 1998 to elect members of Hammersmith and Fulham London Borough Council in London, England. The whole council was up for election and the Labour party stayed in overall control of the council.
Elections for the London Borough of Merton were held on 5 May 1994 to elect members of Merton London Borough Council in London, England. This was on the same day as other local elections in England.