Bristol City Football Club is a professional association football club based in Bristol, England. The team compete in the EFL Championship, the second level of the English football league system.

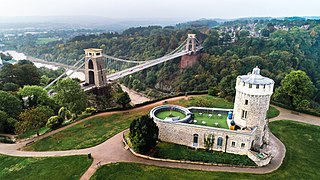
Bristol is a city, unitary authority area and ceremonial county in South West England, the most populous city in the region. Built around the River Avon, it is bordered by the ceremonial counties of Gloucestershire to the north and Somerset to the south. The county is in the West of England combined authority area, which includes the Greater Bristol area and nearby places such as Bath.

Bristol is a suburban city located in Hartford County, Connecticut, United States, 20 miles (32 km) southwest-west of Hartford. The city is also 120 miles southwest from Boston, and approximately 100 miles northeast of New York City. The city is part of the Naugatuck Valley Planning Region. As of the 2020 census, the population of the city was 61,844.

Bristol West is a borough constituency represented in the House of Commons of the Parliament of the United Kingdom since 2015 by Thangam Debbonaire of the Labour Party. It mostly covers the central and western parts of Bristol.

Bristol North West is a constituency represented in the House of Commons of the UK Parliament since 2017 by Darren Jones of the Labour Party.

Bristol East is a constituency recreated in 1983 covering the eastern part of the City of Bristol, represented in the House of Commons of the UK Parliament since 2005 by Kerry McCarthy of the Labour Party.
Bristol City Council is the local authority for Bristol, a unitary authority and ceremonial county in England. Until 1 April 1996 it was a non-metropolitan district in Avon. Since 2012 it has also had a directly elected mayor.

Bristol City Council is the local authority of Bristol, England. The council is a unitary authority. Bristol has 34 wards, electing a total of 70 councillors.

The 1992 Bristol City Council election took place on 7 May 1992 to elect members of Bristol City Council in England. This was on the same day as other local elections. One third of seats were up for election. Two seats were contested in Hartcliffe due to an extra vacancy occurring. The elections were held just weeks after John Major's unexpected 1992 General election victory, and mirroring that result there was a strong swing from Labour to Conservative.

The 1994 Bristol City Council election took place on 5 May 1994 to elect members of Bristol City Council in England. This was on the same day as other local elections. One third of seats were up for election. The Bristol Party was formed by Bristol Rovers fans to campaign for a new stadium for the club. There was a general swing from the Conservatives and Greens to the Liberal Democrats, reflecting the beginning of the Conservative decline nationally and also the Liberal Democrat recovery after the merger troubles.

The 1995 Bristol City Council election took place on 4 May 1995 with all seats being up for election, in preparation for Bristol City Council becoming a Unitary Authority following the abolition of Avon County Council. The same ward boundaries were used, however these are elections to a new authority and cannot be considered gains or losses compared to previously held seats.

The 2010 Bristol City Council elections were held on Thursday 6 May 2010, for 23 seats, that being one third of the total number of councillors. The Liberal Democrats, who had won overall control of the council in 2009, increased their majority to six seats.

The 2011 Bristol City Council elections were held on Thursday 5 May 2011, for 24 seats, that being one third of the total number of councillors. The Liberal Democrats, who had won overall control of the council in 2009 and increased their majority in 2010, experienced a drop in support and lost 5 seats; 4 to the Labour Party and 1 to the Green Party, which gained its second ever council seat in Bristol. This meant that the Lib Dems no longer had a majority on the council. However, they continued to run the council, relying on opposition groups to vote through any proposal.
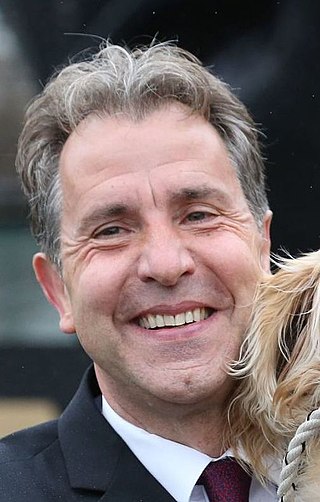
The Mayor of Bristol was the political leader of Bristol City Council. The mayor was a directly elected politician who, along with the 70 members of Bristol City Council, was responsible for the strategic government of the city of Bristol, England. The role was created after a local referendum held on 3 May 2012, which followed the passage of the Localism Act 2011. 41,032 voted for an elected mayor and 35,880 voted against, with a turnout of 24%. An election for the new post was held on 15 November 2012.

The 2014 Bristol City Council election took place on 22 May 2014 to elect members of Bristol City Council in England, as part of the United Kingdom 2014 Local Elections.

The 2016 Bristol City Council election took place on Thursday 5 May 2016, alongside nationwide local elections. Following a boundary review, the number of wards in the city was reduced to 34, with each electing one, two or three Councillors. The overall number of Councillors remained 70, with all seats up for election at the same time. Elections would then be held every 4 years.

The 1999 Bristol City Council election took place on 6 May 1999, on the same day as other local elections. All seats were up for election due to boundary changes, with each ward electing 2 councillors. The total number of seats on the council increased by 2 due to the creation of a new ward: Clifton East.

The 2021 West of England mayoral election was held on 6 May 2021 to elect the mayor of the West of England, on the same day as other local elections across the country. It was the second election for the role. The mayor was elected by the supplementary vote system.

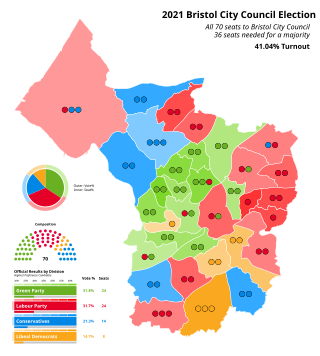
The 2021 Bristol City Council election took place on 6 May 2021 to elect members of Bristol City Council in England. It coincided with nationwide local elections. Voters in the city also voted for the mayor of Bristol, the mayor of the West of England and for Avon and Somerset's police and crime commissioner. The election was originally due to take place in May 2020, but was postponed due to the COVID-19 pandemic.


