| |||||||||||||||||||||||||||||||||||||||||||||||||||||||||||||||||||||||||||
14 out of 40 seats on the Rochford District Council 20 seats needed for a majority | |||||||||||||||||||||||||||||||||||||||||||||||||||||||||||||||||||||||||||
---|---|---|---|---|---|---|---|---|---|---|---|---|---|---|---|---|---|---|---|---|---|---|---|---|---|---|---|---|---|---|---|---|---|---|---|---|---|---|---|---|---|---|---|---|---|---|---|---|---|---|---|---|---|---|---|---|---|---|---|---|---|---|---|---|---|---|---|---|---|---|---|---|---|---|---|
|
Elections to Rochford Council were held on 7 May 1998. One third of the council was up for election and the Liberal Democrat party lost overall control of the council to no overall control. [1]
After the election, the composition of the council was
1998 Rochford District Council election | ||||||||||
---|---|---|---|---|---|---|---|---|---|---|
Party | This election | Full council | This election | |||||||
Seats | Net | Seats % | Other | Total | Total % | Votes | Votes % | +/− | ||
Liberal Democrats | 4 | 5 | 28.6 | 14 | 18 | 45.0 | 3,706 | 30.9 | ||
Labour | 5 | 1 | 35.7 | 7 | 12 | 30.0 | 3,230 | 26.9 | ||
Conservative | 4 | 4 | 28.6 | 2 | 6 | 15.0 | 4,363 | 36.4 | ||
Residents | 1 | 7.1 | 2 | 3 | 7.5 | 698 | 5.8 | |||
Independent | 0 | 0.0 | 1 | 1 | 2.5 | 0 | 0.0 |
Party | Candidate | Votes | % | ±% | |
---|---|---|---|---|---|
Liberal Democrats | S. Lemon | 510 | 61.2 | ||
Conservative | P. Savill | 189 | 22.7 | ||
Labour | R. Lushey | 135 | 16.2 | ||
Majority | 38.5 | ||||
Turnout | 25.9 | ||||
Liberal Democrats hold | Swing |
Party | Candidate | Votes | % | ±% | |
---|---|---|---|---|---|
Conservative | R. Adams | 467 | 36.3 | ||
Labour | D. Rossi | 420 | 32.7 | ||
Liberal Democrats | V. Howlett | 398 | 31.0 | ||
Majority | 3.7 | ||||
Turnout | 26.6 | ||||
Conservative gain from Liberal Democrats | Swing |
Party | Candidate | Votes | % | ±% | |
---|---|---|---|---|---|
Liberal Democrats | H. Glynn | 860 | 56.9 | ||
Conservative | T. Cutmore | 420 | 27.8 | ||
Labour | D. Thompson | 231 | 15.3 | ||
Majority | 29.1 | ||||
Turnout | 26.7 | ||||
Liberal Democrats hold | Swing |
Party | Candidate | Votes | % | ±% | |
---|---|---|---|---|---|
Residents | R. Vingoe | 698 | 77.7 | ||
Conservative | M. Mead | 132 | 14.7 | ||
Labour | L. Bain | 68 | 7.6 | ||
Majority | 63.0 | ||||
Turnout | 29.0 | ||||
Residents hold | Swing |
Party | Candidate | Votes | % | ±% | |
---|---|---|---|---|---|
Labour | D. Flack | 418 | 63.6 | ||
Conservative | J. Spillane | 239 | 36.4 | ||
Majority | 27.2 | ||||
Turnout | 21.2 | ||||
Labour hold | Swing |
Party | Candidate | Votes | % | ±% | |
---|---|---|---|---|---|
Labour | M. Stephenson | 314 | 66.1 | ||
Conservative | S. Spillane | 161 | 33.9 | ||
Majority | 32.2 | ||||
Turnout | 20.8 | ||||
Labour hold | Swing |
Party | Candidate | Votes | % | ±% | |
---|---|---|---|---|---|
Liberal Democrats | D. Helson | 466 | 43.0 | ||
Conservative | J. Mockford | 436 | 40.3 | ||
Labour | S. Walton | 181 | 16.7 | ||
Majority | 2.8 | ||||
Turnout | 24.0 | ||||
Liberal Democrats hold | Swing |
Party | Candidate | Votes | % | ±% | |
---|---|---|---|---|---|
Liberal Democrats | J. Helson | 324 | 44.2 | ||
Conservative | G. Mockford | 268 | 36.6 | ||
Labour | A. Popplewell | 141 | 19.2 | ||
Majority | 7.6 | ||||
Turnout | 25.2 | ||||
Liberal Democrats hold | Swing |
Party | Candidate | Votes | % | ±% | |
---|---|---|---|---|---|
Labour | J. Ford | 229 | 41.9 | ||
Liberal Democrats | P. Stanton | 175 | 32.0 | ||
Conservative | V. Keenan | 143 | 26.1 | ||
Majority | 9.9 | ||||
Turnout | 40.1 | ||||
Labour gain from Liberal Democrats | Swing |
Party | Candidate | Votes | % | ±% | |
---|---|---|---|---|---|
Labour | D. Ford | 370 | 66.3 | ||
Conservative | M. Shelley | 188 | 33.7 | ||
Majority | 32.6 | ||||
Turnout | 29.6 | ||||
Labour hold | Swing |
Party | Candidate | Votes | % | ±% | |
---|---|---|---|---|---|
Labour | D. Weir | 377 | 53.3 | ||
Conservative | R. Amner | 330 | 46.7 | ||
Majority | 6.6 | ||||
Turnout | 31.3 | ||||
Labour hold | Swing |
Party | Candidate | Votes | % | ±% | |
---|---|---|---|---|---|
Conservative | K. Gibbs | 372 | 47.0 | ||
Liberal Democrats | P. Pearse | 271 | 34.2 | ||
Labour | J. Fielding | 149 | 18.8 | ||
Majority | 12.8 | ||||
Turnout | 27.5 | ||||
Conservative gain from Liberal Democrats | Swing |
Party | Candidate | Votes | % | ±% | |
---|---|---|---|---|---|
Conservative | M. Webster | 478 | 52.6 | ||
Liberal Democrats | R. Swain | 344 | 37.8 | ||
Labour | D. Randall | 87 | 9.6 | ||
Majority | 14.7 | ||||
Turnout | 39.2 | ||||
Conservative gain from Liberal Democrats | Swing |
Party | Candidate | Votes | % | ±% | |
---|---|---|---|---|---|
Conservative | P. Webster | 540 | 53.6 | ||
Liberal Democrats | M. Hunnable | 358 | 35.5 | ||
Labour | M. Emmons | 110 | 10.9 | ||
Majority | 18.1 | ||||
Turnout | 37.1 | ||||
Conservative gain from Liberal Democrats | Swing |
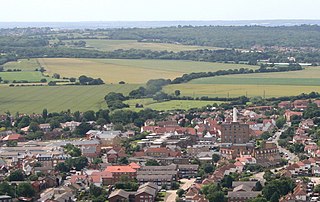
Rochford is a local government district in Essex, England. It is named after one of its main settlements, Rochford, where the council is based. The largest town in the district is Rayleigh. Other places in the district include Hockley, Ashingdon, Great Wakering, Canewdon and Hullbridge.
The 1998 Oldham Council election took place on 7 May 1998 to elect members of Oldham Metropolitan Borough Council in Greater Manchester, England. One third of the council was up for election and the Labour Party stayed in overall control of the council.
Elections to Rochford Council, Essex, England, were held on 6 May 1999. One third of the council was up for election and the council stayed under no overall control.
Elections to Rochford Council were held on 4 May 2000. One third of the council was up for election and the council stayed under no overall control.
The 2003 Woking Council election took place on 1 May 2003 to elect members of Woking Borough Council in Surrey, England. One third of the council was up for election and the council stayed under no overall control.
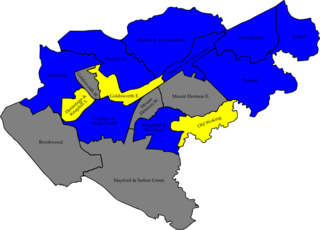
The 2007 Woking Council election took place on 3 May 2007 to elect members of Woking Borough Council in Surrey, England. One third of the council was up for election and the Conservative Party gained overall control of the council from no overall control.
The 2000 Winchester Council election took place on 4 May 2000 to elect members of Winchester District Council in Hampshire, England. One third of the council was up for election and the Liberal Democrats stayed in overall control of the council.
The 1998 Cheltenham Council election took place on 7 May 1998 to elect members of Cheltenham Borough Council in Gloucestershire, England. One third of the council was up for election and the Liberal Democrats stayed in overall control of the council.
The 1998 Pendle Borough Council election took place on 7 May 1998 to elect members of Pendle Borough Council in Lancashire, England. One third of the council was up for election and the Liberal Democrats stayed in overall control of the council.
The 1998 Islington Council election took place on 7 May 1998 to elect members of Islington London Borough Council in London, England. The whole council was up for election and the Labour Party lost overall control of the council to no overall control.
The 1998 Hackney London Borough Council election took place on 7 May 1998. All 60 members of Hackney London Borough Council were up for election. The elections took place as part of the 1998 London local elections.
The 1994 Hammersmith and Fulham Borough Council election took place on 5 May 1994 to elect members of Hammersmith and Fulham London Borough Council in London, England. The whole council was up for election and the Labour Party regained overall control of the council, which it had lost during the previous council term.
The 1998 West Oxfordshire District Council election took place on 7 May 1998 to elect members of West Oxfordshire District Council in Oxfordshire, England. One third of the council was up for election and the council stayed under no overall control.
The 2004 West Oxfordshire District Council election took place on 10 June 2004 to elect members of West Oxfordshire District Council in Oxfordshire, England. One third of the council was up for election and the Conservative Party stayed in overall control of the council.
The 2006 West Oxfordshire District Council election took place on 4 May 2006 to elect members of West Oxfordshire District Council in Oxfordshire, England. One third of the council was up for election and the Conservative Party stayed in overall control of the council.
Elections for the London Borough of Merton were held on 2 May 2002. This was on the same day as other local elections in England. These elections were held under new ward boundaries, which increased the number of councillors to sixty from fifty-seven. Labour remained in overall control of the council with a reduced majority.
The 2018 Rochford District Council election took place on 3 May 2018 to elect members of Rochford District Council in England. This was on the same day as other local elections.
The 1993 Berkshire County Council election was held on 6 May 1993, at the same time as other local elections across England and Wales. All of Berkshire County Council's 76 seats were up for election.
The 2023 Rochford District Council election took place on 4 May 2023 to elect members of Rochford District Council in Essex, England. This would be on the same day as other local elections in England.
The 2024 Rochford District Council election took place on 2 May 2024 to elect members of Rochford District Council in Essex, England. This was on the same day as other local elections.