1981 Essex County Council election

Last updated

1981 Essex County Council election
Flag of Essex.svg
  1977 7 May 1981 (1981-05-07) 1985  

All 98 seats to Essex County Council
50 seats needed for a majority
 First partySecond party
  No image wide.svg No image wide.svg
Party Conservative Labour
Seats won5132
Seat changeDecrease2.svg17Increase2.svg12
Popular vote197,573158,500
Percentage42.5%32.7%
SwingDecrease2.svg19.4%Increase2.svg7.5%

 Third partyFourth party
  No image wide.svg No image wide.svg
Party Liberal Residents
Seats won132
Seat changeIncrease2.svg11Increase2.svg2
Popular vote91,5033,680
Percentage19.7%0.8%
SwingIncrease2.svg11.0%Decrease2.svg0.3%

Essex County Council election results 1981.svg
Results of the 1981 Essex County Council election.

Council control before election


Conservative

Council control after election


Conservative

The 1981 Essex County Council election was held on 7 May 1981 to elect members of Essex County Council in Essex, England. This was on the same day as other local elections.

Contents

Summary

1981 Essex County Council election [1] [2]
PartySeatsGainsLossesNet gain/lossSeats %Votes %Votes+/−
  Conservative 51012Decrease2.svg 3252.042.5197,461–19.5
  Labour 3260Increase2.svg 2032.734.1158,981+7.5
  Liberal 1360Increase2.svg 1113.319.790,891+10.8
  Residents 200Increase2.svg 22.01.25,556+0.1
  Independent 000Steady2.svg0.01.15,335+0.2
  SDP 000Steady2.svg0.00.52,097N/A
  Ind. Conservative 000Steady2.svg0.00.31,342N/A
  Ecology 000Steady2.svg0.00.21,122N/A
  Ind. Labour Party 000Steady2.svg0.00.2973N/A
  New Britain 000Steady2.svg0.0<0.1160N/A
Total98462,244

Division results

Basildon

Basildon District Summary
PartySeats+/-Votes%+/-
Labour 6Increase2.svg 319,75242.9+11.9
Conservative 3Decrease2.svg 214,05930.6–22.0
Residents 1Increase2.svg 13,8738.4–1.5
Liberal 0Steady2.svg7,24915.8+11.9
Ind. Conservative 0Steady2.svg9072.0N/A
Ecology 0Steady2.svg1650.4N/A
Total10Increase2.svg246,00541.5–5.2

Division results

Basildon Crouch
PartyCandidateVotes%
Conservative R. Marshall 1,387 34.0
Labour R. Reed99024.2
Ind. Conservative F. Stark90722.2
Liberal P. Ferriss76418.7
Ecology C. Oppenheim350.9
Majority3979.7
Turnout 4,08346.3
Registered electors 8,815
Conservative win (new seat)
Basildon Fryerns
PartyCandidateVotes%
Labour W. Archibald 2,589 68.4
Conservative G. Willett61716.3
Liberal M. Chambers49913.2
Residents P. Baker802.1
Majority1,97252.1
Turnout 3,78534.5
Registered electors 10,968
Labour win (new seat)
Basildon Gloucester Park
PartyCandidateVotes%
Labour J. Costello 3,691 67.6
Liberal J. White95217.4
Conservative R. Sheridan81923.6
Majority2,73950.1
Turnout 5,46243.4
Registered electors 12,585
Labour win (new seat)
Basildon Laindon
PartyCandidateVotes%
Labour R. Bolt 1,490 42.9
Liberal R. Payne1,16333.5
Conservative E. Lane81923.6
Majority3279.4
Turnout 3,47240.9
Registered electors 8,479
Labour win (new seat)
Basildon Pitsea
PartyCandidateVotes%
Labour R. Oliver 3,151 61.7
Conservative E. Dines1,37026.8
Liberal R. Hawksworth58911.5
Majority1,79134.9
Turnout 5,11037.9
Registered electors 13,475
Labour win (new seat)
Basildon Vange
PartyCandidateVotes%
Labour G. Miller 3,178 65.3
Conservative A. White94919.5
Liberal J. Bell61312.6
Ecology G. Thomas1302.7
Majority2,22945.8
Turnout 4,87037.2
Registered electors 13,100
Labour win (new seat)
Basildon Westley Heights
PartyCandidateVotes%
Labour C. Maxey 2,080 43.9
Conservative M. Ilesley1,59133.6
Liberal L. Williams1,06222.4
Majority48910.3
Turnout 4,73344.1
Registered electors 10,727
Labour win (new seat)
Billericay North
PartyCandidateVotes%
Conservative L. Greenfield 2,600 53.1
Residents T. Stansfield1,91739.1
Labour T. Wilson3817.8
Majority68313.9
Turnout 4,89847.8
Registered electors 10,240
Conservative win (new seat)
Billericay South
PartyCandidateVotes%
Residents H. Wilkins 1,876 34.9
Conservative G. Jones1,76432.8
Labour C. Lynch91317.0
Liberal D. Chapman82615.4
Majority1122.1
Turnout 5,37942.9
Registered electors 12,553
Residents win (new seat)
Wickford
PartyCandidateVotes%
Conservative E. Mickleborough 2,143 50.9
Labour W. Primmer1,28930.6
Liberal G. Palmer78118.5
Majority85420.3
Turnout 4,21342.1
Registered electors 9,998
Conservative win (new seat)

Braintree

Braintree District Summary
PartySeats+/-Votes%+/-
Conservative 5Decrease2.svg 216,19645.1–16.7
Labour 1Increase2.svg 113,50937.6+10.1
Liberal 1Increase2.svg 16,20217.3+7.1
Total7Steady2.svg35,90743.4+4.0

Division results

Bocking
PartyCandidateVotes%±%
Conservative O. Sebag-Montefiore 2,208 39.0 –12.0
Labour J. Hall2,17738.4+5.6
Liberal J. Ross1,27922.6+6.4
Majority310.5–17.7
Turnout 5,66448.0+6.2
Registered electors 11,802
Conservative hold Swing Decrease2.svg8.8
Braintree East
PartyCandidateVotes%
Conservative Robert Dixon-Smith 2,167 39.3
Labour M. Oliver1,77432.2
Liberal P. Keeling1,57128.5
Majority3937.1
Turnout 5,51245.1
Registered electors 12,233
Conservative win (new seat)
Braintree West
PartyCandidateVotes%
Liberal D. Grice 2,166 37.6
Conservative J. Amies2,12236.8
Labour M. Shirvington1,47325.6
Majority440.8
Turnout 5,76146.9
Registered electors 12,295
Liberal win (new seat)
Halstead
PartyCandidateVotes%±%
Conservative O. Joyce 2,923 57.8 –15.9
Labour R. Dixey2,13142.2+15.9
Majority79215.7–31.6
Turnout 5,05442.0+0.6
Registered electors 12,037
Conservative hold Swing Decrease2.svg15.9
Hedingham
PartyCandidateVotes%±%
Conservative G. Waterer 2,826 64.8 N/A
Labour W. Alston1,53335.2N/A
Majority1,29329.7N/A
Turnout 4,35939.8N/A
Registered electors 10,946
Conservative hold Swing N/A
Witham Northern
PartyCandidateVotes%
Labour J. Lyon 2,323 44.1
Conservative J. Allan1,75733.4
Liberal A. Slowman1,18622.5
Majority56610.7
Turnout 5,26643.5
Registered electors 12,116
Labour win (new seat)
Witham Southern
PartyCandidateVotes%
Conservative D. Willetts 2,193 51.1
Labour C. Foy2,09848.9
Majority952.2
Turnout 4,29138.2
Registered electors 11,241
Conservative win (new seat)

Brentwood

Brentwood District Summary
PartySeats+/-Votes%+/-
Conservative 5Increase2.svg 113,14452.2–18.2
Labour 0Steady2.svg6,17624.5–1.6
Liberal 0Steady2.svg5,87123.3+20.1
Total5Increase2.svg125,19145.8+1.7

Division results

Brentwood Central
PartyCandidateVotes%±%
Conservative M. Hutton 2,262 48.2 –17.7
Liberal A. Longman1,26224.3+13.4
Labour D. Edwards98518.9+4.3
Majority1,00018.6–31.8
Turnout 4,50945.7+5.2
Registered electors 10,270
Conservative hold Swing Decrease2.svg15.6
Brentwood Hutton
PartyCandidateVotes%±%
Conservative A. Donnelly 2,956 56.8 –24.1
Liberal O. Hall1,26224.3N/A
Labour D. Wacey98518.9+1.2
Majority1,69432.6–30.6
Turnout 5,20344.1+2.2
Registered electors 11,790
Conservative hold
Brentwood North
PartyCandidateVotes%±%
Conservative L. Jago 2,230 52.3 –26.3
Labour L. Southgate1,04424.5+3.1
Liberal N. Amor98723.2N/A
Majority1,18627.8−29.4
Turnout 4,26144.9+3.5
Registered electors 9,486
Conservative hold Swing Decrease2.svg14.7
Brentwood Rural
PartyCandidateVotes%
Conservative D. Jones 3,106 57.2
Liberal R. Sullivan1,58129.1
Labour L. Nicholas74213.7
Majority1,52528.1
Turnout 5,42945.1
Registered electors 12,026
Conservative win (new seat)
Brentwood South
PartyCandidateVotes%±%
Conservative J. Hayward 2,590 44.7
Labour J. Reddell2,42041.8
Liberal M. Dwyer77913.5
Majority1702.9
Turnout 5,78950.6
Registered electors 11,439
Conservative hold Swing

Castle Point

Castle Point District Summary
PartySeats+/-Votes%+/-
Conservative 4Decrease2.svg 111,77046.8–24.5
Labour 2Increase2.svg 28,28032.9+7.4
Liberal 0Steady2.svg3,62814.4+11.2
SDP 0Steady2.svg1,4605.8N/A
Total6Increase2.svg125,13839.4+0.9

Division results

Benfleet
PartyCandidateVotes%±%
Conservative J. Pike 2,223 53.1
Labour C. Prentice1,02224.4
Liberal T. Atkin93922.4
Majority1,20128.7
Turnout 4,18442.6
Registered electors 9,827
Conservative hold Swing
Canvey Island East
PartyCandidateVotes%±%
Labour D. Nisbet 1,782 40.5 +11.1
Conservative W. Ashworth1,70738.8–31.8
SDP A. Bennett91220.7N/A
Majority751.7N/A
Turnout 4,40133.3+3.8
Registered electors 13,215
Labour gain from Conservative Swing Increase2.svg21.5
Canvey Island West
PartyCandidateVotes%±%
Labour D. Shaw 2,081 47.4 +11.3
Conservative F. Wood1,34530.7–16.2
SDP M. Perrin54812.5N/A
Liberal N. Chitty4139.4–7.6
Majority73616.8N/A
Turnout 4,38734.9–3.5
Registered electors 12,571
Labour gain from Conservative Swing Increase2.svg13.8
Great Tarpots
PartyCandidateVotes%
Conservative W. Brum 1,700 43.8
Labour G. Auvache1,49538.5
Liberal R. Michel68417.6
Majority2055.3
Turnout 3,87939.4
Registered electors 9,846
Conservative win (new seat)
Hadleigh
PartyCandidateVotes%±%
Conservative R. Williams 2,607 61.8
Liberal D. Newton86020.4
Labour P. Ottino75417.9
Majority1,74741.4
Turnout 4,22146.4
Registered electors 9,099
Conservative hold Swing
Thundersley
PartyCandidateVotes%±%
Conservative J. Meggison 2,188 53.8
Labour J. Amey1,14628.2
Liberal W. Penny73218.0
Majority1,04225.6
Turnout 4,06643.7
Registered electors 9,295
Conservative hold Swing

Chelmsford

Chelmsford District Summary
PartySeats+/-Votes%+/-
Liberal 5Increase2.svg 520,28842.9+19.2
Conservative 4Decrease2.svg 419,43141.1–16.9
Labour 0Steady2.svg7,53915.9–1.7
Independent 0Steady2.svg420.1–0.5
Total9Increase2.svg147,30045.8+2.9

Division results

Broomfield & Writtle
PartyCandidateVotes%
Conservative B. Platt 2,635 51.6
Liberal J. Gumbleton1,37226.9
Labour J. Bliss1,10221.6
Majority1,26324.7
Turnout 5,10948.8
Registered electors 10,476
Conservative win (new seat)
Chelmsford East
PartyCandidateVotes%±%
Liberal A. Knight 3,041 53.7 +12.2
Conservative J. Aberdour1,95234.5–16.8
Labour C. Playford66811.8+4.6
Majority1,08919.2N/A
Turnout 5,66144.3–6.7
Registered electors 12,784
Liberal gain from Conservative Swing Increase2.svg14.5
Chelmsford North
PartyCandidateVotes%±%
Liberal T. Smith-Hughes 2,828 56.4 +41.9
Conservative E. King1,30926.1–20.3
Labour S. McEvaddy87517.5–21.6
Majority1,51930.3N/A
Turnout 5,01248.9+8.0
Registered electors 10,258
Liberal gain from Conservative Swing Increase2.svg31.1
Chelmsford South
PartyCandidateVotes%±%
Liberal R. Harmer 2,488 45.6 +33.9
Conservative E. Coker2,13939.2–30.5
Labour A. Longden82715.2–3.4
Majority3496.4N/A
Turnout 5,45449.3+12.1
Registered electors 11,057
Liberal gain from Conservative Swing Increase2.svg32.2
Chelmsford West
PartyCandidateVotes%±%
Liberal D. Ridgewell 2,530 50.5 +11.9
Conservative P. Martin1,38927.7–16.9
Labour C. Cronin1,09521.8+5.0
Majority1,14122.8N/A
Turnout 5,01450.3+8.7
Registered electors 9,971
Liberal gain from Conservative Swing Increase2.svg14.4
Great Baddow
PartyCandidateVotes%±%
Liberal J. Beard 2,469 49.4
Conservative C. Ince1,85837.2
Labour D. Shinn63112.6
Independent T. Wilson420.8
Majority61112.2
Turnout 5,00047.9
Registered electors 10,441
Liberal gain from Conservative Swing
Springfield
PartyCandidateVotes%
Conservative H. How 2,587 46.3
Liberal J. Burgess2,15338.6
Labour S. Clark84415.1
Majority4347.8
Turnout 5,58444.8
Registered electors 12,478
Conservative win (new seat)
Stock
PartyCandidateVotes%
Conservative P. White 3,154 53.5
Liberal E. Clark1,70929.0
Labour K. Bliss1,03317.5
Majority1,44524.5
Turnout 5,89641.8
Registered electors 14,116
Conservative win (new seat)
Woodham Ferrers & Danbury
PartyCandidateVotes%
Conservative D. Chatfield 2,408 52.7
Liberal M. Bender1,69837.2
Labour K. Skeates46410.2
Majority71015.5
Turnout 4,57038.8
Registered electors 11,780
Conservative win (new seat)

Colchester

Colchester District Summary
PartySeats+/-Votes%+/-
Conservative 5Decrease2.svg 219,45649.8–18.2
Labour 4Increase2.svg 316,43142.0+14.3
Liberal 0Steady2.svg2,6466.8+2.4
Ecology 0Steady2.svg5591.4N/A
Total9Increase2.svg139,09239.1–1.8

Division results

Constable
PartyCandidateVotes%
Conservative G. Hickson 2,947 70.2
Labour J. Kent1,25329.8
Majority1,69440.4
Turnout 4,20041.9
Registered electors 10,021
Conservative win (new seat)
Drury
PartyCandidateVotes%
Conservative D. Lamberth 2,988 51.0
Liberal Martin Hunt1,73829.7
Labour C. Graves1,12819.3
Majority1,25021.4
Turnout 5,85446.5
Registered electors 12,600
Conservative win (new seat)
Maypole
PartyCandidateVotes%
Labour J. Fraser 2,167 52.8
Conservative W. Foster1,02725.0
Liberal William Spyvee90822.1
Majority1,14027.8
Turnout 4,10235.3
Registered electors 11,636
Labour win (new seat)
Mersea & Stanway
PartyCandidateVotes%
Conservative R. Fairhead 3,247 71.0
Labour K. Taylor1,03522.6
Ecology G. Cox2926.4
Majority2,21248.4
Turnout 4,57439.5
Registered electors 11,589
Conservative win (new seat)
Old Heath
PartyCandidateVotes%
Labour J. Coombes 2,707 60.7
Conservative A. Steggall1,48933.4
Ecology M. Baker2676.0
Majority1,21827.3
Turnout 4,46339.7
Registered electors 11,255
Labour win (new seat)
Park
PartyCandidateVotes%
Conservative E. Gawthrop 2,196 51.4
Labour J. Hills2,07348.6
Majority1232.9
Turnout 4,26942.0
Registered electors 10,162
Conservative win (new seat)
Parsons Heath
PartyCandidateVotes%
Labour Kent 2,238 52.2
Conservative Roots2,04647.8
Majority1924.5
Turnout 4,28441.5
Registered electors 10,312
Labour win (new seat)
Tiptree division
PartyCandidateVotes%
Conservative F. Thornton 2,077 60.7
Labour T. Morecroft1,34639.3
Majority73121.4
Turnout 3,35330.7
Registered electors 11,148
Conservative win (new seat)
Wivenhoe St Andrew division
PartyCandidateVotes%
Labour H. Bryan 2,485 63.3
Conservative E. Jennings1,43936.8
Majority1,04626.7
Turnout 3,92435.4
Registered electors 11,100
Labour win (new seat)

Epping Forest

Epping Forest District Summary
PartySeats+/-Votes%+/-
Conservative 5Decrease2.svg 419,31751.1–20.9
Labour 2Increase2.svg 212,09632.0+7.5
Residents 1Increase2.svg 11,6834.5N/A
Liberal 0Steady2.svg4,52712.0+8.5
Ecology 0Steady2.svg1590.4N/A
Total8Decrease2.svg 137,78243.0+2.8

Division results

Buckhurst Hill
PartyCandidateVotes%±%
Conservative B. Cox 2,523 58.0
Labour B. Mooney97222.4
Liberal G. Chapman85319.6
Majority1,55135.7
Turnout 4,34840.4
Registered electors 10,751
Conservative hold Swing
Chigwell
PartyCandidateVotes%±%
Conservative S. Barnett 2,347 69.7
Liberal G. West52115.5
Labour L. Timson49914.8
Majority1,82654.2
Turnout 3,36737.0
Registered electors 9,112
Conservative hold Swing
Epping
PartyCandidateVotes%±%
Conservative R. Daniels 2,822 53.8
Labour M. Jackson1,44027.4
Liberal R. Eveling82815.8
Ecology R. Boenke1593.0
Majority1,38226.3
Turnout 5,24943.4
Registered electors 12,084
Conservative hold Swing
Loughton St. John's
PartyCandidateVotes%
Labour F. Davis 1,937 47.4
Conservative D. Brady1,70441.7
Liberal W. Randall44510.9
Majority2335.7
Turnout 4,08639.2
Registered electors 10,419
Labour win (new seat)
Loughton St. Mary's
PartyCandidateVotes%
Residents H. Kleyn 1,683 34.8
Conservative L. Welch1,57332.5
Labour L. Baddock1,30026.9
Liberal L. Martin2845.9
Majority1102.3
Turnout 4,84047.0
Registered electors 10,305
Residents win (new seat)
North Weald & Nazeing
PartyCandidateVotes%
Conservative G. Padfield 2,793 61.8
Labour D. Grenville-Brown1,14425.3
Liberal T. Owen58212.9
Majority1,64936.5
Turnout 4,51945.2
Registered electors 9,987
Conservative win (new seat)
Ongar
PartyCandidateVotes%
Conservative J. Martin 3,035 54.7
Labour F. Davy1,50127.0
Liberal D. Jacobs1,01418.3
Majority1,53427.6
Turnout 5,55049.4
Registered electors 11,245
Conservative win (new seat)
Waltham Abbey
PartyCandidateVotes%±%
Labour C. Hewins 3,303 56.7 +10.3
Conservative G. Jailler2,52043.3–10.3
Majority78313.4N/A
Turnout 5,82341.8–2.3
Registered electors 13,939
Labour gain from Conservative Swing Increase2.svg10.8

Harlow

Harlow District Summary
PartySeats+/-Votes%+/-
Labour 5Increase2.svg 114,43658.5+9.4
Conservative 0Decrease2.svg 15,11920.8–17.7
Liberal 0Steady2.svg4,71619.1+7.1
Independent 0Steady2.svg3891.6+1.2
Total5Steady2.svg24,66042.0+2.9

Division results

Great Parndon
PartyCandidateVotes%±%
Labour S. Warner 2,510 53.7 +7.9
Conservative L. Atkins1,16124.9–17.3
Liberal L. Swanton61013.1+1.1
Independent C. Johnson3898.3N/A
Majority1,34928.9+25.3
Turnout 4,67039.1+0.3
Registered electors 11,941
Labour hold Swing Increase2.svg12.6
Harlow & Mark Hall
PartyCandidateVotes%±%
Labour S. Anderson 2,589 58.7 +9.9
Conservative P. Moulds1,37028.0–17.2
Liberal P. Ramsay92719.0+7.2
Majority1,21924.9N/A
Turnout 4,88644.5–2.1
Registered electors 10,983
Labour gain from Conservative Swing Increase2.svg13.6
Harlow Common
PartyCandidateVotes%±%
Labour W. Gibson 2,887 58.7 +4.4
Liberal E. Scammell1,17323.8+15.3
Conservative M. Tombs86217.5–17.4
Majority1,71434.8+15.4
Turnout 4,92242.8+4.0
Registered electors 11,491
Labour hold Swing Decrease2.svg5.5
Little Parndon & Town Centre
PartyCandidateVotes%±%
Labour E. Morris 2,878 60.3 +9.6
Liberal J. Bastick1,00721.1+6.6
Conservative E. Atkins88518.6–16.2
Majority1,87139.2+23.2
Turnout 4,77041.6+2.8
Registered electors 11,470
Labour hold Swing Increase2.svg1.5
Netteswellbury
PartyCandidateVotes%±%
Labour J. Desormeaux 3,572 66.0 +10.1
Liberal S. Ward99918.5+4.3
Conservative P. Harries84115.5–14.4
Majority2,57347.5+21.5
Turnout 5,41242.1+3.2
Registered electors 12,856
Labour hold Swing Increase2.svg2.9

Maldon

Maldon District Summary
PartySeats+/-Votes%+/-
Conservative 3Steady2.svg7,21844.9–20.0
Liberal 0Steady2.svg5,11431.8+23.6
Labour 0Steady2.svg3,75623.3+0.1
Total3Steady2.svg16,08845.5+1.1

Division results

Maldon
PartyCandidateVotes%±%
Conservative K. Nolan 2,257 42.0 –12.8
Liberal P. Lacey1,70231.6+13.4
Labour C. Tait1,42126.4–0.6
Majority55510.3–17.4
Turnout 5,38047.4+6.7
Registered electors 11,360
Conservative hold Swing Decrease2.svg13.1
Southminster
PartyCandidateVotes%±%
Conservative D. Garston 2,230 46.2 N/A
Labour R. Brown1,61033.4N/A
Liberal N. Baker98620.4N/A
Majority6206.9N/A
Turnout 4,82643.3N/A
Registered electors 12,437
Conservative hold Swing N/A
Tollesbury
PartyCandidateVotes%±%
Conservative E. Peel 2,731 46.4 –26.8
Liberal J. Tilley2,42641.2+34.5
Labour M. Holland72512.3–7.8
Majority3055.2–47.9
Turnout 5,88250.8+2.7
Registered electors 11,576
Conservative hold Swing Decrease2.svg30.7

Rochford

Rochford District Summary
PartySeats+/-Votes%+/-
Conservative 3Decrease2.svg 211,15451.8–10.5
Labour 1Increase2.svg 16,74631.4+12.1
Liberal 1Increase2.svg 12,68612.5+8.0
Independent 0Steady2.svg9284.3–9.6
Total5Steady2.svg21,51438.3–1.6

Division results

Rayleigh North
PartyCandidateVotes%±%
Liberal R. Boyd 2,120 43.9 +29.0
Conservative R. Foster2,00741.6–25.8
Labour C. Barnaby70214.5–3.2
Majority1132.3N/A
Turnout 4,82945.4+6.9
Registered electors 10,626
Liberal gain from Conservative Swing Increase2.svg27.4
Rayleigh South
PartyCandidateVotes%±%
Conservative T. Murray 1,876 41.8 –9.7
Labour S. Andre1,11824.9+10.7
Independent S. Silva92820.7–5.6
Liberal D. Ward56612.6+4.6
Majority75816.9–8.3
Turnout 4,48838.0–3.7
Registered electors 11,812
Conservative hold Swing Decrease2.svg10.2
Rochford North
PartyCandidateVotes%±%
Conservative T. Fawell 2,505 63.7 +9.5
Labour M. Weir1,42936.3N/A
Majority1,07627.4+19.1
Turnout 3,93435.1–0.6
Registered electors 11,812
Conservative hold Swing N/A
Rochford South
PartyCandidateVotes%±%
Labour D. Weir 2,118 50.3 +16.0
Conservative D. Wood2,09049.7–16.0
Majority280.7N/A
Turnout 4,20840.0–4.3
Registered electors 10,507
Labour gain from Conservative Swing Increase2.svg16.0
Rochford West
PartyCandidateVotes%±%
Conservative J. Jones 2,676 66.0 –6.3
Labour A. Malcolm1,37934.0+6.3
Majority1,29732.0–12.7
Turnout 4,05535.4–4.4
Registered electors 11,456
Conservative hold Swing Decrease2.svg6.3

Southend

Southend District Summary
PartySeats+/-Votes%+/-
Conservative 6Decrease2.svg 522,34543.9–20.6
Liberal 4Increase2.svg 215,30530.1+10.5
Labour 1Increase2.svg 111,77523.1+7.3
Independent 0Steady2.svg9861.9+1.8
Ind. Conservative 0Steady2.svg3050.6N/A
New Britain 0Steady2.svg1600.3N/A
Total11Decrease2.svg250,87640.5+2.1

Division results

Belfairs & Blenheim
PartyCandidateVotes%
Conservative N. Clarke 2,183 53.3
Liberal J. Hugill1,25430.6
Labour H. Hurst65716.0
Majority92922.7
Turnout 4,09437.1
Registered electors 11,047
Conservative win (new seat)
Chalkwell
PartyCandidateVotes%±%
Conservative N. Harris 2,316 50.6
Liberal J. Keith1,85440.5
Labour T. Hughes4048.8
Majority46210.1
Turnout 4,57441.3
Registered electors 11,080
Conservative hold Swing
Eastwood
PartyCandidateVotes%±%
Liberal N. Goodman 1,784 46.0
Conservative J. Innocent1,65642.7
Labour A. Dunn43611.2
Majority1283.3
Turnout 3,87637.7
Registered electors 10,276
Liberal gain from Conservative Swing
Leigh
PartyCandidateVotes%±%
Liberal A. Crystall 2,719 49.2
Conservative D. Roach2,50145.2
Labour L. Davidson2745.0
Independent M. Roffey350.6
Majority2183.9
Turnout 5,52949.5
Registered electors 11,177
Liberal hold Swing
Milton
PartyCandidateVotes%
Conservative D. Wilson 1,700 39.7
Labour J. Hodgkins1,40732.8
Independent M. Burstin87220.4
Ind. Conservative A. Anderson Wright3057.1
Majority2936.8
Turnout 4,28435.0
Registered electors 12,254
Conservative win (new seat)
Prittlewell
PartyCandidateVotes%±%
Liberal J. Sargent 2,391 46.8
Conservative P. Bone1,79435.1
Labour B. White92418.1
Majority59711.7
Turnout 5,10941.8
Registered electors 12,233
Liberal hold Swing
Shoebury
PartyCandidateVotes%±%
Conservative D. Cotgrove 2,126 45.9
Labour R. Copley1,70836.9
Liberal B. Ayling71815.5
Independent H. Connigale791.7
Majority4189.0
Turnout 4,63141.3
Registered electors 11,200
Conservative hold Swing
Southchurch
PartyCandidateVotes%
Conservative D. Garston 2,230 46.2
Labour R. Brown1,61033.4
Liberal N. Baker98620.4
Majority62012.8
Turnout 4,82641.3
Registered electors 11,689
Conservative win (new seat)
Thorpe
PartyCandidateVotes%±%
Conservative H. Hill 2,545 60.9
Labour L. Crabtree97723.4
Liberal V. Macfarlane50012.0
New Britain J. Webb1603.8
Majority1,56837.5
Turnout 4,18237.5
Registered electors 11,215
Conservative hold Swing
Victoria
PartyCandidateVotes%
Labour R. Kennedy 2,160 50.7
Conservative A. Fuller1,17127.5
Liberal J. Palmer92721.8
Majority98923.2
Turnout 4,25836.4
Registered electors 11,708
Labour win (new seat)
Westborough
PartyCandidateVotes%
Liberal M. Lubel 2,172 39.4
Conservative R. Marriott2,12338.5
Labour K. Leaman1,21822.1
Majority490.9
Turnout 5,51346.5
Registered electors 11,846
Liberal win (new seat)

Tendring

Tendring District Summary
PartySeats+/-Votes%+/-
Conservative 4Decrease2.svg 416,77944.1–24.6
Labour 2Increase2.svg 210,93928.8+6.2
Liberal 2Increase2.svg 28,95523.6+15.0
SDP 0Steady2.svg5741.5N/A
Independent 0Steady2.svg4861.3N/A
Ecology 0Steady2.svg1420.4N/A
Ind. Conservative 0Steady2.svg1300.3N/A
Total8Steady2.svg32,45037.3±0.0

Division results

Brightlingsea
PartyCandidateVotes%±%
Liberal Thomas Dale 2,543 51.4 +20.0
Conservative R. Petherick1,56431.6–21.2
Labour B. Westover68813.9–1.9
Independent E. Ketley1523.1N/A
Majority97919.8N/A
Turnout 4,94744.2+3.4
Registered electors 11,180
Liberal gain from Conservative Swing Increase2.svg20.6
Clacton East
PartyCandidateVotes%
Conservative J. Story 2,858 55.5
Liberal T. Jeffrey1,48428.8
Labour L. Jacobs81215.8
Majority1,37426.7
Turnout 5,15442.9
Registered electors 12,028
Conservative win (new seat)
Clacton North
PartyCandidateVotes%
Liberal G. Waterfield 1,657 38.7
Conservative C. Jessop1,32831.0
Labour N. Jacobs1,16427.2
Ind. Conservative T. Staigl1303.0
Majority3297.7
Turnout 4,27941.9
Registered electors 10,605
Liberal win (new seat)
Clacton West
PartyCandidateVotes%
Labour R. Smith 1,965 41.0
Conservative H. Harvey-Williams1,73936.3
Liberal R. Huse1,08322.6
Majority2264.7
Turnout 4,78739.3
Registered electors 12,174
Labour win (new seat)
Frinton & Walton
PartyCandidateVotes%±%
Conservative D. Rex 3,238 60.4 –24.6
Liberal R. Hamilton1,19122.2+16.0
Labour T. Rowlands93517.4+8.6
Majority2,04738.2–38.0
Turnout 5,36441.8+6.8
Registered electors 12,839
Conservative hold Swing Decrease2.svg20.3
Harwich
PartyCandidateVotes%±%
Labour R. Knight 2,414 45.3 +18.1
Conservative W. Bleakley2,15040.4–32.4
SDP G. Turner57410.8N/A
Independent D. Pallett1873.5N/A
Majority2645.0N/A
Turnout 5,32546.6+9.2
Registered electors 11,418
Labour gain from Conservative Swing Increase2.svg25.3
Tendring Rural East
PartyCandidateVotes%
Conservative C. Lumber 2,059 59.8
Labour I. Bayles Kay1,38240.2
Majority67719.7
Turnout 3,44134.7
Registered electors 9,923
Conservative win (new seat)
Tendring Rural West
PartyCandidateVotes%
Conservative H. Varney 1,843 39.1
Labour P. Shearman1,57933.5
Liberal R. Taylor99721.2
Independent S. Rhodes1473.1
Ecology J. Boud1423.0
Majority2645.6
Turnout 4,70845.4
Registered electors 10,365
Conservative win (new seat)

Thurrock

Thurrock District Summary
PartySeats+/-Votes%+/-
Labour 8Increase2.svg 422,05463.5+22.0
Conservative 0Decrease2.svg 510,63330.6–18.2
Ind. Labour Party 0Steady2.svg9732.8N/A
Liberal 0Steady2.svg8852.6–5.3
Ecology 0Steady2.svg970.3N/A
SDP 0Steady2.svg630.2N/A
Total8Decrease2.svg134,70535.3–0.3

Division results

Chadwell
PartyCandidateVotes%±%
Labour G. Watts 3,020 75.8
Conservative G. Law96424.2
Majority2,05651.6
Turnout 3,98432.8
Registered electors 12,159
Labour hold Swing
Corringham
PartyCandidateVotes%±%
Labour B. Theobald 2,369 61.2
Conservative L. Moir1,50438.8
Majority86522.3
Turnout 3,87336.6
Registered electors 10,569
Labour gain from Conservative Swing
Grays Thurrock
PartyCandidateVotes%±%
Labour T. Codley 2,269 45.1
Conservative D. Dimond2,09041.6
Liberal A. Senior60412.0
SDP S. Ahmed631.3
Majority1793.6
Turnout 5,02640.3
Registered electors 12,480
Labour gain from Conservative Swing
Orsett & Stiffod
PartyCandidateVotes%±%
Labour J. Pollard 2,703 52.8
Conservative L. Green2,41747.2
Majority2865.6
Turnout 5,12044.8
Registered electors 11,416
Labour gain from Conservative Swing
South Ockendon
PartyCandidateVotes%±%
Labour G. Miles 3,413 80.2
Conservative F. Beasley84519.8
Majority2,56860.3
Turnout 2,56835.8
Registered electors 11,901
Labour hold Swing
Stanford-le-Hope
PartyCandidateVotes%±%
Labour J. Norris 2,594 62.9
Conservative W. O'Donoghue1,52837.1
Majority1,06625.9
Turnout 4,12233.9
Registered electors 12,159
Labour gain from Conservative Swing
Tilbury
PartyCandidateVotes%±%
Labour P. Bolger 3,081 84.8
Conservative W. McLaughlin55115.2
Majority2,53069.7
Turnout 3,63231.4
Registered electors 11,554
Labour hold Swing
West Thurrock & Aveley
PartyCandidateVotes%±%
Labour C. Bidmead 2,605 55.5
Ind. Labour Party F. Boultwood97320.7
Conservative R. Grove73415.7
Liberal J. Norris2816.0
Ecology M. Crowson972.1
Majority1,63234.8
Turnout 4,69041.1
Registered electors 11,412
Labour hold Swing

Uttlesford

Uttlesford District Summary
PartySeats+/-Votes%+/-
Conservative 4Steady2.svg10,84050.1–23.2
Labour 0Steady2.svg5,49225.4+6.0
Liberal 0Steady2.svg2,81913.0+5.7
Independent 0Steady2.svg2,50411.6N/A
Total4Steady2.svg21,65547.5+2.5

Division results

Dunmow
PartyCandidateVotes%±%
Conservative M. Davey 2,705 53.2 N/A
Liberal P. Pope1,44328.4N/A
Labour S. Cross93718.4N/A
Majority1,26224.8N/A
Turnout 5,08549.1N/A
Registered electors 10,355
Conservative hold Swing N/A
Saffron Walden
PartyCandidateVotes%±%
Conservative J. Moore 2,987 45.0 –30.8
Labour P. Preece2,28234.3+6.6
Liberal P. Norman1,37620.7N/A
Majority70510.6–41.1
Turnout 6,64551.0+4.5
Registered electors 13,018
Conservative hold Swing Decrease2.svg18.7
Stansted
PartyCandidateVotes%±%
Conservative P. Wawn 2,517 50.0 –16.2
Independent E. Mitchell1,51330.0N/A
Labour J. Graddon1,00720.0+6.0
Majority1,00419.9–26.4
Turnout 5,03743.3–4.0
Registered electors 11,627
Conservative hold Swing N/A
Thaxted
PartyCandidateVotes%±%
Conservative F. Askew 2,631 53.8 –26.5
Labour J. Oliveira1,26625.9+6.2
Independent M. Snow99120.3N/A
Majority1,36527.9–32.6
Turnout 4,88846.3+6.3
Registered electors 10,558
Conservative hold Swing Decrease2.svg16.4

By-elections

Thundersley

Thundersley: December 1981
PartyCandidateVotes%±%
Alliance Penny 894 48.0 +30.0
Conservative Gallienne72038.7–15.1
Labour Turner24813.3–14.9
Majority1749.3
Turnout 1,86220.0
Registered electors 9,295
Alliance gain from Conservative Swing Increase2.svg22.6

Basildon Gloucester Park (March 1982)

Basildon Gloucester Park: March 1982
PartyCandidateVotes%±%
Labour Batchelor 2,563 59.2 –8.4
Alliance Butler1,23228.5+11.1
Conservative Lane53212.3–2.7
Majority1,33130.7
Turnout 4,32734.6
Registered electors 12,493
Labour hold Swing Decrease2.svg9.8

Dunmow

Dunmow: July 1982
PartyCandidateVotes%±%
Conservative Oakley 2,224 55.9 +2.7
Alliance Taylor1,40935.4+7.0
Labour McCarthy3478.7–9.7
Majority81520.5
Turnout 3,98037.6
Registered electors 10,582
Conservative hold Swing Decrease2.svg2.2

Basildon Gloucester Park (October 1982)

Basildon Gloucester Park: October 1982
PartyCandidateVotes%±%
Labour Primmer 1,935 58.3 –9.3
Alliance Bassett82724.9+7.5
Conservative Lane55616.8+1.8
Majority1,10833.4
Turnout 3,31826.6
Registered electors 12,493
Labour hold Swing Decrease2.svg8.4

Thorpe

Thorpe: October 1983
PartyCandidateVotes%±%
Conservative Rainger 1,405 64.4 +3.5
Alliance Baker47321.7+9.7
Labour Hurley30213.9–9.5
Majority93242.7
Turnout 2,18018.9
Registered electors 11,512
Conservative hold Swing Decrease2.svg3.1

Gray Thurrock

Grays Thurrock: June 1984
PartyCandidateVotes%±%
Labour Cohen 1,471 48.9 +3.8
Conservative Dimond1,28842.8+1.2
Alliance Benson2508.3–5.0
Majority1836.1
Turnout 3,00923.3
Registered electors 12,919
Labour hold Swing Increase2.svg1.3

Springfield

Springfield: July 1984
PartyCandidateVotes%±%
Conservative Gore 2,504 48.5 +2.2
Alliance Davey2,18442.3+3.7
Labour Hussey4749.2–5.9
Majority3206.2
Turnout 5,16235.1
Registered electors 14,723
Conservative hold Swing Decrease2.svg0.8

Netteswellbury

Netteswellbury: September 1984
PartyCandidateVotes%±%
Labour Guy 1,820 77.1 +11.1
Conservative Smart30312.8–2.7
Alliance Scammell23810.1–8.4
Majority1,51764.3
Turnout 2,36118.4
Registered electors 12,809
Labour hold Swing Increase2.svg6.9

Related Research Articles

<span class="mw-page-title-main">Fairfield Township, Essex County, New Jersey</span> Township in Essex County, New Jersey, US

Fairfield is a township in far northwestern Essex County, in the U.S. state of New Jersey. As of the 2020 United States census, the township's population was 7,872, an increase of 406 (+5.4%) from the 2010 census count of 7,466, which in turn reflected an increase of 403 (+5.7%) from the 7,063 counted in the 2000 census. Fairfield was the least densely populated town in Essex County in 2020.

Buckinghamshire County Council in England was elected every four years from 1973 until 2020.

Cambridgeshire County Council is elected every four years using the first past the post system of election. As of 2021 the council consists of 61 council seats, representing 59 electoral divisions.

<span class="mw-page-title-main">Castle Point Borough Council elections</span> Local government elections in Essex, England

Castle Point Borough Council in Essex, England holds an election for the whole council every four years. From 2003 to 2023 a third of the council was elected every year for three years, with no election in the fourth. Since the last boundary changes in 2024, 39 councillors have been elected from 13 wards.

Essex County Council in England is elected every four years. Since the last boundary changes in 2005, 75 councillors are elected from 70 wards.

<span class="mw-page-title-main">2009 Essex County Council election</span> 2009 UK local government election

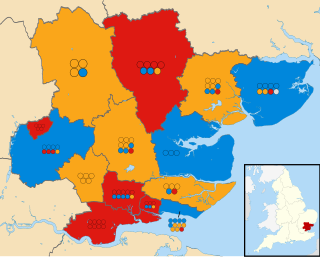
An election to Essex County Council took place on 4 June 2009 as part of the 2009 United Kingdom local elections. The elections had been delayed from 7 May, to coincide with elections to the European Parliament. 75 councillors were elected from various electoral divisions, which returned either one or two county councillors each by first-past-the-post voting for a four-year term of office. The electoral divisions were the same as those used at the previous election in 2005.

<span class="mw-page-title-main">Donald Payne Jr.</span> American politician (1958–2024)

Donald Milford Payne Jr. was an American politician who was the U.S. representative for New Jersey's 10th congressional district from 2012 until his death in 2024. A member of the Democratic Party, Payne served as president of the Newark city council from 2010 to 2012.

<span class="mw-page-title-main">2013 Essex County Council election</span> 2013 UK local government election

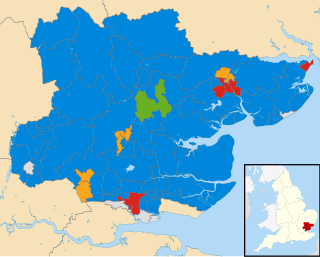
The 2013 Essex County Council election took place on 2 May 2013 to elect members of Essex County Council in Essex, England. They were held on the same day as other local elections. 75 councillors were elected from 70 electoral divisions, which returned either one or two county councillors each by first-past-the-post voting for a four-year term of office. The electoral divisions were the same as those used at the previous election in 2009. No elections were held in Thurrock or Southend-on-Sea, which are unitary authorities outside the area covered by the County Council.

<span class="mw-page-title-main">2005 Essex County Council election</span> English local authority election

An election to Essex County Council took place on 9 May 2005 as part of the 2005 United Kingdom local elections. 75 councillors were elected from various electoral divisions, which returned either one or two county councillors each by first-past-the-post voting for a four-year term of office. The electoral divisions were redrawn for this election.

<span class="mw-page-title-main">2001 Essex County Council election</span> 2001 UK local government election

The 2001 Essex County Council election took place on 7 June 2001 to elect members of Essex County Council in Essex, England. This was on the same day as other local elections and the 2001 general election.

<span class="mw-page-title-main">1997 Essex County Council election</span> 1997 UK local government election

The 1997 Essex County Council election took place on 1 May 1997 to elect members of Essex County Council in Essex, England. This was held on the same day as other local elections and the 1997 general election.

<span class="mw-page-title-main">1993 Essex County Council election</span> 1993 UK local government election

The 1993 Essex County Council election took place on 6 May 1993 to elect members of Essex County Council in Essex, England. It was held on the same day as other local elections.

<span class="mw-page-title-main">1989 Essex County Council election</span> 1989 UK local government election

The 1989 Essex County Council election took place on 4 May 1989 to elect members of Essex County Council in Essex, England. It was held on the same day as other local elections. 98 councillors were elected from various electoral divisions, which returned either one or two county councillors each by first-past-the-post voting for a four-year term of office.

<span class="mw-page-title-main">1985 Essex County Council election</span> Local government contest in the East of England

The 1985 Essex County Council election took place on 2 May 1985 as part of the 1985 United Kingdom local elections. 98 councillors were elected from various electoral divisions, which returned either one or two county councillors each by first-past-the-post voting for a four-year term of office.

<span class="mw-page-title-main">2004 Castle Point Borough Council election</span> 2004 UK local government election

The 2004 Castle Point Borough Council election took place on 10 June 2004 to elect members of Castle Point Borough Council in Essex, England. One third of the council was up for election and the Conservative party stayed in overall control of the council.

<span class="mw-page-title-main">Canvey Island Independent Party</span> Political party in the United Kingdom

The Canvey Island Independent Party (CIIP) is a local political party active on Canvey Island, in Essex, England. It was established in 2004 by Labour councillor Dave Blackwell to campaign for a separate district council for Canvey Island.

<span class="mw-page-title-main">2017 Essex County Council election</span> 2017 UK local government election

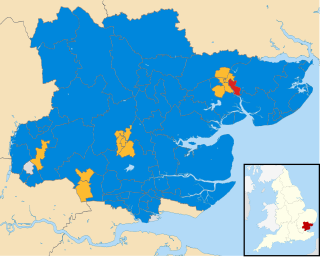
Elections to Essex County Council took place on 4 May 2017 as part of the 2017 local elections. All 75 councillors were elected from 70 electoral divisions, which each returned either one or two councillors by first-past-the-post voting for a four-year term of office.

<span class="mw-page-title-main">2021 Essex County Council election</span> 2021 UK local government election

The 2021 Essex County Council election took place on 6 May 2021 as part of the 2021 United Kingdom local elections. All 75 councillors were elected from 70 electoral divisions, with each returning either one or two councillors by first-past-the-post voting for a four-year term of office.

The 1965 Essex County Council election took place on 25 March 1965 to elect members of Essex County Council in England.

<span class="mw-page-title-main">1977 Essex County Council election</span> 1977 UK local government election

The 1977 Essex County Council election took place on 5 May 1977 to elect members of Essex County Council in England. This was on the same day as other local elections.

References

  1. "Elections". Archived from the original on 2 February 2014. Retrieved 11 February 2014.
  2. "Elections" . Retrieved 11 February 2014.