Maps
Results maps
 1979 results map
 1983 results map
 1987 results map
 1991 results map
 1995 results map
 1999 results map
 2003 results map
 2007 results map
 2011 results map
 2015 results map
 2019 results map
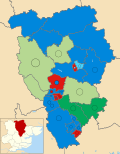 2023 results map


Other maps
 2003 ward map
 2007 ward map
 2011 ward map
 2015 ward map
 2019 ward map


