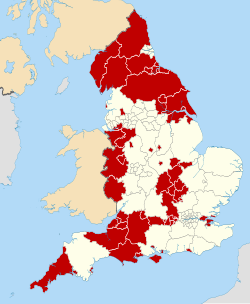
Thurrock Council is the local authority for the unitary authority of Thurrock in Essex, England. Until 1 April 1998 it was a non-metropolitan district. One third of the council is elected each year, followed by one year without an election. Since the unitary authority was first elected in 1997, the council has consisted of 49 councillors elected from 20 wards. [1]
Party | Candidate | Votes | % | ±% | |
---|---|---|---|---|---|
Labour | George Watts | 578 | 56.9 | −1.8 | |
Conservative | Pauline Campbell | 304 | 30.0 | −11.3 | |
Liberal Democrats | Tracey Ashdown | 133 | 13.1 | +13.1 | |
Majority | 274 | 26.9 | |||
Turnout | 1,015 | ||||
Labour hold | Swing |
Party | Candidate | Votes | % | ±% | |
---|---|---|---|---|---|
Labour | Rosemary McMahon | 269 | 52.5 | −11.5 | |
Conservative | Kazimierz Rytter | 154 | 30.1 | −3.4 | |
Liberal Democrats | John Livermore | 89 | 17.4 | +8.1 | |
Majority | 115 | 22.4 | |||
Turnout | 512 | 8.0 | |||
Labour hold | Swing |
Party | Candidate | Votes | % | ±% | |
---|---|---|---|---|---|
Conservative | John Everett | 490 | 46.9 | −0.4 | |
Labour | Denise Cooper | 419 | 40.1 | −12.5 | |
Independent | James Mallon | 71 | 6.8 | +6.8 | |
Liberal Democrats | David Coward | 64 | 6.1 | +6.1 | |
Majority | 71 | 6.8 | |||
Turnout | 1,044 | 17.4 | |||
Conservative gain from Labour | Swing |
Party | Candidate | Votes | % | ±% | |
---|---|---|---|---|---|
Conservative | Neil Pearce | 454 | 64.8 | +25.7 | |
Green | Dean Hall | 247 | 35.2 | +31.9 | |
Majority | 207 | 29.6 | |||
Turnout | 701 | 12.5 | |||
Conservative gain from Labour | Swing |
Party | Candidate | Votes | % | ±% | |
---|---|---|---|---|---|
Independent | John Purkiss | 623 | 67.6 | +67.6 | |
Labour | David Gooding | 139 | 15.1 | −49.6 | |
Conservative | Robert Barnes | 135 | 14.6 | −20.7 | |
Liberal Democrats | David Coward | 25 | 2.7 | +2.7 | |
Majority | 484 | 52.5 | |||
Turnout | 922 | 21.4 | |||
Independent gain from Labour | Swing |
Party | Candidate | Votes | % | ±% | |
---|---|---|---|---|---|
Conservative | Colin Churchman | 803 | 58.7 | +19.5 | |
Labour | Wahidur Rahman | 451 | 32.9 | −0.8 | |
Liberal Democrats | John Lathan | 85 | 6.2 | −17.7 | |
Green | Dean Hall | 31 | 2.3 | −1.0 | |
Majority | 351 | 25.8 | |||
Turnout | 1,370 | 24.0 | |||
Conservative hold | Swing |
Party | Candidate | Votes | % | ±% | |
---|---|---|---|---|---|
Conservative | Benjamin Maney | 362 | 45.4 | −16.7 | |
Labour | Eunice Southam | 274 | 34.3 | +6.1 | |
Independent | Geoffrey Slocock | 117 | 14.7 | +14.7 | |
Liberal Democrats | Mark Meechan | 45 | 5.7 | −4.0 | |
Majority | 88 | 11.1 | |||
Turnout | 798 | 20.8 | |||
Conservative hold | Swing |
Party | Candidate | Votes | % | ±% | |
---|---|---|---|---|---|
Labour | Kenneth Barrett | 358 | 72.9 | −9.3 | |
Liberal Democrats | David Coward | 70 | 14.3 | +14.3 | |
Conservative | Jean Watts | 63 | 12.9 | −4.9 | |
Majority | 288 | 58.6 | |||
Turnout | 491 | 13.0 | |||
Labour hold | Swing |
Party | Candidate | Votes | % | ±% | |
---|---|---|---|---|---|
Conservative | Terence Hipsey | 511 | 40.3 | −7.2 | |
Liberal Democrats | James Thompson | 428 | 33.8 | +33.8 | |
Labour | Julian Norris | 329 | 25.9 | −26.6 | |
Majority | 83 | 6.5 | |||
Turnout | 1,268 | 29.4 | |||
Conservative gain from Labour | Swing |
Party | Candidate | Votes | % | ±% | |
---|---|---|---|---|---|
BNP | Nicholas Geri | 552 | 38.2 | +38.2 | |
Conservative | Nicholas Edwards | 382 | 26.4 | −3.3 | |
Labour | Remia Sear | 374 | 25.9 | −25.2 | |
Liberal Democrats | John Livermore | 137 | 9.5 | −9.7 | |
Majority | 170 | 11.8 | |||
Turnout | 1,445 | 22.0 | |||
BNP gain from Labour | Swing |
Party | Candidate | Votes | % | ±% | |
---|---|---|---|---|---|
Labour | Val Morris-Cook | 575 | 42.4 | +1.8 | |
Conservative | Sharon Ponder | 348 | 25.7 | −7.2 | |
BNP | Emma Colgate | 340 | 25.1 | −1.4 | |
Liberal Democrats | John Livermore | 92 | 6.8 | +6.8 | |
Majority | 227 | 16.7 | |||
Turnout | 1,355 | 20.0 | |||
Labour hold | Swing |
Party | Candidate | Votes | % | ±% | |
---|---|---|---|---|---|
Labour | Salvatore Benson | 661 | 42.2 | −1.1 | |
Conservative | Pauline Tolson | 534 | 34.1 | −22.6 | |
Liberal Democrats | Paul Riley | 220 | 14.1 | +14.1 | |
BNP | John Cotter | 150 | 9.6 | +9.6 | |
Majority | 127 | 8.1 | |||
Turnout | 1,565 | 23.2 | |||
Labour gain from Conservative | Swing |
Party | Candidate | Votes | % | ±% | |
---|---|---|---|---|---|
Labour | Susan Shinnick | 646 | 36.8 | −8.3 | |
Conservative | Danny Nicklen | 570 | 32.5 | +5.6 | |
UKIP | Clive Broad | 504 | 28.7 | +4.3 | |
Liberal Democrats | Kevin Mulroue | 35 | 2.0 | −1.5 | |
Majority | 76 | 4.3 | |||
Turnout | 1,755 | ||||
Labour hold | Swing |
Party | Candidate | Votes | % | ±% | |
---|---|---|---|---|---|
Labour | Terry Brookes | 903 | 50.3 | +3.0 | |
UKIP | Russell Cherry | 621 | 34.6 | +0.5 | |
Conservative | John Rowles | 270 | 15.1 | −0.2 | |
Majority | 282 | 15.7 | |||
Turnout | 1,794 | ||||
Labour hold | Swing |
Party | Candidate | Votes | % | ±% | |
---|---|---|---|---|---|
UKIP | Tim Aker | 747 | 41.0 | −6.2 | |
Conservative | Teresa Webster | 520 | 28.5 | −1.2 | |
Labour | John O'Regan | 338 | 18.6 | +2.4 | |
Independent | Eddie Stringer | 217 | 11.9 | +11.9 | |
Majority | 227 | 12.5 | |||
Turnout | 1,822 | ||||
UKIP hold | Swing |
Party | Candidate | Votes | % | ±% | |
---|---|---|---|---|---|
Labour | Cliff Holloway | 629 | 43.0 | −3.9 | |
UKIP | Helen Adams | 450 | 30.8 | +1.9 | |
Conservative | Tony Coughlin | 384 | 26.2 | +2.0 | |
Majority | 179 | 12.2 | |||
Turnout | 1,463 | ||||
Labour hold | Swing |
Party | Candidate | Votes | % | ±% | |
---|---|---|---|---|---|
Conservative | Andrew Jefferies | 696 | 36.1 | ||
Labour | Les Strange | 696 | 36.1 | ||
Thurrock Ind. | Jack Duffin | 531 | 28.8 | ||
Majority | 0 | ||||
Turnout | |||||
Conservative gain from UKIP | Swing |
Party | Candidate | Votes | % | ±% | |
---|---|---|---|---|---|
Conservative | David Van Day | 773 | 43.6 | +16.4 | |
Thurrock Ind. | Alan Field | 551 | 31.1 | −12.1 | |
Labour | Charles Curtis | 394 | 22.2 | −1.5 | |
Liberal Democrats | Tomas Pilvelis | 55 | 3.1 | +3.1 | |
Majority | 222 | 12.5 | |||
Turnout | 1,773 | ||||
Conservative gain from UKIP | Swing |
Blackpool Borough Council elections are generally held every four years. Blackpool Borough Council is the local authority for the unitary authority of Blackpool in Lancashire, England. Since the last boundary changes in 2023, 42 councillors have been elected from 21 wards.
Rugby Borough Council elections are held three years out of every four, with a third of the council elected each time. Rugby Borough Council is the local authority for the non-metropolitan district of Rugby in Warwickshire, England. Since the last boundary changes in 2012, 42 councillors have been elected from 16 wards.
Fylde Borough Council elections are held every four years to elect councillors to Fylde Borough Council in Lancashire, England. Since the last boundary changes in 2023 the council has comprised 37 councillors, representing 17 wards, with each ward electing one, two or three councillors.
Knowsley Metropolitan Borough Council elections are generally held three years out of every four, with a third of the council being elected each time. Knowsley Metropolitan Borough Council, generally known as Knowsley Council, is the local authority for the metropolitan borough of Knowsley in Merseyside, England. Since the last boundary changes in 2016, 45 councillors have been elected from 15 wards.
One third of Basingstoke and Deane Borough Council in Hampshire, England is elected each year, followed by one year without election. Since the last boundary changes in 2021, 54 councillors have been elected from 18 wards.
Chelmsford City Council in Essex, England is elected every four years. Since the last boundary changes in 2003 the council has comprised 57 councillors elected from 24 wards.
Warwick District Council elections are held every four years. Warwick District Council is the local authority for the non-metropolitan district of Warwick in Warwickshire, England. Since the last boundary changes in 2019, 44 councillors have been elected from 17 wards.
West Lancashire Borough Council elections are generally held three years out of every four, with a third of the council elected each time. West Lancashire Borough Council is the local authority for the non-metropolitan district of West Lancashire in Lancashire, England. Since the last boundary changes in 2023 the council has comprised 45 councillors representing 15 wards, with each ward electing three councillors.
South Ribble Borough Council elections are held every four years. South Ribble Borough Council is the local authority for the non-metropolitan district of South Ribble in Lancashire, England. Since the last boundary changes in 2015, 50 councillors have been elected from 23 wards. The next borough council elections are due to take place in 2027 as part of the wider 2027 United Kingdom local elections.
Watford Borough Council elections are held three years out of every four, to elect members of Watford Borough Council in Hertfordshire, England. A third of the council is elected each time. Since the last boundary changes in 2016 the council has comprised 36 councillors representing 12 wards, each of which elects three councillors. In addition to the 36 councillors Watford also has a directly-elected mayor. Elections to Hertfordshire County Council are held in the fourth year of the cycle when there are no borough council elections.
Halton Borough Council elections are generally held three years out of every four, with a third of the council being elected each time. Halton Borough Council is the local authority for the unitary authority of Halton in Cheshire, England. Since the last boundary changes in 2021, 54 councillors have been elected from 18 wards.
King's Lynn and West Norfolk District Council in Norfolk, England is elected every four years. Since the last boundary changes in 2019, 55 councillors have been elected from 35 wards.
Tonbridge and Malling Borough Council is the local authority for the borough of Tonbridge and Malling in Kent, United Kingdom. The council is elected every four years. Since the last boundary changes in 2023, 44 councillors have been elected from 19 wards.
Warrington Borough Council elections are held every four years. Warrington Borough Council is the local authority for the unitary authority of Warrington in Cheshire, England. Since the last boundary changes in 2016, 58 councillors have been elected from 22 wards.
West Devon Borough Council in Devon, England is elected every four years. Since the last boundary changes in 2015, 31 councillors have been elected from 18 wards.
Rossendale Borough Council elections are generally held three years out of every four, with a third of the council elected each time. Rossendale Borough Council is the local authority for the non-metropolitan district of Rossendale in Lancashire, England. Since the last boundary changes in 2002, 36 councillors have been elected from 14 wards. At the 2024 election, new ward boundaries will be in effect and the number of councillors will decrease to 30.
Rushcliffe Borough Council elections are held every four years. Rushcliffe Borough Council is the local authority for the non-metropolitan district of Rushcliffe in Nottinghamshire, England. Since the last boundary changes in 2023 the council has comprised 44 councillors representing 24 wards, with each ward electing one, two or three councillors.
Swindon Borough Council is the local authority for the unitary authority of Swindon in Wiltshire, England. Until 1 April 1997 its area was a non-metropolitan district called Thamesdown Borough Council, with Wiltshire County Council providing the county-level services.
Gravesham Borough Council elections are held every four years to elect Gravesham Borough Council in Kent, England. Since the last boundary changes in 2023, the council has comprised 39 councillors, representing 17 wards.
Hertsmere Borough Council elections are held every four years to elect members of Hertsmere Borough Council in Hertfordshire, England. Since the last boundary changes in 2019, the council comprises 39 councillors elected from 16 wards.