Results maps
 2003 results map
 2007 results map
 2011 results map
 2015 results map
 2019 results map
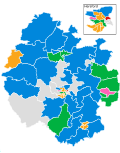 2023 results map
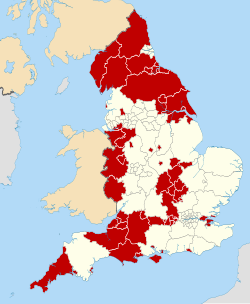
Herefordshire Council elections are held every four years. Herefordshire Council is the local authority for the unitary authority and ceremonial county of Herefordshire in England. Since the last boundary changes in 2015, 53 councillors have been elected from 53 wards. [1]


| Party | Candidate | Votes | % | ±% | |
|---|---|---|---|---|---|
| Independent | 333 | 35.5 | |||
| Liberal Democrats | 284 | 30.3 | |||
| Conservative | 234 | 24.9 | |||
| Labour | 62 | 6.6 | |||
| Green | 25 | 2.4 | |||
| Majority | 49 | 5.2 | |||
| Turnout | 938 | 38.5 | |||
| Independent gain from Liberal Democrats | Swing | ||||
| Party | Candidate | Votes | % | ±% | |
|---|---|---|---|---|---|
| Liberal Democrats | 375 | 35.6 | −22.1 | ||
| Labour | 349 | 33.2 | +12.4 | ||
| Conservative | 220 | 20.9 | +0.6 | ||
| Independent | 108 | 10.3 | +10.3 | ||
| Majority | 26 | 2.4 | |||
| Turnout | 1,052 | 19.4 | |||
| Liberal Democrats hold | Swing | ||||
| Party | Candidate | Votes | % | ±% | |
|---|---|---|---|---|---|
| Conservative | 736 | 49.5 | +24.0 | ||
| Liberal Democrats | 312 | 21.0 | −5.9 | ||
| Independent | 221 | 14.9 | −9.5 | ||
| Green | 148 | 10.0 | −3.0 | ||
| Labour | 69 | 4.6 | −5.6 | ||
| Majority | 424 | 28.5 | |||
| Turnout | 1,486 | ||||
| Conservative hold | Swing | ||||
| Party | Candidate | Votes | % | ±% | |
|---|---|---|---|---|---|
| Conservative | 517 | 53.1 | +31.5 | ||
| Liberal Democrats | 283 | 29.1 | −29.7 | ||
| Labour | 135 | 13.7 | −5.9 | ||
| Green | 39 | 4.0 | +4.0 | ||
| Majority | 234 | 24.0 | |||
| Turnout | 974 | 21.7 | |||
| Conservative gain from Liberal Democrats | Swing | ||||
| Party | Candidate | Votes | % | ±% | |
|---|---|---|---|---|---|
| Labour | 743 | 42.5 | +8.7 | ||
| Liberal Democrats | 566 | 32.3 | −6.5 | ||
| Conservative | 296 | 16.9 | +4.0 | ||
| Independent | 145 | 8.3 | +8.3 | ||
| Majority | 177 | 10.2 | |||
| Turnout | 1,750 | ||||
| Labour gain from Liberal Democrats | Swing | ||||
| Party | Candidate | Votes | % | ±% | |
|---|---|---|---|---|---|
| Liberal Democrats | Fiona Short | 936 | 37.0 | −7.6 | |
| Conservative | John Ward | 783 | 30.9 | +9.4 | |
| Independent | Julie Woodward | 524 | 20.7 | −13.2 | |
| Labour | John Hitchin | 288 | 11.4 | +11.4 | |
| Majority | 153 | 6.1 | |||
| Turnout | 2,531 | 52.5 | |||
| Liberal Democrats hold | Swing | ||||
| Party | Candidate | Votes | % | ±% | |
|---|---|---|---|---|---|
| Liberal Democrats | Elizabeth Taylor | 831 | 44.0 | +8.7 | |
| Conservative | John Perris | 608 | 32.2 | +8.4 | |
| Independent | Guy Griffiths | 274 | 14.5 | −15.4 | |
| Labour | John Oliver | 118 | 6.3 | +6.3 | |
| Independent | Richard Thomas | 56 | 3.0 | +3.0 | |
| Majority | 223 | 11.8 | |||
| Turnout | 1,887 | 27.0 | |||
| Liberal Democrats gain from Independent | Swing | ||||
| Party | Candidate | Votes | % | ±% | |
|---|---|---|---|---|---|
| Conservative | John Jarvis | 482 | 41.6 | +8.2 | |
| Liberal Democrats | Paul Truman | 308 | 26.6 | +26.6 | |
| Independent | 249 | 21.5 | −45.1 | ||
| Independent | 119 | 10.3 | +10.3 | ||
| Majority | 174 | 15.0 | |||
| Turnout | 1,158 | 47.2 | |||
| Conservative gain from Independent | Swing | ||||
| Party | Candidate | Votes | % | ±% | |
|---|---|---|---|---|---|
| Conservative | Barry Durkin | 422 | 37.9 | −8.1 | |
| Independent | John Gartside | 401 | 36.0 | −1.8 | |
| Liberal Democrats | Josephine Lane | 241 | 21.7 | +5.4 | |
| Green | Adrian Worgan | 49 | 4.4 | +4.4 | |
| Majority | 21 | 1.9 | |||
| Turnout | 1,113 | 46.0 | |||
| Conservative hold | Swing | ||||
| Party | Candidate | Votes | % | ±% | |
|---|---|---|---|---|---|
| Independent | Peter McCaull [4] | 515 | 41.4 | +41.4 | |
| Conservative | Keith Miles [4] | 397 | 31.9 | −12.2 | |
| Green | Joan Thwaites [4] | 200 | 16.1 | −4.9 | |
| Liberal Democrats | Matt Lane [4] | 131 | 10.5 | −3.7 | |
| Majority | 118 | 9.5 | |||
| Turnout | 1,243 | ||||
| Independent gain from Conservative | Swing | ||||
| Party | Candidate | Votes | % | ±% | |
|---|---|---|---|---|---|
| Conservative | Tony Johnson | 1,703 | 50.8 | −0.6 | |
| Liberal Democrats | Barry Ashton | 1,651 | 49.2 | +25.2 | |
| Majority | 52 | 1.6 | |||
| Turnout | 3,354 | ||||
| Conservative hold | Swing | ||||
| Party | Candidate | Votes | % | ±% | |
|---|---|---|---|---|---|
| Conservative | Phil Bettington | 2,438 | 49.6 | +13.7 | |
| Liberal Democrats | Michael Gogan | 1,769 | 36.0 | +10.9 | |
| Independent | Robert Wilson | 713 | 14.5 | +14.5 | |
| Majority | 669 | 13.6 | |||
| Turnout | 4,920 | ||||
| Conservative hold | Swing | ||||
| Party | Candidate | Votes | % | ±% | |
|---|---|---|---|---|---|
| It's Our County | Justin Lavender | 589 | 45.2 | +45.2 | |
| Liberal Democrats | Anthony Murphy | 385 | 29.5 | +8.5 | |
| Independent | Colin Mears | 173 | 13.3 | +13.3 | |
| Conservative | Vivienne Jones | 156 | 12.0 | −7.2 | |
| Majority | 204 | 15.7 | |||
| Turnout | 1,303 | ||||
| It's Our County gain from Independent | Swing | ||||
| Party | Candidate | Votes | % | ±% | |
|---|---|---|---|---|---|
| It's Our County | Anthony Powers | 604 | 53.3 | +8.6 | |
| Liberal Democrats | David Hurds | 222 | 19.6 | +2.2 | |
| Conservative | Mark McEvilly | 204 | 18.0 | −5.0 | |
| Labour | Stan Gyford | 104 | 9.2 | −5.7 | |
| Majority | 382 | 33.7 | |||
| Turnout | 1,134 | ||||
| It's Our County hold | Swing | ||||
| Party | Candidate | Votes | % | ±% | |
|---|---|---|---|---|---|
| Conservative | Richard Mayo | 695 | 54.4 | +21.8 | |
| Independent | David Ravenscroft | 312 | 24.4 | +24.4 | |
| Liberal Democrats | Caroline Bennett | 270 | 21.1 | −12.6 | |
| Majority | 383 | 30.0 | |||
| Turnout | 1,277 | ||||
| Conservative hold | Swing | ||||
| Party | Candidate | Votes | % | ±% | |
|---|---|---|---|---|---|
| It's Our County | Cath North | 987 | 61.3 | +11.7 | |
| Conservative | Jason Kay | 347 | 21.5 | +0.7 | |
| Liberal Democrats | Duncan Fraser | 277 | 17.2 | −0.7 | |
| Majority | 640 | 39.7 | |||
| Turnout | 1,611 | ||||
| It's Our County hold | Swing | ||||
| Party | Candidate | Votes | % | ±% | |
|---|---|---|---|---|---|
| It's Our County | Jon Norris | 429 | 46.7 | +25.4 | |
| Independent | Elaine Godding | 261 | 28.4 | −4.2 | |
| Conservative | Elissa Swinglehurst | 229 | 24.9 | −21.2 | |
| Majority | 168 | 18.3 | |||
| Turnout | 919 | ||||
| It's Our County gain from Conservative | Swing | ||||
| Party | Candidate | Votes | % | ±% | |
|---|---|---|---|---|---|
| It's Our County | Terry Widdows | 835 | 51.6 | +16.8 | |
| Conservative | Allen Conway | 618 | 38.2 | +0.3 | |
| UKIP | Paul Stanford | 166 | 10.3 | +10.3 | |
| Majority | 217 | 13.4 | |||
| Turnout | 1,619 | ||||
| It's Our County gain from Conservative | Swing | ||||
| Party | Candidate | Votes | % | ±% | |
|---|---|---|---|---|---|
| Green | Jennifer Bartlett | 384 | 37.9 | +24.2 | |
| Conservative | Wayne Rosser | 222 | 21.9 | −18.2 | |
| Independent | Angela Pendleton | 198 | 19.5 | +19.5 | |
| UKIP | Liz Portman-Lewis | 111 | 10.9 | +10.9 | |
| Labour | Emma Pardoe | 99 | 9.8 | −2.8 | |
| Majority | 162 | 16.0 | |||
| Turnout | 1,014 | ||||
| Green gain from Conservative | Swing | ||||
| Party | Candidate | Votes | % | ±% | |
|---|---|---|---|---|---|
| Green | Trish Marsh | 318 | 40.8 | +10.1 | |
| It's Our County | Jon Stannard | 143 | 18.3 | +18.3 | |
| Conservative | Connor Egan | 139 | 17.8 | −8.7 | |
| Independent | Mark Latimer | 116 | 14.9 | +14.9 | |
| Liberal Democrats | Clive Thomas | 64 | 8.2 | +8.2 | |
| Majority | 175 | 22.4 | |||
| Turnout | 780 | ||||
| Green gain from Independent | Swing | ||||
| Party | Candidate | Votes | % | ±% | |
|---|---|---|---|---|---|
| Independent | Peter Jinman | 462 | 42.7 | +42.7 | |
| Conservative | Simeon Cole | 254 | 23.5 | −42.3 | |
| Independent | Richard Baker | 152 | 14.1 | +14.1 | |
| Green | Jeremy Milln | 109 | 10.1 | −7.1 | |
| Labour | Anna Coda | 104 | 9.6 | +9.6 | |
| Majority | 208 | 19.2 | |||
| Turnout | 1,081 | ||||
| Independent gain from Conservative | Swing | ||||
| Party | Candidate | Votes | % | ±% | |
|---|---|---|---|---|---|
| Conservative | Stuart Anderson | 302 | 38.5 | +38.5 | |
| Independent | Clare Fenton | 162 | 20.6 | +20.6 | |
| It's Our County | Matt Bushkes | 156 | 19.9 | −30.1 | |
| Liberal Democrats | Lucy Hurds | 90 | 11.5 | −21.9 | |
| Labour | David Lewer | 75 | 9.6 | +9.6 | |
| Majority | 140 | 17.8 | |||
| Turnout | 785 | ||||
| Conservative gain from It's Our County | Swing | ||||
| Party | Candidate | Votes | % | ±% | |
|---|---|---|---|---|---|
| Green | Ellie Chowns | 471 | 45.3 | +13.9 | |
| Conservative | Robert Carter | 299 | 28.8 | −39.8 | |
| Liberal Democrats | Jeanie Falconer | 251 | 24.1 | +24.1 | |
| Labour | Roger Page | 19 | 1.8 | +1.8 | |
| Majority | 172 | 16.5 | |||
| Turnout | 1,040 | ||||
| Green gain from Conservative | Swing | ||||
| Party | Candidate | Votes | % | ±% | |
|---|---|---|---|---|---|
| It's Our County | Dave Boulter | 304 | 60.7 | +13.0 | |
| Liberal Democrats | Tricia Hales | 141 | 28.1 | +10.5 | |
| Conservative | Rob Williams | 56 | 11.2 | −3.4 | |
| Majority | 163 | 32.5 | |||
| Turnout | 501 | ||||
| It's Our County hold | Swing | ||||
| Party | Candidate | Votes | % | ±% | |
|---|---|---|---|---|---|
| Conservative | Ann-Marie Probert | 282 | 42.2 | +34.4 | |
| Liberal Democrats | Jacqueline Carwardine | 190 | 28.4 | +1.9 | |
| Labour | Steve Horsfield | 64 | 9.6 | −8.6 | |
| Independent | Alan Jones | 62 | 9.3 | +9.3 | |
| Independent | Glenda Powell | 45 | 6.7 | +6.7 | |
| Independent | Des Woods | 16 | 2.4 | +2.4 | |
| TUSC | Amelia Washbourne | 9 | 1.3 | +1.3 | |
| Majority | 92 | 13.8 | |||
| Turnout | 668 | ||||
| Conservative gain from Independent | Swing | ||||
| Party | Candidate | Votes | % | ±% | |
|---|---|---|---|---|---|
| Independent | Clare Davies | 315 | 55.6 | +55.6 | |
| Independent | Nick Ferguson | 152 | 26.8 | +26.8 | |
| Conservative | Mark Franklin | 100 | 17.6 | −22.3 | |
| Majority | 163 | 28.7 | |||
| Turnout | 567 | ||||
| Independent gain from It's Our County | Swing | ||||
| Party | Candidate | Votes | % | ±% | |
|---|---|---|---|---|---|
| Independent | Matthew Engel | 548 | 61.2 | +61.2 | |
| Conservative | Dave Greenow | 249 | 27.8 | −7.4 | |
| Labour | Sandy Grenar | 34 | 3.8 | +3.8 | |
| Independent | Mike Jones | 34 | 3.8 | +3.8 | |
| Liberal Democrats | Cat Hornsey | 30 | 3.4 | −9.1 | |
| Majority | 299 | 33.4 | |||
| Turnout | 895 | ||||
| Independent hold | Swing | ||||
This by-election was originally scheduled for 7 September 2023; however, it was postponed due to the death of independent candidate Toby Murcott. [22]
| Party | Candidate | Votes | % | ±% | |
|---|---|---|---|---|---|
| Independent | Charlie Taylor | 201 | 33.8 | +20.7 | |
| Independent | Mike Jones | 150 | 25.3 | +25.3 | |
| Conservative | Gareth Johnston | 108 | 18.2 | −15.4 | |
| Reform | Brian Evans | 89 | 15.0 | +15.0 | |
| Liberal Democrats | Debbie Hobbs | 27 | 4.5 | −10.5 | |
| Labour | Mike Crofts | 19 | 3.2 | +3.2 | |
| Majority | 51 | 8.6 | |||
| Turnout | 594 | ||||
| Independent hold | Swing | ||||
| Party | Candidate | Votes | % | ±% | |
|---|---|---|---|---|---|
| Green | Rebecca Tully | 531 | 60.1 | −8.9 | |
| Conservative | Mark Franklin | 215 | 24.3 | −2.9 | |
| Reform | David James | 99 | 11.2 | +11.2 | |
| Liberal Democrats | Nicki West | 27 | 3.1 | −0.8 | |
| Labour | Sandy Grenar | 12 | 1.4 | +1.4 | |
| Majority | 316 | 35.8 | |||
| Turnout | 884 | ||||
| Green hold | Swing | ||||