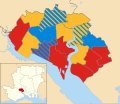
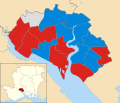
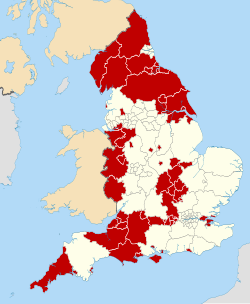
Southampton City Council elections are held three out of every four years to elect members of Southampton City Council, the local authority for the city of Southampton in Hampshire, England. Since 1 April 1997 Southampton has been a unitary authority responsible for all local government functions; prior to this it was a non-metropolitan district beneath Hampshire County Council.
Year | Labour | Conservative | Liberal Democrats [a] | Green | Independents & Others | Council control after election | ||
---|---|---|---|---|---|---|---|---|
Local government reorganisation; council established (51 seats) | ||||||||
1973 | 31 | 20 | 0 | – | 0 | Labour | ||
1976 | 46 | 5 | 0 | 0 | 0 | Conservative | ||
New ward boundaries (51 seats) | ||||||||
1979 | 16 | 29 | 0 | 0 | 0 | Conservative | ||
1980 | 18 | 27 | 0 | 0 | 0 | Conservative | ||
1982 | 19 | 25 | 1 | 0 | 0 | Conservative | ||
1983 | 21 | 23 | 1 | 0 | 0 | Conservative | ||
1984 | 23 | 20 | 2 | 0 | 0 | Labour | ||
1986 | 26 | 15 | 4 | 0 | 0 | Labour | ||
1987 | 21 | 19 | 4 | 0 | 1 | No overall control | ||
1988 | 24 | 17 | 4 | 0 | 0 | Labour | ||
1990 | 25 | 15 | 4 | 0 | 1 | Labour | ||
1991 | 31 | 9 | 5 | 0 | 0 | Labour | ||
1992 | 30 | 9 | 6 | 0 | 0 | Labour | ||
1994 | 23 | 8 | 14 | 0 | 0 | Labour | ||
1995 | 26 | 6 | 13 | 0 | 0 | Labour | ||
1996 | 29 | 3 | 13 | 0 | 0 | Labour | ||
1998 | 28 | 3 | 13 | 0 | 0 | Labour | ||
1999 | 27 | 4 | 14 | 0 | 0 | Labour | ||
2000 | 22 | 7 | 16 | 0 | 0 | No overall control | ||
New ward boundaries (54 seats) | ||||||||
2002 | 19 | 11 | 18 | 0 | 0 | No overall control | ||
2003 | 16 | 12 | 18 | 0 | 2 | No overall control | ||
2004 | 15 | 14 | 19 | 0 | 0 | No overall control | ||
2006 | 16 | 16 | 16 | 0 | 0 | No overall control | ||
2007 | 18 | 18 | 12 | 0 | 0 | No overall control | ||
2008 | 14 | 26 | 8 | 0 | 0 | Conservative | ||
2010 | 15 | 28 | 5 | 0 | 0 | Conservative | ||
2011 | 19 | 26 | 3 | 0 | 0 | Conservative | ||
2012 | 30 | 16 | 2 | 0 | 0 | Labour | ||
2014 | 28 | 18 | 0 | 0 | 2 | Labour | ||
2015 | 26 | 20 | 0 | 0 | 2 | Labour | ||
2016 | 25 | 19 | 0 | 0 | 4 [b] | Labour | ||
2018 | 25 | 19 | 0 | 0 | 4 [b] | Labour | ||
2019 | 29 | 18 | 0 | 0 | 0 | Labour | ||
2021 | 23 | 25 | 0 | 0 | 0 | Conservative | ||
2022 | 26 | 21 | 1 | 0 | 0 | Labour | ||
New ward boundaries (57 seats) | ||||||||
2023 | 38 | 9 | 3 | 1 | 0 | Labour | ||
2024 | 36 | 10 | 4 | 1 | 0 | Labour | ||
Party | Candidate | Votes | % | ±% | |
---|---|---|---|---|---|
Labour | 885 | 52.6 | −6.4 | ||
Conservative | 259 | 15.4 | −3.0 | ||
Socialist Labour | 257 | 15.3 | +9.3 | ||
Liberal Democrats | 250 | 14.9 | +4.7 | ||
Independent Labour | 31 | 1.8 | −4.7 | ||
Majority | 626 | 37.2 | |||
Turnout | 1,682 | 13.0 | |||
Labour hold | Swing |
Party | Candidate | Votes | % | ±% | |
---|---|---|---|---|---|
Labour | 975 | 47.8 | −9.4 | ||
Liberal Democrats | 725 | 35.6 | +6.1 | ||
Conservative | 339 | 16.6 | +3.3 | ||
Majority | 250 | 12.2 | |||
Turnout | 2,039 | 17.9 | |||
Labour hold | Swing |
Party | Candidate | Votes | % | ±% | |
---|---|---|---|---|---|
Conservative | 1,025 | 58.9 | +8.9 | ||
Labour | 372 | 21.4 | −16.2 | ||
Liberal Democrats | 344 | 19.8 | +7.5 | ||
Majority | 653 | 37.5 | |||
Turnout | 1,741 | 14.5 | |||
Conservative hold | Swing |
Party | Candidate | Votes | % | ±% | |
---|---|---|---|---|---|
Labour | 858 | 44.1 | −6.7 | ||
Conservative | 856 | 44.0 | +9.3 | ||
Liberal Democrats | 231 | 11.9 | +3.3 | ||
Majority | 2 | 0.1 | |||
Turnout | 1,945 | 19.3 | |||
Labour hold | Swing |
Party | Candidate | Votes | % | ±% | |
---|---|---|---|---|---|
Conservative | Clifford Coombes | 984 | 37.1 | +0.4 | |
Labour | Mike Brainsby | 791 | 29.9 | +13.1 | |
Liberal Democrats | Anne Work | 785 | 29.6 | −4.3 | |
Green | Joseph Cox | 89 | 3.4 | +3.4 | |
Majority | 193 | 7.2 | |||
Turnout | 2,649 | ||||
Conservative gain from Liberal Democrats | Swing |
Party | Candidate | Votes | % | ±% | |
---|---|---|---|---|---|
Labour | Christopher Hammond | 864 | 32.3 | −22.8 | |
UKIP | John Sharp | 741 | 27.7 | +27.7 | |
Conservative | Alex Houghton | 704 | 26.3 | −5.6 | |
TUSC | Sue Atkins | 136 | 5.1 | +0.4 | |
Liberal Democrats | Adrian Ford | 120 | 4.5 | −3.8 | |
Green | Christopher Bluemel | 107 | 4.0 | +4.0 | |
Majority | 123 | 4.6 | |||
Turnout | 2,672 | ||||
Labour hold | Swing |
Party | Candidate | Votes | % | ±% | |
---|---|---|---|---|---|
Labour | Matthew Raynard | 668 | 26.2 | −2.0 | |
Conservative | Charles Perez-Storey | 529 | 20.7 | +4.3 | |
Liberal Democrats | Josh Smith | 450 | 17.6 | +14.7 | |
Socialist Alternative | Susan Anne Atkins | 368 | 14.4 | +14.4 | |
Integrity Southampton | David John Fletcher | 178 | 7.0 | +7.0 | |
Independent | Richard Terrence McQuillan | 174 | 6.8 | +4.4 | |
UKIP | Derek Lascelles Humber | 123 | 4.8 | +4.8 | |
Green | Cara Anne Sandys | 53 | 2.1 | −0.9 | |
Majority | 139 | 5.4 | |||
Turnout | 2,551 | 25.0 | −7.7 | ||
Labour gain from Independent | Swing |
Party | Candidate | Votes | % | ±% | |
---|---|---|---|---|---|
Labour | Yvonne Frampton | 806 | 46.0 | +4.6 | |
Conservative | Callum Ford | 793 | 45.3 | −1.8 | |
Green | Ronald Meldrum | 66 | 3.8 | −1.5 | |
Liberal Democrats | Nick McGeorge | 61 | 3.5 | −0.9 | |
TUSC | Mabel Wellman | 26 | 1.5 | −0.3 | |
Majority | 13 | 0.7 | |||
Turnout | 1,752 | ||||
Labour gain from Conservative | Swing |
Party | Candidate | Votes | % | ±% | |
---|---|---|---|---|---|
Liberal Democrats | George Percival | 1,249 | 39.2 | +19.3 | |
Conservative | Andrew Hetherton | 770 | 24.2 | −1.1 | |
Labour | Victoria Ugwoeme | 764 | 24.0 | −15.5 | |
Green | Barrie Margetts | 241 | 7.6 | +0.5 | |
Independent | Andrew Pope | 117 | 3.7 | +3.7 | |
TUSC | Maggie Fricker | 44 | 1.4 | −0.1 | |
Majority | 479 | 15.0 | |||
Turnout | 3,185 | ||||
Liberal Democrats gain from Labour | Swing |