| |||||||||||||||||||||||||||||
All 39 seats to Eastleigh Borough Council 20 seats needed for a majority | |||||||||||||||||||||||||||||
---|---|---|---|---|---|---|---|---|---|---|---|---|---|---|---|---|---|---|---|---|---|---|---|---|---|---|---|---|---|
| |||||||||||||||||||||||||||||
|
The 2018 Eastleigh Borough Council election took place on 3 May 2018 to elect all members of Eastleigh Borough Council. [1] The election was on new boundaries, with the overall size of the council being reduced by five seats, from 44 to 39. [2] [3] The outcome was a decisive victory for the incumbent Liberal Democrats. [4]
Party | Seats | Gains | Losses | Net gain/loss | Seats % | Votes % | Votes | +/− | |
---|---|---|---|---|---|---|---|---|---|
Liberal Democrats | 32 | 0 | 1 | 1 | 82.1 | 51.1 | 49,665 | ||
Conservative | 4 | 0 | 2 | 2 | 10.3 | 27.2 | 26,506 | ||
Independent | 3 | 0 | 2 | 2 | 7.7 | 6.2 | 6,048 | ||
Labour | 0 | 0 | 0 | 0.0 | 12.0 | 11,674 | |||
UKIP | 0 | 0 | 0 | 0.0 | 2.1 | 2,014 | |||
Green | 0 | 0 | 0 | 0.0 | 1.4 | 1,375 | |||
A * denotes an incumbent councillor seeking reelection.
Party | Candidate | Votes | % | ±% | |
---|---|---|---|---|---|
Independent | Louise Parker-Jones | 1,618 | 44.6 | ||
Independent | Virginia Tidridge | 1,477 | 40.7 | ||
Independent | Raymond Dean | 1,449 | 40.0 | ||
Liberal Democrats | Trevor Mignot* | 1,256 | 34.6 | ||
Liberal Democrats | Victoria Parkinson* | 1,202 | 33.1 | ||
Liberal Democrats | Anne Winstanley* | 1,197 | 33.0 | ||
Labour | Christine McKeone | 626 | 17.3 | ||
Labour | Susan Toher | 440 | 12.1 | ||
Labour | Ray Bellinger | 368 | 10.1 | ||
Conservative | Nicholas Arnold | 363 | 10.0 | ||
Conservative | Jamie Mills | 310 | 8.5 | ||
UKIP | John Edwards | 291 | 8.0 | ||
Conservative | Jordan Howe-Piper | 282 | 7.8 | ||
Total votes | 3,630 | ||||
Independent win (new seat) | |||||
Independent win (new seat) |
Party | Candidate | Votes | % | ±% | |
---|---|---|---|---|---|
Liberal Democrats | Rupert Kyrle* | 927 | 55.2 | ||
Liberal Democrats | Adrian Trace | 833 | 49.6 | ||
Conservative | Joyce Haythorne | 599 | 35.7 | ||
Conservative | Stephen Wildin | 537 | 32.0 | ||
Labour | Andrew Helps | 134 | 8.0 | ||
Labour | Callum Williamson | 121 | 7.2 | ||
UKIP | Janet Weller | 67 | 4.0 | ||
Total votes | 1,682 | ||||
Liberal Democrats win (new seat) | |||||
Liberal Democrats win (new seat) |
Party | Candidate | Votes | % | ±% | |
---|---|---|---|---|---|
Liberal Democrats | Antonia Craig* | 1,158 | 58.0 | ||
Liberal Democrats | Stephen Holes* | 1,128 | 56.5 | ||
Liberal Democrats | Lyndsey Rich* | 1,124 | 56.3 | ||
Conservative | John Milne | 503 | 25.2 | ||
Conservative | Michael Holliday | 419 | 21.0 | ||
Conservative | Sarah Davies | 402 | 20.2 | ||
Labour | Peter Chilton | 194 | 9.7 | ||
Labour | Margaret Ashton | 160 | 8.0 | ||
Labour | Edward White | 135 | 6.8 | ||
UKIP | Christopher Martin | 124 | 6.2 | ||
Total votes | 1,999 | ||||
Liberal Democrats win (new seat) | |||||
Liberal Democrats win (new seat) |
Party | Candidate | Votes | % | ±% | |
---|---|---|---|---|---|
Liberal Democrats | Alan Broadhurst* | 1,796 | 55.0 | ||
Liberal Democrats | David Pragnell* | 1,612 | 49.4 | ||
Liberal Democrats | Timothy Groves | 1,611 | 49.4 | ||
Conservative | Benjamin Dolbear | 1,026 | 31.4 | ||
Conservative | Daniel Newcombe | 1,007 | 30.9 | ||
Conservative | Ian Bennett | 956 | 29.3 | ||
Labour | Gillian Connell | 350 | 10.7 | ||
Labour | Sarah Mann | 313 | 9.6 | ||
Labour | Jennifer Prior | 295 | 9.0 | ||
UKIP | Peter House | 166 | 5.1 | ||
Total votes | 3,289 | ||||
Liberal Democrats win (new seat) | |||||
Liberal Democrats win (new seat) |
Party | Candidate | Votes | % | ±% | |
---|---|---|---|---|---|
Liberal Democrats | Tina Campbell* | 1,163 | 46.8 | ||
Liberal Democrats | Wayne Irish* | 1,090 | 43.8 | ||
Liberal Democrats | Jephthe Doguie | 976 | 39.2 | ||
Labour | Joshua Constable | 649 | 26.1 | ||
Labour | Jillian Payne | 640 | 25.7 | ||
Conservative | Paula Payne | 469 | 18.9 | ||
Labour | Sattar Shere-Mohammod | 463 | 18.6 | ||
Conservative | Paul Joseph | 394 | 15.8 | ||
Conservative | Leah Mills | 360 | 14.5 | ||
UKIP | Andrew Moore | 306 | 12.3 | ||
Green | Lynn Sheil | 295 | 11.9 | ||
Total votes | 2,491 | ||||
Liberal Democrats win (new seat) | |||||
Liberal Democrats win (new seat) |
Party | Candidate | Votes | % | ±% | |
---|---|---|---|---|---|
Liberal Democrats | Daniel Clarke* | 1,172 | 45.5 | ||
Liberal Democrats | Rosemary Reynolds | 1,076 | 41.8 | ||
Liberal Democrats | Sara Tyson-Payne | 984 | 38.2 | ||
Independent | David Betts | 541 | 21.0 | ||
Independent | Steven Sollitt* | 522 | 20.3 | ||
Independent | Christopher Thomas* | 441 | 17.1 | ||
Conservative | Simon Payne | 413 | 16.0 | ||
Conservative | Jeanette Fox | 359 | 13.9 | ||
Conservative | Iwona Page | 332 | 12.9 | ||
Labour | Kathleen O'Neill | 316 | 12.3 | ||
Labour | Eileen Marks | 308 | 12.0 | ||
Labour | Steven Phillips | 294 | 11.4 | ||
Green | Alexander Hughes | 229 | 8.9 | ||
UKIP | Paul Webber | 174 | 6.8 | ||
Total votes | 2,582 | ||||
Liberal Democrats win (new seat) | |||||
Liberal Democrats win (new seat) |
Party | Candidate | Votes | % | ±% | |
---|---|---|---|---|---|
Liberal Democrats | Paul Bicknell* | 1,167 | 52.0 | ||
Liberal Democrats | Alex Bourne | 1,066 | 47.5 | ||
Liberal Democrats | Darshan Mann* | 964 | 42.9 | ||
Labour | Peter Luffman | 602 | 26.8 | ||
Labour | Tanya Judd | 569 | 25.3 | ||
Labour | Gwyneth Rees | 463 | 20.6 | ||
Conservative | Deborah Brewer | 411 | 18.3 | ||
Conservative | Scott Harris | 356 | 15.9 | ||
Conservative | Chloe Simpson | 341 | 15.2 | ||
UKIP | Glynn Davies-Dear | 231 | 10.3 | ||
Total votes | 2,249 | ||||
Liberal Democrats win (new seat) | |||||
Liberal Democrats win (new seat) |
Party | Candidate | Votes | % | ±% | |
---|---|---|---|---|---|
Liberal Democrats | Robert Rushton* | 1,236 | 41.7 | ||
Liberal Democrats | Nicholas Couldrey* | 1,234 | 41.7 | ||
Conservative | Steven Broomfield | 1,188 | 40.1 | ||
Liberal Democrats | Desmond Scott* | 1,125 | 38.0 | ||
Conservative | Jacqueline Zieba | 837 | 28.3 | ||
Conservative | Katharine Bradshaw | 756 | 25.5 | ||
Green | Paul Openshaw | 412 | 13.9 | ||
Labour | Mary Shephard | 408 | 13.8 | ||
UKIP | Martin Lyon | 372 | 12.5 | ||
Labour | Emma Kettle | 321 | 10.8 | ||
Labour | Philip Baker | 307 | 10.4 | ||
Total votes | 2,972 | ||||
Liberal Democrats win (new seat) | |||||
Conservative win (new seat) |
Party | Candidate | Votes | % | ±% | |
---|---|---|---|---|---|
Liberal Democrats | David Airey* | 1,879 | 62.0 | ||
Liberal Democrats | Malcolm Cross* | 1,853 | 61.2 | ||
Liberal Democrats | Adam Manning | 1,690 | 55.8 | ||
Conservative | Edward Giles | 846 | 27.9 | ||
Conservative | Susan Hall | 678 | 22.4 | ||
Conservative | Lisa Moody | 657 | 21.7 | ||
Labour | Peter Chilton | 302 | 10.0 | ||
Labour | Margaret Ashton | 281 | 9.3 | ||
Labour | Edward White | 261 | 8.6 | ||
Total votes | 3,035 | ||||
Liberal Democrats win (new seat) | |||||
Liberal Democrats win (new seat) |
Party | Candidate | Votes | % | ±% | |
---|---|---|---|---|---|
Liberal Democrats | Lucy Jurd | 1,114 | 54.2 | ||
Liberal Democrats | Derek Pretty* | 1,105 | 53.8 | ||
Liberal Democrats | Ian Corben* | 1,080 | 52.6 | ||
Conservative | Stephanie Arnold | 549 | 26.7 | ||
Conservative | Douglas Fox | 473 | 23.0 | ||
Conservative | Benjamin Burcombe-Filer | 455 | 22.1 | ||
Labour | Stephen Ashe | 243 | 11.8 | ||
Labour | Geoffrey Budd | 243 | 11.8 | ||
Green | Rosanna Campbell | 187 | 9.1 | ||
Labour | Kevin Williamson | 160 | 7.8 | ||
UKIP | John Tomlin | 81 | 3.9 | ||
Total votes | 2,056 | ||||
Liberal Democrats win (new seat) | |||||
Liberal Democrats win (new seat) |
Party | Candidate | Votes | % | ±% | |
---|---|---|---|---|---|
Liberal Democrats | Margaret Allingham* | 1,933 | 57.3 | ||
Liberal Democrats | Keith House* | 1,894 | 56.2 | ||
Liberal Democrats | Cynthia Garton* | 1,863 | 55.3 | ||
Conservative | Jeremy Hall | 1,157 | 34.3 | ||
Conservative | Christopher Yates | 1,016 | 30.1 | ||
Conservative | Andrea Lunnon | 1,008 | 29.9 | ||
Labour | Keith Day | 182 | 5.4 | ||
Labour | Terence Crow | 173 | 5.1 | ||
Labour | Betty Layland | 155 | 4.6 | ||
UKIP | George McGuinness | 133 | 3.9 | ||
Total votes | 3,379 | ||||
Liberal Democrats win (new seat) | |||||
Liberal Democrats win (new seat) |
Party | Candidate | Votes | % | ±% | |
---|---|---|---|---|---|
Conservative | Judith Grajewski* | 1,888 | 51.1 | ||
Conservative | Margaret Atkinson* | 1,793 | 48.5 | ||
Conservative | Michael Hughes* | 1,726 | 46.7 | ||
Liberal Democrats | James Duguid | 1,540 | 41.7 | ||
Liberal Democrats | Peter Child | 1,457 | 39.4 | ||
Liberal Democrats | Rebecca Allen | 1,416 | 38.3 | ||
Labour | Kevin Butt | 257 | 7.0 | ||
Labour | John Prior | 227 | 6.1 | ||
Labour | Michael Tibble | 222 | 6.0 | ||
Total votes | 3,714 | ||||
Conservative win (new seat) | |||||
Conservative win (new seat) |
Party | Candidate | Votes | % | ±% | |
---|---|---|---|---|---|
Liberal Democrats | Bruce Tennent* | 975 | 61.6 | ||
Liberal Democrats | Richard Gomer | 934 | 59.0 | ||
Conservative | Anna Linsdell | 367 | 23.2 | ||
Conservative | Thomas Yates | 327 | 20.7 | ||
Green | Glynn Fleming | 122 | 7.7 | ||
Labour | Alison Phillips | 105 | 6.6 | ||
Labour | Geoffrey Kosted | 104 | 6.6 | ||
UKIP | Andrew Whitehouse | 69 | 4.4 | ||
Total votes | 1,583 | ||||
Liberal Democrats win (new seat) | |||||
Liberal Democrats win (new seat) |
Party | Candidate | Votes | % | ±% | |
---|---|---|---|---|---|
Liberal Democrats | Janice Asman* | 928 | 56.3 | ||
Liberal Democrats | Carol Boulton* | 907 | 55.0 | ||
Conservative | Benjamin Greenwood | 504 | 30.6 | ||
Conservative | William Haythorne | 442 | 26.8 | ||
Labour | Stephen Willoughby | 152 | 9.2 | ||
Labour | Jacob Phillips | 131 | 7.9 | ||
Green | Tracy Weeks | 130 | 7.9 | ||
Total votes | 1,655 | ||||
Liberal Democrats win (new seat) | |||||
Liberal Democrats win (new seat) |
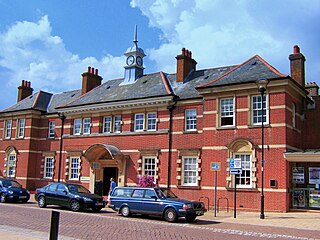
Eastleigh is a town in Hampshire, England, between Southampton and Winchester. It is the largest town and the administrative seat of the Borough of Eastleigh, with a population of 24,011 at the 2011 census.
Winchester is a constituency in Hampshire represented in the House of Commons of the UK Parliament since 2010 by Steve Brine, a Conservative.
One third of Eastleigh Borough Council is elected each year, followed by one year without election.
One third of Crawley Borough Council in West Sussex, England is elected each year, followed by one year without election. Since the last boundary changes in 2019, 36 councillors have been elected from 13 wards.
Hertfordshire County Council in England is elected every four years. Since the last boundary changes took effect in 2017 there have been 78 electoral divisions electing one councillor each.
The 2018 United Kingdom local elections were held on Thursday 3 May 2018, with local council elections taking place in all 32 London boroughs, 34 metropolitan boroughs, 67 district and borough councils and 17 unitary authorities. There were also direct elections for the mayoralties of Hackney, Lewisham, Newham, Tower Hamlets and Watford.
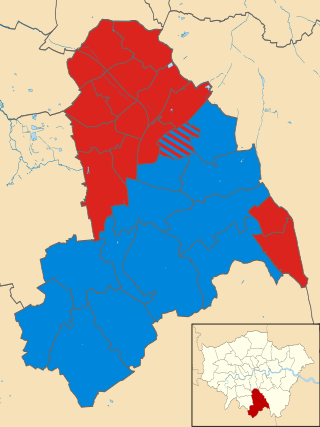
The 2018 Croydon Council election took place on 3 May 2018 to elect members of Croydon Council in England. This was on the same day as other London local elections.
The 2019 United Kingdom local elections took place on Thursday 2 May 2019, with 248 English local councils, six directly elected mayors in England, and all 11 local councils in Northern Ireland being contested.
The 2018 Woking Borough Council election took place on 3 May 2018 to elect one third of members to Woking Borough Council in England coinciding with other local elections held across much of England. Elections in each ward are held in three years out of four.
The 2019 Wirral Metropolitan Borough Council election took place on 2 May 2019 to elect members of Wirral Metropolitan Borough Council in England. This election was held on the same day as other local elections.
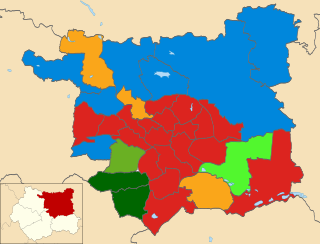
The 2019 Leeds City Council election took place on Thursday 2 May 2019 to elect members of Leeds City Council in England. It was held on the same day as other UK local elections across England and Northern Ireland.
Elections to Portsmouth City Council took place on Thursday 2 May 2019, alongside other local elections across the country. The seats contested in this election were last contested in 2015. The Conservative Party had 8 seats they were defending, the Liberal Democrats 5 and Labour 1 seat. A by-election occurred within the vacant Cosham seat from last years election, due to the sitting Conservative standing down. No party gained a majority from this election, and therefore the council remains under no overall control.
The 2021 Wirral Metropolitan Borough Council election took place on 6 May 2021 to elect members of Wirral Metropolitan Borough Council in England. This election was held on the same day as other local elections. The election was originally due to take place in May 2020, but was postponed due to the COVID-19 pandemic. This delay meant those elected would serve only a three-year term.
The 2019 Eastleigh Borough Council election took place on 2 May 2019 to elect one third of members of Eastleigh Borough Council. The outcome was a strengthened majority for the incumbent Liberal Democrats who gained two Conservative seats. No election was held in Botley, a two-member ward, this year.
Elections to Hampshire County Council took on 6 May 2021 as part of the 2021 United Kingdom local elections. All 78 seats were up for election, with each ward returning either one or two councillors by first-past-the-post voting for a four-year term of office. This took place at the same time as the elections for the Hampshire Police and Crime Commissioner and district councils.
The 2022 United Kingdom local elections took place on Thursday 5 May 2022. These included elections for all London borough councils, for all local authorities in Wales and Scotland. Most seats in England were last up for election in 2018 and in Scotland and Wales in 2017. The elections coincided with the 2022 Northern Ireland Assembly election. In 91 cases, most of them in Wales, council seats were uncontested, each having only one candidate. Three seats in Scotland remained unfilled as no one nominated to fill them.
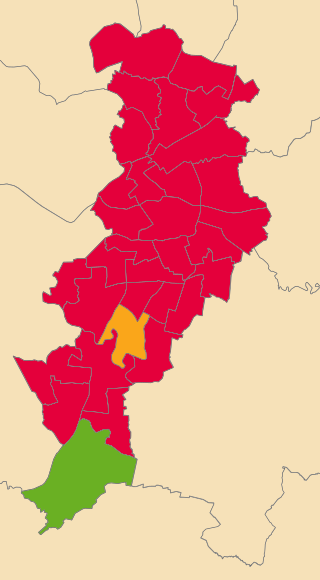
The 2022 Manchester City Council election took place on 5 May 2022. One third of councillors on Manchester City Council were elected. This election was a part of the other local elections across the United Kingdom.
The 2022 Calderdale Metropolitan Borough Council election took place on 5 May 2022 to elect members of Calderdale Metropolitan Borough Council in England. One third of councillors — 17 out of 51, plus one vacancy in Ovenden ward were up for election. The election took place alongside other local elections across the United Kingdom.
The 2022 Dudley Metropolitan Borough Council election took place on 5 May 2022. One third of councillors—24 out of 72—on Dudley Metropolitan Borough Council were elected, with 1 ward electing 2 councillors. The election took place alongside other local elections across the United Kingdom.