The 2018 West Oxfordshire District Council election was held on 3 May 2018 to elect members of West Oxfordshire District Council in England. This was on the same day as other local elections.
Elections were held for 17 of the 49 seats on the council. Five seats changed hands. The Conservative Party lost five seats, the Liberal Democrats gained three and the Labour Party gained two. The Conservatives remained in overall control of the council with a reduced total of 34 seats. [1] The Liberal Democrats remained the largest opposition group with eight seats. The Labour Party remained the third largest party with six seats. [2]
Party | Candidate | Votes | % | ±% | ||
---|---|---|---|---|---|---|
Liberal Democrats | Jake Ryan Acock | 457 | 52.8 | +43.0 | ||
Conservative | Tom Simcox | 337 | 38.9 | -23.7 | ||
Labour | Sian Priscilla Florence O'Neill | 57 | 6.6 | -8.3 | ||
Green | Celia Jocelyn Kerslake | 15 | 1.7 | -10.9 | ||
Turnout | 866 | 51.15% | ||||
Majority | 120 | |||||
Liberal Democrats gain from Conservative | ||||||
Party | Candidate | Votes | % | ±% | |
---|---|---|---|---|---|
Conservative | James Francis Mills | 646 | 58.5 | -0.9 | |
Liberal Democrats | Dennis Thrale Walker | 214 | 19.4 | +11.0 | |
Labour | Trevor Ian License | 110 | 10.0 | +0.3 | |
Independent | Pete Handley | 96 | 8.7 | N/A | |
Green | Harriet Lorna Mary Kopinska | 38 | 3.4 | -6.2 | |
Turnout | 1,104 | 36.53% | |||
Majority | 432 | ||||
Conservative hold | Swing | ||||
Party | Candidate | Votes | % | ±% | |
---|---|---|---|---|---|
Conservative | Alex Postan | 417 | 71.9 | +16.9 | |
Liberal Democrats | Gillian Elizabeth Workman | 94 | 16.2 | N/A | |
Labour | Stephen Parkinson | 69 | 11.9 | N/A | |
Turnout | 580 | 37.46% | |||
Majority | 323 | ||||
Conservative hold | Swing | ||||
Party | Candidate | Votes | % | ±% | |
---|---|---|---|---|---|
Conservative | Derek Albert Cotterill | 503 | 75.0 | +1.7 | |
Liberal Democrats | Elizabeth Anne Mortimer | 113 | 16.8 | N/A | |
Labour | Andrew Lawrence Ferrero | 55 | 8.2 | +2.3 | |
Turnout | 671 | 44.55% | |||
Majority | 390 | ||||
Conservative hold | Swing | ||||
Party | Candidate | Votes | % | ±% | |
---|---|---|---|---|---|
Conservative | Martin Dominic McBride | 500 | 65.4 | +5.7 | |
Labour | Calvert Charles Stuart McGibbon | 167 | 21.8 | +7.7 | |
Liberal Democrats | Derek George Laud | 98 | 12.8 | +6.8 | |
Turnout | 765 | 19.67% | |||
Majority | 333 | ||||
Conservative hold | Swing | ||||
Party | Candidate | Votes | % | ±% | |
---|---|---|---|---|---|
Conservative | Maxine Judith Crosland | 626 | 68.9 | +8.9 | |
Labour | David John Wesson | 189 | 20.8 | +8.6 | |
Liberal Democrats | Ivan Aguado Melet | 94 | 10.3 | +5.0 | |
Turnout | 909 | 24.13% | |||
Majority | 437 | ||||
Conservative hold | Swing | ||||
Party | Candidate | Votes | % | ±% | |
---|---|---|---|---|---|
Conservative | Nick Leverton | 572 | 69.7 | +8.2 | |
Liberal Democrats | Benjamin Lawrence Lines | 111 | 13.5 | +7.5 | |
Labour | Simon David Adderley | 109 | 13.3 | +1.8 | |
Green | Andy King | 29 | 3.5 | -2.1 | |
Turnout | 821 | 23.39% | |||
Majority | 461 | ||||
Conservative hold | Swing | ||||
Party | Candidate | Votes | % | ±% | |
---|---|---|---|---|---|
Labour | Laetisia Catherine Carter | 1,116 | 59.0 | +10.8 | |
Conservative | Gary Elwyn Jones | 490 | 25.9 | -15.1 | |
Liberal Democrats | Juliet Elizabeth Anson Byrne | 284 | 15.0 | +12.2 | |
Turnout | 1,890 | 37.72% | |||
Majority | 626 | ||||
Labour hold | Swing | ||||
Party | Candidate | Votes | % | ±% | |
---|---|---|---|---|---|
Conservative | Ben Woodruff | 375 | 62.0 | +11.4 | |
Liberal Democrats | John Charles Cole | 119 | 19.7 | N/A | |
Labour | Richard John Kelsall | 111 | 18.3 | +0.4 | |
Turnout | 605 | 35.35% | |||
Majority | 256 | ||||
Conservative hold | Swing | ||||
Party | Candidate | Votes | % | ±% | ||
---|---|---|---|---|---|---|
Liberal Democrats | Carl Martin Rylett | 1,062 | 49.4 | +29.4 | ||
Conservative | Abdul Mubin | 604 | 28.1 | -10.4 | ||
Labour | Elsa Louise Dawson | 383 | 17.8 | -9.8 | ||
Green | Helen Gavin | 102 | 4.7 | -9.2 | ||
Turnout | 2,151 | 44.61% | ||||
Majority | 458 | |||||
Liberal Democrats gain from Conservative | ||||||
Party | Candidate | Votes | % | ±% | ||
---|---|---|---|---|---|---|
Labour | Merilyn Elizabeth Davies | 741 | 45.6 | +33.4 | ||
Conservative | Alaa Hassan Al-Yousuf | 602 | 37.1 | -10.2 | ||
Conservative | Colin Graham Dingwall | 570 | 35.1 | -12.2 | ||
Labour | Andrew Philip Lesnik | 442 | 27.2 | +15.0 | ||
Independent | Stuart Brooks | 370 | 22.8 | N/A | ||
Green | Andrew Wright | 123 | 7.6 | -4.6 | ||
Liberal Democrats | Andy Crick | 122 | 7.5 | -9.8 | ||
Liberal Democrats | Chris Tatton | 95 | 5.8 | -11.5 | ||
Turnout | 1,624 | 47.68% | ||||
Majority | 139 | |||||
Labour gain from Conservative | ||||||
Party | Candidate | Votes | % | ±% | ||
---|---|---|---|---|---|---|
Liberal Democrats | Dave Jackson | 423 | 53.0 | +37.4 | ||
Conservative | Jonny Rosemont | 342 | 42.9 | -19.0 | ||
Labour | Aaron James Michael Miles | 33 | 4.1 | N/A | ||
Turnout | 798 | 52.11% | ||||
Majority | 81 | |||||
Liberal Democrats gain from Conservative | ||||||
Party | Candidate | Votes | % | ±% | ||
---|---|---|---|---|---|---|
Labour | Rosalind Moya Bolger | 869 | 44.1 | -3.9 | ||
Conservative | Ron Spurs | 859 | 43.6 | -0.6 | ||
Liberal Democrats | Gabriel William Jonathan Schenk | 130 | 6.6 | +4.0 | ||
Green | Stuart Sutherland McDonald | 111 | 5.6 | +0.5 | ||
Turnout | 1,969 | 33.96% | ||||
Majority | 10 | |||||
Labour gain from Conservative | ||||||
Party | Candidate | Votes | % | ±% | |
---|---|---|---|---|---|
Conservative | Anthony David Harvey | 666 | 42.9 | -6.2 | |
Labour | Owen Gregory Blase Collins | 640 | 41.2 | +7.9 | |
Green | Carol Rae Cather | 134 | 8.6 | -0.5 | |
Liberal Democrats | Christopher John Blount | 113 | 7.3 | -1.2 | |
Turnout | 1,553 | 32.50% | |||
Majority | 26 | ||||
Conservative hold | Swing | ||||
Party | Candidate | Votes | % | ±% | |
---|---|---|---|---|---|
Liberal Democrats | Julian Craig Cooper | 604 | 42.0 | -0.8 | |
Conservative | Betsy Glasgow | 403 | 28.0 | -13.6 | |
Independent | Sharone Parnes | 154 | 10.7 | N/A | |
Green | Mathew Oliver William Parkinson | 152 | 10.6 | +4.2 | |
Labour | Dave Baldwin | 125 | 8.7 | -0.5 | |
Turnout | 1,438 | 43.77% | |||
Majority | 201 | ||||
Liberal Democrats hold | Swing | ||||
The 2006 St Helens Metropolitan Borough Council election took place on 4 May 2006 to elect members of St Helens Metropolitan Borough Council in Merseyside, England. One third of the council was up for election and the council stayed under no overall control.
The 2015 South Oxfordshire District Council election was held on 7 May 2015 to elect members of South Oxfordshire District Council in England. This was on the same day as other local elections.
The 1998 West Oxfordshire District Council election took place on 7 May 1998 to elect members of West Oxfordshire District Council in Oxfordshire, England. One third of the council was up for election and the council stayed under no overall control.
The 2000 West Oxfordshire District Council election took place on 4 May 2000 to elect members of West Oxfordshire District Council in Oxfordshire, England. One third of the council was up for election and the Conservative Party gained overall control of the council from no overall control.
The 2003 West Oxfordshire District Council election took place on 1 May 2003 to elect members of West Oxfordshire District Council in Oxfordshire, England. One third of the council was up for election and the Conservative Party stayed in overall control of the council.
The 2004 West Oxfordshire District Council election took place on 10 June 2004 to elect members of West Oxfordshire District Council in Oxfordshire, England. One third of the council was up for election and the Conservative Party stayed in overall control of the council.
The 2006 West Oxfordshire District Council election took place on 4 May 2006 to elect members of West Oxfordshire District Council in Oxfordshire, England. One third of the council was up for election and the Conservative Party stayed in overall control of the council.
The 2007 West Oxfordshire District Council election took place on 3 May 2007 to elect members of West Oxfordshire District Council in Oxfordshire, England. One third of the council was up for election and the Conservative Party stayed in overall control of the council.
The 2008 West Oxfordshire District Council election took place on 1 May 2008 to elect members of West Oxfordshire District Council in Oxfordshire, England. One third of the council was up for election and the Conservative Party stayed in overall control of the council.
The 2010 West Oxfordshire District Council election took place on 6 May 2010 to elect members of West Oxfordshire District Council in Oxfordshire, England. One third of the council was up for election and the Conservative Party stayed in overall control of the council.
The 2011 West Oxfordshire District Council election took place on 5 May 2011 to elect members of West Oxfordshire District Council in Oxfordshire, England. One third of the council was up for election and the Conservative Party stayed in overall control of the council.
The 2012 West Oxfordshire District Council election took place on 3 May 2012 to elect members of West Oxfordshire District Council in Oxfordshire, England. One third of the council was up for election and the Conservative Party stayed in overall control of the council.
The 2014 West Oxfordshire District Council election took place on 22 May 2014 to elect members of West Oxfordshire District Council in Oxfordshire, England. One third of the council was up for election and the Conservative Party stayed in overall control of the council.
The 2015 West Oxfordshire District Council election took place on 22 May 2015 to elect members of West Oxfordshire District Council in Oxfordshire, England. One third of the council was up for election and the Conservative Party stayed in overall control of the council.
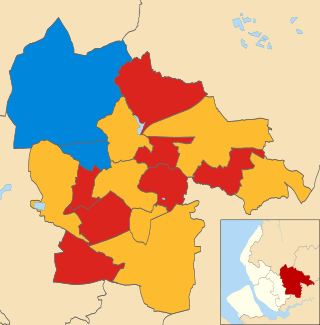
The 2016 West Oxfordshire District Council election was held on 5 May 2016 to elect members of West Oxfordshire District Council in England. This was on the same day as other local elections.
The 2018 Oxford City Council election took place on 3 May 2018, to elect 24 of the 48 members of Oxford City Council in England. This was on the same day as other local elections in England. Each of Oxford's 24 wards elected one councillor, with the other seat in each ward next due for election in May 2020.
The 2011 South Oxfordshire District Council election was held on 5 May 2011 to elect members of South Oxfordshire District Council in England. This was on the same day as other local elections.
The 2022 City of Bradford Metropolitan District Council election took place on 5 May 2022 to elect one third of councillors to the City of Bradford Metropolitan District Council. The election took place at the same time as other local elections across the United Kingdom.
Elections to Angus Council took place on 5 May 2022, the same day as the 31 other Scottish local government elections. As with other Scottish council elections, it was held using single transferable vote (STV) – a form of proportional representation – in which multiple candidates are elected in each ward and voters rank candidates in order of preference.
Elections to Aberdeenshire Council took place on Thursday 5 May 2022 on the same day as the 31 other Scottish local government elections. As with other Scottish council elections, it was held using single transferable vote (STV) – a form of proportional representation – in which multiple candidates are elected in each ward and voters rank candidates in order of preference.