2018 London local elections

Last updated

2018 London local elections
  2014 3 May 2018 2022  

All 1,833 councillors on all 32 London boroughs
and 4 directly-elected mayors
 First partySecond party
  Sadiq Khan November 2016.jpg Official portrait of Mr Gareth Bacon MP crop 2.jpg
Leader Sadiq Khan Gareth Bacon
Party Labour Conservative
Popular vote1,076,617707,373
Percentage43.9%28.8%
SwingIncrease2.svg6.3%Increase2.svg2.4%
Councils217
Councils +/–Increase2.svg1Decrease2.svg2
Councillors1,128508
Councillors +/–Increase2.svg67*Decrease2.svg92*

 Third partyFourth party
  Caroline Pidgeon (cropped).jpg Sian Berry, 2018 (cropped).jpg
Leader Caroline Pidgeon Siân Berry
Party Liberal Democrats Green
Popular vote320,031211,170
Percentage13.0%8.6%
SwingIncrease2.svg2.4%Decrease2.svg1.2%
Councils30
Councils +/–Increase2.svg2Steady2.svg
Councillors15211
Councillors +/–Increase2.svg34*Increase2.svg7*

London local elections 2018.svg
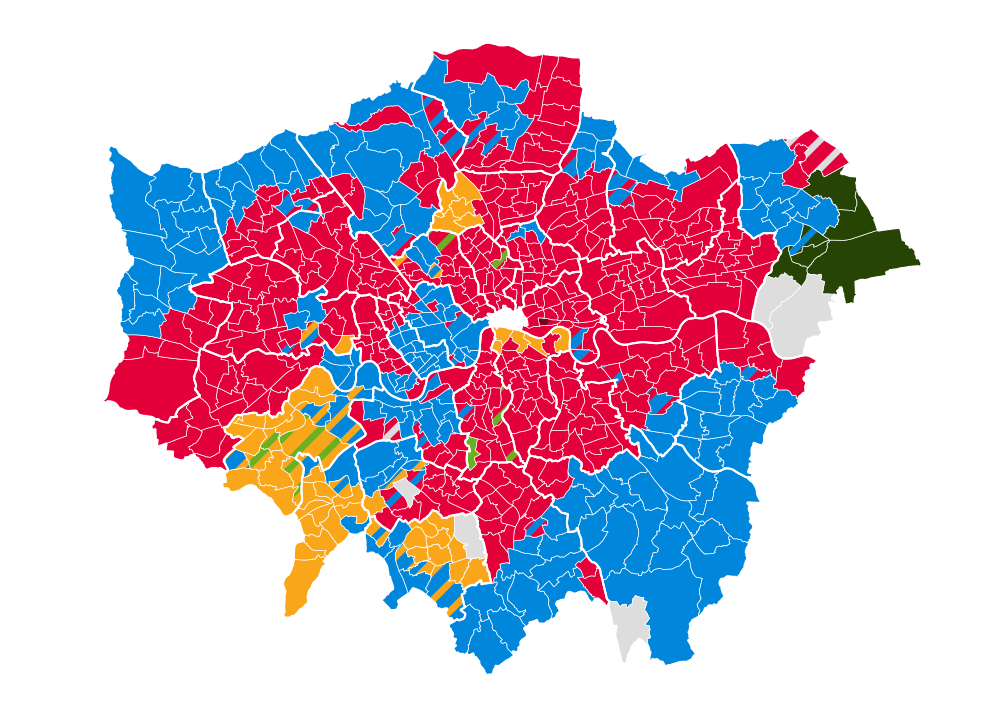
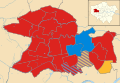
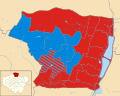
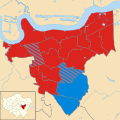
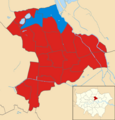
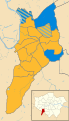
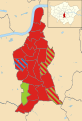
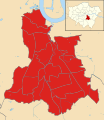
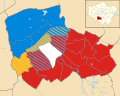
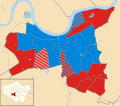
Map showing London borough councils by political control following the elections, as shown in the main table of results. Black denotes no overall control.

*Due to boundary changes, these seat change figures are notional changes calculated by the BBC, and so will not precisely match up with the results of the 2014 London local elections.

The 2018 London local elections took place in London on 3 May 2018 as part of wider local elections in England. All London borough councillor seats were up for election. Elections to the Corporation of London were held in 2017. Mayoral contests were also held in Hackney, Lewisham, Newham and Tower Hamlets. The previous London borough elections were in 2014.

Contents

The results saw the London Labour Party achieve their best result in over 45 years, winning 44% of the vote, 1,128 councillors and control of 21 councils. This represented the party's second-best result in a London local election, only surpassed slightly by its 1971 total. The London Conservatives, by contrast, lost 92 seats to finish with 508 councillors, its lowest-ever tally of seats in a London local election. However, it retained control of 7 councils, having lost two to the London Liberal Democrats. The party's vote share increased by 2%, but at 28.8%, it was still the second-worst popular vote total for the Conservatives in the history of the London Boroughs. The London Liberal Democrats made a recovery from their all-time low in the 2014 election, gaining 34 council seats and winning two councils from the Conservatives. Among the other parties, the London Green Party was the most successful, winning a total of 11 council seats, just below their all-time high of 12 in the 2006 election. Support for the UK Independence Party collapsed, with the party losing all of its seats and dropping from 9.5% of the vote to 0.9%. The only other parties to win seats were the People's Alliance of Tower Hamlets (1 seat) and the Harold Hill Independent Party (1 seat).

Eligibility to vote

All registered electors (British, Irish, Commonwealth and European Union citizens) who are aged 18 or over on polling day were entitled to vote in the local elections. [1] A person who has two homes (such as a university student having a term-time address and living at home during holidays) can register to vote at both addresses as long as they are not in the same electoral area, and can vote in the local elections for the two different local councils. [2]

Results summary

Party [3] Votes won % votesChangeSeats % seatsChangeCouncilsChange
Labour 1,076,61743.9Increase2.svg6.31,12861.5Increase2.svg6721Increase2.svg1
Conservative 707,37328.8Increase2.svg2.450827.7Decrease2.svg927Decrease2.svg2
Liberal Democrats 320,03113.0Increase2.svg2.41528.3Increase2.svg343Increase2.svg2
Green 211,1708.6Decrease2.svg1.2110.6Increase2.svg70Steady2.svg
UKIP 21,0770.9Decrease2.svg8.600.0Decrease2.svg90Steady2.svg
Others118,7694.8Decrease2.svg1.3341.9Increase2.svg70Steady2.svg
No overall control 1Decrease2.svg1

Due to boundary changes, the figures for seat losses/gains are notional changes calculated by the BBC, and do not match up precisely to the London-wide results in 2014.

Councils results

Control

Council2014 resultEve-of-poll control2018 resultTurnout (%)Details
Barking and Dagenham Labour Labour Labour 29.5 Details
Barnet Conservative No overall control Conservative 43.7 Details
Bexley [n 1] Conservative Conservative Conservative 37.5 Details
Brent [n 2] Labour Labour Labour 36.7 Details
Bromley Conservative Conservative Conservative 40.0 Details
Camden Labour Labour Labour 37.3 Details
Croydon Labour Labour Labour 38.1 Details
Ealing Labour Labour Labour 41.3 Details
Enfield Labour Labour Labour 38.2 Details
Greenwich Labour Labour Labour 36.1 Details
Hackney Labour Labour Labour 37.0 Details
Hammersmith and Fulham Labour Labour Labour 39.4 Details
Haringey Labour Labour Labour 38.8 Details
Harrow Labour Labour Labour 41.0 Details
Havering No overall control No overall control No overall control 36.8 Details
Hillingdon Conservative Conservative Conservative 38.3 Details
Hounslow Labour Labour Labour 36.6 Details
Islington Labour Labour Labour 38.4 Details
Kensington and Chelsea Conservative Conservative Conservative 39.7 Details
Kingston upon Thames Conservative Conservative Liberal Democrats 47.3 Details
Lambeth Labour Labour Labour 34.3 Details
Lewisham Labour Labour Labour 37.3 Details
Merton Labour Labour Labour 41.1 Details
Newham Labour Labour Labour 35.8 Details
Redbridge Labour Labour Labour 38.8 Details
Richmond upon Thames Conservative Conservative Liberal Democrats 51.4 Details
Southwark Labour Labour Labour 33.6 Details
Sutton Liberal Democrats Liberal Democrats Liberal Democrats 41.2 Details
Tower Hamlets No overall control No overall control Labour 41.8 Details
Waltham Forest Labour Labour Labour 37.8 Details
Wandsworth Conservative Conservative Conservative 43.6 Details
Westminster Conservative Conservative Conservative 38.0 Details

Councillors

The table below shows the number of councillors won by each party for each council in London. The shaded cells show the party or parties in each council's governing administration.

Council Lab Con Lib Dem Green OthersTurnout (%)Details
Barking and Dagenham 51000029.5 Details
Barnet 253800043.7 Details
Bexley [n 3] 113400037.5 Details
Brent [n 4] 60300036.7 Details
Bromley 8500040.0 Details
Camden 43731037.3 Details
Croydon 412900038.1 Details
Ealing 57840041.3 Details
Enfield 461700038.2 Details
Greenwich 42900036.1 Details
Hackney 52500037.0 Details
Hammersmith and Fulham 351100039.4 Details
Haringey 420150038.8 Details
Harrow 352800041.0 Details
Havering 52500
24
Residents groups: 23 (opposition)
Independent: 1 (coalition)
36.8 Details
Hillingdon 214400038.3 Details
Hounslow 51900036.6 Details
Islington 47001038.4 Details
Kensington and Chelsea 133610039.7 Details
Kingston upon Thames 09390047.3 Details
Lambeth 57105034.3 Details
Lewisham 54000037.3 Details
Merton 34176041.1 Details
Newham 60000035.8 Details
Redbridge 511200038.8 Details
Richmond upon Thames 011394051.4 Details
Southwark 490110033.6 Details
Sutton 01833041.2 Details
Tower Hamlets 4220041.8 Details
Waltham Forest 461400037.8 Details
Wandsworth 26330043.6 Details
Westminster 194100038.0 Details

Mayoral elections

There were four mayoral elections.

Local authorityPrevious MayorNew Mayor
Hackney Philip Glanville (Labour) Philip Glanville (Labour)
Lewisham Steve Bullock (Labour) Damien Egan (Labour)
Newham Robin Wales (Labour) Rokhsana Fiaz (Labour)
Tower Hamlets John Biggs (Labour) [n 5] John Biggs (Labour)

Ward result maps

London-wide

The map below shows the results for each ward across the whole of Greater London.

2018 London local elections results map Citywide ward results of the 2018 London local elections.svg
2018 London local elections results map

By borough

Opinion polling

Date(s)
conducted
Polling organisation/clientSample size Lab Con Lib Dem Green OthersLead
3 May 20182018 electionsn/a43.9%28.8%13.0%8.6%5.7%15.0%
27-30 April 2018 Survation / 4in10 1,00551%31%12%4%2%20%
20-24 April 2018 YouGov / QMUL 1,09951%29%11%4%5%22%
12-15 Feb 2018 YouGov / QMUL 1,15554%28%11%4%3%26%
25-29 Sep 2017 YouGov / QMUL 1,04453%29%12%6%24%
22 May 2014 2014 elections 2,515,07337.6%26.4%10.6%9.8%15.6%11.2%

Notes

  1. In Bexley there were boundary changes and a reduced number of seats in the 2018 election.
  2. In Willesden Green, polling day was delayed to 21 June 2018 due to the death of the local councillor, Lesley Jones, the vacant three seats were eventually won by Labour.
  3. In Bexley there were boundary changes and a reduced number of seats in the 2018 election.
  4. In Willesden Green, polling day was delayed to 21 June 2018 due to the death of the local councillor, Lesley Jones, the vacant three seats were eventually won by Labour.
  5. The 2014 election was initially won by Tower Hamlets First, but this result was overturned by an election court decision and Labour won the following by-election. [4]

    Related Research Articles

    <span class="mw-page-title-main">1964 Greater London Council election</span>

    The first election to the Greater London Council (GLC) was held on 9 April 1964.

    <span class="mw-page-title-main">Bethnal Green and Bow (UK Parliament constituency)</span> UK Parliament constituency in England since 1997

    Bethnal Green and Bow is a constituency in Greater London, represented in the House of Commons of the UK Parliament since 2010 by Rushanara Ali of the Labour Party.

    <span class="mw-page-title-main">Parliamentary constituencies in London</span>

    The region of Greater London, including the City of London, is divided into 73 parliamentary constituencies which are sub-classified as borough constituencies, affecting the type of electoral officer and level of expenses permitted.

    <span class="mw-page-title-main">2006 London local elections</span>

    Local government elections took place in London, and some other parts of the United Kingdom on Thursday 4 May 2006. Polling stations were open between 7am and 10pm.

    <span class="mw-page-title-main">Lewisham London Borough Council elections</span>

    Lewisham London Borough Council is the local authority for the London Borough of Lewisham, in London, United Kingdom. Elections are held every four years using a plurality bloc vote electoral system for the councillors and the supplementary vote electoral system for the elected mayor.

    <span class="mw-page-title-main">1968 London local elections</span>

    Local government elections were held in the thirty-two London boroughs on Thursday 9 May 1968. Polling stations were open between 8am and 9pm.

    <span class="mw-page-title-main">2010 London local elections</span>

    Local government elections took place in London, and some other parts of the United Kingdom on Thursday 6 May 2010. Polling stations were open between 7am and 10pm.

    <span class="mw-page-title-main">2014 London local elections</span>

    There were local government elections in London on Thursday 22 May 2014. All councillor seats on the 32 London borough councils were up for election. The electorates of Hackney, Lewisham, Newham and Tower Hamlets also elected their executive mayors, who operate in place of council leaders in those boroughs. Ward changes took place in Hackney, Kensington and Chelsea, and Tower Hamlets, which reduced the total number of councillors by 10 to 1,851. Both the mayoral and councillor elections are four-yearly.

    <span class="mw-page-title-main">2002 London local elections</span>

    Local government elections took place in London, and some other parts of the United Kingdom on Thursday 2 May 2002. Ward changes took place in every borough, following a series of reviews and 32 statutory instruments which reduced the total number of councillors by 56 from 1,917 to 1,861.

    <span class="mw-page-title-main">2018 United Kingdom local elections</span>

    The 2018 United Kingdom local elections were held on Thursday 3 May 2018, with local council elections taking place in all 32 London boroughs, 34 metropolitan boroughs, 67 district and borough councils and 17 unitary authorities. There were also direct elections for the mayoralties of Hackney, Lewisham, Newham, Tower Hamlets and Watford.

    <span class="mw-page-title-main">2022 London local elections</span>

    The 2022 London local elections took place on 5 May 2022, as part of the 2022 United Kingdom local elections. All London borough councillor seats were up for election. Mayoral elections took place in Hackney, Lewisham, Newham and Tower Hamlets, with Croydon electing a mayor for the first time following a local referendum in October 2021.

    <span class="mw-page-title-main">2022 United Kingdom local elections</span> Elections to local councils and mayoralties

    The 2022 United Kingdom local elections took place on Thursday 5 May 2022. These included elections for all London borough councils, for all local authorities in Wales and Scotland. Most seats in England were last up for election in 2018 and in Scotland and Wales in 2017. The elections coincided with the 2022 Northern Ireland Assembly election. In 91 cases, most of them in Wales, council seats were uncontested, each having only one candidate. Three seats in Scotland remained unfilled as no one nominated to fill them.

    <span class="mw-page-title-main">2022 Bexley London Borough Council election</span> 2022 local election in Bexley

    The 2022 Bexley London Borough Council election took place on 5 May 2022. 45 members of Bexley London Borough Council were elected. The elections took place alongside local elections in the other London boroughs and elections to local authorities across the United Kingdom.

    <span class="mw-page-title-main">2022 Hackney London Borough Council election</span> 2022 local election in Hackney

    The 2022 Hackney London Borough Council election took place on 5 May 2022. All 57 members of Hackney London Borough Council were up for election. The elections took place alongside the election for the mayor of Hackney, local elections in the other London boroughs, and elections to local authorities across the United Kingdom.

    The 2022 Lewisham London Borough Council election took place on 5 May 2022. All 54 members of Lewisham London Borough Council were up for election. The elections took place alongside local elections in the other London boroughs and elections to local authorities across the United Kingdom.

    The 2022 Newham London Borough Council election took place on 5 May 2022. All 66 members of Newham London Borough Council were elected. The election took place alongside local elections in the other London boroughs and elections to local authorities across the United Kingdom.

    The 2022 Southwark London Borough Council election took place on 5 May 2022. All 63 members of Southwark London Borough Council were elected. The elections took place alongside local elections in the other London boroughs and elections to local authorities across the United Kingdom.

    <span class="mw-page-title-main">2022 Tower Hamlets London Borough Council election</span>

    The 2022 Tower Hamlets London Borough Council election took place on 5 May 2022. All 45 members of Tower Hamlets London Borough Council were elected. The elections took place alongside local elections in the other London boroughs and elections to local authorities across the United Kingdom.

    References

    1. "Representation of the People Act 1983, Section 2". Legislation.gov.uk. Retrieved 24 April 2017.
    2. Electoral Commission. "I have two homes. Can I register at both addresses?". electoralcommission.org.uk. The Electoral Commission. Archived from the original on 15 November 2008. Retrieved 24 April 2017.
    3. @BritainElects (22 May 2018). "Ward-by-ward results for the 2018..." (Tweet) via Twitter.
    4. "Tower Hamlets election: Labour's John Biggs named mayor - BBC News". Bbc.com. 12 June 2015. Retrieved 12 April 2017.