| |||||||||||||||||||||||||||||||||||||||||
| |||||||||||||||||||||||||||||||||||||||||
92 councillors 47 seats needed for a majority | |||||||||||||||||||||||||||||||||||||||||
---|---|---|---|---|---|---|---|---|---|---|---|---|---|---|---|---|---|---|---|---|---|---|---|---|---|---|---|---|---|---|---|---|---|---|---|---|---|---|---|---|---|
| |||||||||||||||||||||||||||||||||||||||||
Results by electoral division | |||||||||||||||||||||||||||||||||||||||||
|
The fourth election to the Greater London Council (GLC) was held on 12 April 1973. Labour won a large majority of 58 seats to 32 for the Conservatives; the Liberals also won their first two seats on the council.
As there had been a boundary commission report with new Parliamentary constituencies which coincided with the border of Greater London, the electoral system was changed (as had always been intended) so that the GLC was elected from single member electoral divisions which were identical with the Parliamentary constituencies.
Councillors were elected for a three-year term. This was extended for an extra year in 1976 when the electoral cycle was switched to four-yearly. [1]
The Labour Party won a majority of seats at the election. [2]
With an electorate of 5,313,470, there was a turnout of 36.8%. [3]
Among those who were first elected to the GLC in 1973 were Ken Livingstone (Labour, Lambeth, Norwood), later to lead it, Andrew McIntosh (Labour, Haringey, Tottenham) who was his brief moderate rival for the Labour leadership, and Serge Lourie (Labour, Havering, Hornchurch), who became a founder member of the SDP and leader of Richmond upon Thames London Borough Council in 2001.
Party | Votes | Seats | ||||||
---|---|---|---|---|---|---|---|---|
Number | % | +/- | Stood | Seats | % | +/- | ||
Labour | 928,034 | 47.4 | 7.5 | 92 | 58 | 63.0 | 23 | |
Conservative | 743,123 | 38.0 | 12.6 | 92 | 32 | 34.8 | 33 | |
Liberal | 244,703 | 12.5 | 7.1 | 60 | 2 | 2.2 | 2 | |
Communist | 11,954 | 0.6 | 1.2 | 28 | 0 | 0.0 | ||
National Front | 9,536 | 0.5 | New | 6 | 0 | 0.0 | ||
Residents' or Ratepayers' | 5,516 | 0.3 | New | 3 | 0 | 0.0 | ||
Independent | 4,211 | 0.2 | 0.1 | 15 | 0 | 0.0 | ||
Action | 3,063 | 0.2 | 0.4 | 6 | 0 | 0.0 | ||
National Independence | 2,924 | 0.1 | New | 1 | 0 | 0.0 | ||
Ind. Conservative | 2,393 | 0.1 | New | 2 | 0 | 0.0 | ||
Socialist (GB) | 1,612 | 0.1 | 11 | 0 | 0.0 | |||
Independent Labour | 227 | 0.0 | New | 1 | 0 | 0.0 | ||
In addition to the 92 elected councillors, there were fifteen aldermen elected by the council. Eight aldermen elected in 1970 continued to serve until 1976 and the eight elected in 1967 retired before the 1973 election. Seven aldermen were elected by the council on 4 May 1973 to serve until 1979.
Aldermen elected in 1973, to retire in 1979: [lower-alpha 1]
Party | Alderman | |
---|---|---|
Labour | Richard Collins | |
Labour | Maureen Harwood | |
Labour | Walter Kenneth Mansfield | |
Labour | Stanley Wilfred Mayne | |
Labour | Luke Patrick O'Connor | |
Labour | Oliver Stutchbury [lower-alpha 2] | |
Labour | John Golden Warren |
The aldermen divided 9 Labour and 6 Conservative, so that Labour had 67 members to 38 for the Conservatives following the aldermanic election. It would be the final election of aldermen to the council, with those elected in 1970 and 1973 having their terms altered to all end in 1977. [1]
Members of the old council*
Party | Candidate | Votes | % | ±% | |
---|---|---|---|---|---|
Labour | John Benjamin Ward* | 10,575 | 71.5 | ||
Conservative | C A Pool | 2,417 | 16.3 | ||
Liberal | J D Tyrell | 1,800 | 12.2 | ||
Majority | |||||
Turnout | 29.7 | ||||
Turnout | |||||
Labour win (new boundaries) |
Party | Candidate | Votes | % | ±% | |
---|---|---|---|---|---|
Labour | Robert John Crane* | 13,753 | 72.3 | ||
Conservative | T. A. Woodcock | 2,149 | 11.3 | ||
Liberal | George Daniel Poole | 1,994 | 10.5 | ||
Independent Labour | Vera W Cridland | 564 | |||
Communist | George Charles Wake | 558 | |||
Majority | |||||
Turnout | 27.4 | ||||
Labour win (new seat) |
Party | Candidate | Votes | % | ±% | |
---|---|---|---|---|---|
Conservative | Reginald Marks* | 10,753 | 50.0 | ||
Labour | H. Sprague | 6,035 | 28.0 | ||
Liberal | Margaret Gelling Snow | 4,727 | 22.0 | ||
Majority | |||||
Turnout | 37.9 |
Party | Candidate | Votes | % | ±% | |
---|---|---|---|---|---|
Conservative | Jean Leslie Scott* | 8,008 | 48.9 | ||
Labour | Albert Edward Tomlinson | 5,183 | 31.7 | ||
Liberal | Leonard W. Watkins | 3,175 | 19.4 | ||
Majority | |||||
Turnout | 37.9 |
Party | Candidate | Votes | % | ±% | |
---|---|---|---|---|---|
Labour | Frank Arthur Cooper | 8,925 | 44.2 | ||
Conservative | Rita Maisie Levy* | 8,180 | 40.5 | ||
Liberal | David Hugh Edwards | 3,079 | 15.3 | ||
Majority | |||||
Turnout | 40.7 |
Party | Candidate | Votes | % | ±% | |
---|---|---|---|---|---|
Conservative | Peter Blair Black* | 8,229 | 41.0 | ||
Labour | Mildred Gordon | 6,874 | 34.2 | ||
Liberal | Percy Walter Meyer | 4,992 | 24.8 | ||
Majority | |||||
Turnout | 38.1 |
Party | Candidate | Votes | % | ±% | |
---|---|---|---|---|---|
Conservative | Victor Rae Muske Langton* | 10,025 | 43.1 | ||
Labour | Stanley Wilfred Mayne | 8,924 | 38.4 | ||
Liberal | Wilfrid Pickard | 4,297 | 18.5 | ||
Majority | |||||
Turnout | 45.6 |
Party | Candidate | Votes | % | ±% | |
---|---|---|---|---|---|
Labour | Francis William Archer | 14,168 | 61.9 | ||
Conservative | E. D. Josiffe | 8,717 | 38.1 | ||
Majority | |||||
Turnout | 38.5 |
Party | Candidate | Votes | % | ±% | |
---|---|---|---|---|---|
Conservative | Douglas Melville Fielding* | 10,844 | 48.6 | ||
Labour | John Francis Spellar | 7,217 | 32.3 | ||
Liberal | L. W. Rogers | 4,276 | 19.1 | ||
Majority | |||||
Turnout | 45.2 |
Party | Candidate | Votes | % | ±% | |
---|---|---|---|---|---|
Labour | Norman Howard | 14,123 | 61.6 | ||
Conservative | Alfred Abram Berney* | 7,232 | 31.5 | ||
Liberal | M. H. Habib | 1,115 | 4.9 | ||
Action | Raymond J Noble | 467 | 2.0 | ||
Majority | |||||
Turnout | 35.7 |
Party | Candidate | Votes | % | ±% | |
---|---|---|---|---|---|
Conservative | Alan Hardy* | 14,941 | 49.3 | ||
Labour | Maurice Howard Rosen | 10,143 | 33.4 | ||
Liberal | G. Phelps | 5,262 | 17.3 | ||
Majority | |||||
Turnout | 42.1 |
Party | Candidate | Votes | % | ±% | |
---|---|---|---|---|---|
Labour | Illtyd Harrington* | 14,190 | 66.5 | ||
Conservative | Ruby Georgina Nancy Taylor* | 6,635 | 31.1 | ||
Communist | Leslie George Burt | 503 | 2.4 | ||
Majority | |||||
Turnout | 34.4 |
Party | Candidate | Votes | % | ±% | |
---|---|---|---|---|---|
Conservative | Frank Willie Smith* | 11,142 | 49.6 | ||
Labour | Nicholas John Sharp | 6,357 | 28.3 | ||
Liberal | D. A. Rowe | 4,975 | 22.1 | ||
Majority | |||||
Turnout | 37.6 |
Party | Candidate | Votes | % | ±% | |
---|---|---|---|---|---|
Conservative | Joan Kathleen Wykes | 10,977 | 44.3 | ||
Labour | Walter Kenneth Mansfield | 10,938 | 44.1 | ||
Liberal | John R. Hassall | 2,864 | 11.6 | ||
Majority | |||||
Turnout | 46.3 |
Party | Candidate | Votes | % | ±% | |
---|---|---|---|---|---|
Conservative | Jean Tatham | 15,496 | 44.3 | ||
Liberal | John William Cook | 13,169 | 37.7 | ||
Labour | Christopher Howes | 6,276 | 18.0 | ||
Majority | |||||
Turnout | 53.6 |
Party | Candidate | Votes | % | ±% | |
---|---|---|---|---|---|
Conservative | David Anthony Harris* | 10,012 | 56.0 | ||
Liberal | Mrs M. M. Coulson | 4,124 | 23.1 | ||
Labour | A. W. Wright | 3,534 | 19.8 | ||
Communist | G. Felton | 202 | 1.1 | ||
Majority | |||||
Turnout | 36.7 |
Party | Candidate | Votes | % | ±% | |
---|---|---|---|---|---|
Labour | Enid Barbara Wistrich | 12,268 | 48.0 | ||
Conservative | I. Clarke | 9,823 | 38.4 | ||
Liberal | Raymond Arthur Philip Benad | 2,824 | 11.0 | ||
Communist | R. Champion | 466 | |||
Socialist (GB) | L. J. Cox | 191 | |||
Majority | |||||
Turnout |
Party | Candidate | Votes | % | ±% | |
---|---|---|---|---|---|
Labour | Alexander John Kazantzis* | 7,437 | 60.6 | ||
Conservative | David P Weeks | 3,520 | 28.7 | ||
Liberal | A. Elithorn | 1,085 | 8.8 | ||
Socialist (GB) | Mrs D. M. Davies | 99 | |||
Independent | Noel S. Fierz | 72 | |||
Independent | P. Goulstone | 60 | |||
Majority | |||||
Turnout | 30.9 |
Party | Candidate | Votes | % | ±% | |
---|---|---|---|---|---|
Labour | Rose Hacker | 9,915 | 67.7 | ||
Conservative | Nicholas J Bennett | 4,226 | 28.9 | ||
Communist | V. A. Heath | 497 | 3.4 | ||
Majority | |||||
Turnout | 35.1 |
Party | Candidate | Votes | % | ±% | |
---|---|---|---|---|---|
Labour | David Frank White | 13,029 | 46.3 | ||
Conservative | Sonia Copland | 10,914 | 38.8 | ||
Liberal | Roy A Lightwing | 3,965 | 14.1 | ||
Independent | J T E A Waddell | 241 | 0.8 | ||
Majority | |||||
Turnout |
Party | Candidate | Votes | % | ±% | |
---|---|---|---|---|---|
Labour | David Howard Simpson | 10,340 | 43.8 | ||
Conservative | Gladys Emma Morgan* | 10,329 | 43.8 | ||
Liberal | Brian F Steggles | 2,940 | 12.4 | ||
Majority | |||||
Turnout | 40.2 |
Party | Candidate | Votes | % | ±% | |
---|---|---|---|---|---|
Labour | Dudley Eric Reynolds Barker | 9,458 | 44.0 | ||
Conservative | Stephen James Stewart* | 8,965 | 41.7 | ||
Liberal | Leo C. E. Held | 3,074 | 14.3 | ||
Majority | |||||
Turnout | 38.9 |
Party | Candidate | Votes | % | ±% | |
---|---|---|---|---|---|
Conservative | Geoffrey Weston Aplin* | 14,885 | 61.5 | ||
Liberal | Jean Pearson Coleman | 6,186 | 25.6 | ||
Labour | Mrs Mary E. Curson | 2,880 | 11.9 | ||
Ratepayers | S. B. Stray | 234 | 1.0 | ||
Majority | |||||
Turnout | 40.3 |
Party | Candidate | Votes | % | ±% | |
---|---|---|---|---|---|
Conservative | John Chaytor Dobson* | 10,576 | 45.7 | ||
Labour | Oliver Piers Stutchbury | 9,665 | 41.7 | ||
Liberal | N. J. Reed | 2,616 | 11.3 | ||
Communist | H. A. Tank | 303 | 1.3 | ||
Majority | |||||
Turnout | 40.7 |
Party | Candidate | Votes | % | ±% | |
---|---|---|---|---|---|
Labour | David Michael Mason | 19,013 | 54.9 | ||
Conservative | Michael William Walter Farrow* | 15,361 | 45.1 | ||
Majority | |||||
Turnout | 47.4 |
Party | Candidate | Votes | % | ±% | |
---|---|---|---|---|---|
Labour | Yvonne Sieve | 14,442 | 59.4 | ||
Conservative | Robert Charles Patten | 9,876 | 40.6 | ||
Majority | |||||
Turnout | 35.0 |
Party | Candidate | Votes | % | ±% | |
---|---|---|---|---|---|
Labour | Bernard Stephen Mason | 11,085 | 53.6 | ||
Conservative | John William Victor Attwood | 7,256 | 35.1 | ||
Liberal | Ralph J R Scott | 1,870 | 9.1 | ||
Action | Martin F. Moloney | 457 | 2.2 | ||
Majority | |||||
Turnout |
Party | Candidate | Votes | % | ±% | |
---|---|---|---|---|---|
Labour | John Howard White | 11,202 | 37.1 | ||
Liberal | L Eric L Ridge | 11,062 | 36.6 | ||
Conservative | Bryan Michael Deece Cassidy | 6,725 | 22.3 | ||
National Front | Kenneth Thomas Robinson | 1,204 | 4.0 | ||
Majority | |||||
Turnout | 44.6 |
Party | Candidate | Votes | % | ±% | |
---|---|---|---|---|---|
Conservative | Thomas Broughton Mitcheson* | 15,857 | 58.5 | ||
Liberal | Dennis Alan Coberman | 5,896 | 21.8 | ||
Labour | B M Barbuk | 5,342 | 19.7 | ||
Majority | |||||
Turnout | 38.4 |
Party | Candidate | Votes | % | ±% | |
---|---|---|---|---|---|
Labour | Peggy Arline Middleton* | 13,953 | 68.4 | ||
Conservative | J A B Kind | 6,440 | 31.6 | ||
Majority | |||||
Turnout | 38.9 |
Party | Candidate | Votes | % | ±% | |
---|---|---|---|---|---|
Labour | Mair Eluned Garside* | 11,880 | 67.2 | ||
Conservative | A R Dix | 3,164 | 17.9 | ||
Liberal | Robert H Smith | 1,860 | 10.5 | ||
Action | J P Sibley | 442 | |||
Communist | Arthur A R Curtis | 332 | |||
Majority | |||||
Turnout | 34.8 |
Party | Candidate | Votes | % | ±% | |
---|---|---|---|---|---|
Labour | Margaret Rees | 13,466 | |||
Conservative | Mrs Wendy Mitchell | 9,867 | |||
Liberal | James Douglas Eagle | 2,401 | |||
Majority | |||||
Turnout |
Party | Candidate | Votes | % | ±% | |
---|---|---|---|---|---|
Labour | Ellis Simon Hillman* | 9,265 | |||
Conservative | Stanley J. Sorrell | 1,770 | |||
Independent | O. Hales | 266 | |||
Majority | |||||
Turnout |
Party | Candidate | Votes | % | ±% | |
---|---|---|---|---|---|
Labour | David Thomas Pitt* | 6,529 | |||
Conservative | Leslie R. House | 2,524 | |||
Communist | Monty Goldman | 621 | |||
Socialist (GB) | J. Carter | 250 | |||
Majority | |||||
Turnout |
Party | Candidate | Votes | % | ±% | |
---|---|---|---|---|---|
Labour | Irene Chaplin | 8,473 | |||
Conservative | E. Laws | 1,586 | |||
Independent | V. A. C. Curtis | 325 | |||
Action | D. H. England | 290 | |||
Independent | B. M. Lampert | 154 | |||
Majority | |||||
Turnout |
Curtis - Parent Action Group for Education
Party | Candidate | Votes | % | ±% | |
---|---|---|---|---|---|
Labour | Anthony Louis Banks* | 15,176 | |||
Conservative | A F E Johnson | 9,926 | |||
Liberal | Derek J P Honeygold | 2,002 | |||
Independent | M S Ashworth | 202 | |||
Majority | |||||
Turnout |
Ashworth - Centre Party
Party | Candidate | Votes | % | ±% | |
---|---|---|---|---|---|
Labour | Iris Mary Caroline Bonham* | 13,529 | |||
Conservative | William Christopher Smith | 7,031 | |||
Liberal | Mrs F M Abrahams | 2,095 | |||
Majority | |||||
Turnout |
Party | Candidate | Votes | % | ±% | |
---|---|---|---|---|---|
Conservative | Lawrence Arthur Bains* | 10,361 | |||
Labour | John Golden Warren | 10,078 | |||
Liberal | Patrick William O'Brien | 3,450 | |||
Communist | B P Van den Berg | 483 | |||
Socialist (GB) | D J Porter | 144 | |||
Majority | |||||
Turnout |
Party | Candidate | Votes | % | ±% | |
---|---|---|---|---|---|
Labour | Andrew Robert McIntosh | 8,043 | |||
Conservative | John Antony Croft | 3,360 | |||
National Independence | Michael Paul Coney | 2,924 | |||
Socialist (GB) | Mrs A Young | 109 | |||
Majority | |||||
Turnout |
Party | Candidate | Votes | % | ±% | |
---|---|---|---|---|---|
Labour | Stephen Michael Alan Haseler | 10,305 | |||
Conservative | Rodney Charles Gent | 5,862 | |||
Majority | |||||
Turnout |
Party | Candidate | Votes | % | ±% | |
---|---|---|---|---|---|
Conservative | William Sydney Clack* | 7,812 | |||
Labour | Alfred J. Lovell | 7,379 | |||
Liberal | N. G. Marcus | 2,666 | |||
National Front | R. Franklin | 1,361 | |||
Majority | |||||
Turnout |
Party | Candidate | Votes | % | ±% | |
---|---|---|---|---|---|
Conservative | Harold Trevor Mote* | 10,432 | |||
Labour | J. C. Powell | 10,217 | |||
Communist | Reginald A. Ward | 460 | |||
Majority | |||||
Turnout |
Party | Candidate | Votes | % | ±% | |
---|---|---|---|---|---|
Conservative | Horace Walter Cutler | 12,498 | |||
Labour | N. A. Hyman | 5,407 | |||
Liberal | Henry Young | 5,230 | |||
Action | R. C. Ramage | 947 | |||
Majority | |||||
Turnout |
Party | Candidate | Votes | % | ±% | |
---|---|---|---|---|---|
Labour | Alexander Serge Lourie | 10,714 | |||
Conservative | Ronald Dennis Mitchell | 7,114 | |||
Liberal | Brian George McCarthy | 3,666 | |||
Non-Party Conservationist | Benjamin Percy-Davis | 1,908 | |||
Majority | |||||
Turnout |
Party | Candidate | Votes | % | ±% | |
---|---|---|---|---|---|
Conservative | Bernard Brook-Partridge* | 9,697 | |||
Labour | K. St. J. D'Cruze | 7,219 | |||
Liberal | Terry Edward Hurlstone | 4,693 | |||
Communist | Colin R Harper | 347 | |||
Majority | |||||
Turnout |
Party | Candidate | Votes | % | ±% | |
---|---|---|---|---|---|
Conservative | Shelagh Marjorie Roberts* | 11,425 | |||
Labour | Maureen Harwood | 10,687 | |||
Liberal | R. E. Jenking | 4,408 | |||
Majority | |||||
Turnout |
Party | Candidate | Votes | % | ±% | |
---|---|---|---|---|---|
Labour | Peter Frank Norman Russell | 13,576 | |||
Conservative | Robert Gurth Hughes | 5,637 | |||
National Front | John Stanley Fairhurst | 1,821 | |||
Communist | Peter R Pink | 317 | |||
Majority | |||||
Turnout |
Party | Candidate | Votes | % | ±% | |
---|---|---|---|---|---|
Conservative | Bernard Joseph Brown* | 13,263 | |||
Labour | John S Gallagher | 6,395 | |||
Liberal | George Raymond Stephenson | 5,108 | |||
Majority | |||||
Turnout |
Party | Candidate | Votes | % | ±% | |
---|---|---|---|---|---|
Conservative | James Anthony Lemkin | 11,540 | |||
Labour | Cyril Shaw | 10,571 | |||
Liberal | Brian Outhwaite | 4,129 | |||
Action | M. N. Griffin | 460 | |||
Majority | |||||
Turnout |
Party | Candidate | Votes | % | ±% | |
---|---|---|---|---|---|
Labour | James Daly | 17,428 | |||
Conservative | Andrew Jardine* | 15,131 | |||
Majority | |||||
Turnout |
Party | Candidate | Votes | % | ±% | |
---|---|---|---|---|---|
Labour | Douglas Eden | 16,529 | |||
Conservative | Dyas Cyril Loftus Usher* | 9,173 | |||
National Front | Josephine Mary Reid | 3,332 | |||
Communist | P Rhodes | 379 | |||
Majority | |||||
Turnout |
Party | Candidate | Votes | % | ±% | |
---|---|---|---|---|---|
Labour | Evelyn Joyce Denington | 8,996 | |||
Conservative | Mrs B A Devonald-Lewis | 2,936 | |||
Liberal | Alan A S Butt Philip | 2,139 | |||
Majority | |||||
Turnout |
Party | Candidate | Votes | % | ±% | |
---|---|---|---|---|---|
Labour | Louis Wolfgang Bondy* | 7,463 | |||
Conservative | Timothy Stephen Kenneth Yeo | 2,798 | |||
Socialist (GB) | A J L Buick | 284 | |||
Majority | |||||
Turnout |
Party | Candidate | Votes | % | ±% | |
---|---|---|---|---|---|
Labour | Arthur Ernest Wicks* | 9,850 | |||
Conservative | S G Parker | 2,969 | |||
Communist | Marie Betteridge | 538 | |||
Majority | |||||
Turnout |
Party | Candidate | Votes | % | ±% | |
---|---|---|---|---|---|
Conservative | William Archibald Ottley Juxon Bell* | 12,811 | |||
Labour | S. H. Shapiro | 4,531 | |||
Majority | |||||
Turnout |
Party | Candidate | Votes | % | ±% | |
---|---|---|---|---|---|
Conservative | Robert Louis Vigars | 9,388 | |||
Labour | D. J. Scott | 8,736 | |||
Liberal | K. Rason | 2,855 | |||
Communist | Edward S. Adams | 366 | |||
Majority | |||||
Turnout |
Party | Candidate | Votes | % | ±% | |
---|---|---|---|---|---|
Conservative | Sydney William Leonard Ripley* | 12,145 | |||
Labour | Peter W Lane | 6,855 | |||
Liberal | Mrs L F Wells | 4,224 | |||
Majority | |||||
Turnout |
Party | Candidate | Votes | % | ±% | |
---|---|---|---|---|---|
Conservative | Geoffrey John David Seaton* | 8,821 | |||
Labour | Robert R G Viner | 5,972 | |||
Liberal | T. A. Channings | 3,966 | |||
Independent | Edgar Scruby | 303 | |||
Majority | |||||
Turnout |
Scruby - Surbiton Residents & Ratepayers
Party | Candidate | Votes | % | ±% | |
---|---|---|---|---|---|
Labour | Anna Lloyd Grieves* | 9,231 | |||
Conservative | John Laurence Pritchard | 2,707 | |||
Liberal | J. T. Kane | 1,026 | |||
Independent | C. G. Jackson | 143 | |||
Socialist (GB) | H. G. Baldwin | 115 | |||
Independent | G. W. Solomon | 103 | |||
Majority | |||||
Turnout |
Party | Candidate | Votes | % | ±% | |
---|---|---|---|---|---|
Labour | Kenneth Robert Livingstone | 11,622 | |||
Conservative | Michael Peter Russell Malynn* | 8,007 | |||
Liberal | Michael Frederick Drake | 1,819 | |||
Socialist (GB) | H. Young | 95 | |||
Majority | |||||
Turnout |
Party | Candidate | Votes | % | ±% | |
---|---|---|---|---|---|
Conservative | Diana Elizabeth Geddes* | 10,492 | |||
Labour | Hugh H. Walker | 9,426 | |||
Liberal | Allan Mitchell | 2,114 | |||
Socialist (GB) | F. W. Simkins | 120 | |||
Independent | William George Boaks | 57 | |||
Majority | |||||
Turnout |
Boaks - Air Road Public Safety White Resident
Party | Candidate | Votes | % | ±% | |
---|---|---|---|---|---|
Labour | Ewan Geddes Carr* | 10,821 | |||
Conservative | Peter James Bottomley | 3,396 | |||
Communist | J. A. Henry | 365 | |||
Socialist (GB) | M. E. Sansum | 121 | |||
Majority | |||||
Turnout |
Party | Candidate | Votes | % | ±% | |
---|---|---|---|---|---|
Labour | David Walter Chalkley* | 13,159 | |||
Conservative | I M Andrews | 4,805 | |||
Liberal | Eric Reginald Lubbock | 1,747 | |||
Majority | |||||
Turnout |
Party | Candidate | Votes | % | ±% | |
---|---|---|---|---|---|
Labour | John Charles Henry* | 16,721 | |||
Conservative | T M Aitken | 8,913 | |||
Liberal | L Spicer | 4,182 | |||
Communist | Michael Power | 461 | |||
Majority | |||||
Turnout |
Party | Candidate | Votes | % | ±% | |
---|---|---|---|---|---|
Labour | William Colbert Simson | 13,930 | |||
Conservative | Michael John Wheeler | 11,667 | |||
Communist | M H Robinson | 621 | |||
Majority | |||||
Turnout |
Party | Candidate | Votes | % | ±% | |
---|---|---|---|---|---|
Labour | Anthony Robert Judge | 14,628 | |||
Conservative | Miss J R Yarwood | 10,060 | |||
Independent | Grace Louisa Giddins | 875 | |||
Communist | Sidney Ernest French | 485 | |||
Majority | |||||
Turnout |
Party | Candidate | Votes | % | ±% | |
---|---|---|---|---|---|
Conservative | Stanley Charles Bolton* | 14,506 | |||
Labour | Keith Bill | 8,389 | |||
Liberal | Peter Charles Spratling | 6,419 | |||
Majority | |||||
Turnout |
Party | Candidate | Votes | % | ±% | |
---|---|---|---|---|---|
Labour | Thomas Alfred Jenkinson | 9,183 | 52.9 | ||
Independent | R. F. C. Ower | 5,110 | 29.5 | ||
Conservative | Timothy John Stroud | 2,828 | 16.3 | ||
Independent Labour | M. Flaherty | 227 | 1.3 | ||
Majority | 4,073 | 23.4 | |||
Turnout | 26.1 |
Ower - Ratepayers & Citizens Association
Party | Candidate | Votes | % | ±% | |
---|---|---|---|---|---|
Labour | Arthur Frank George Edwards* | 8,031 | 80.5 | ||
Conservative | Samuel M Swerling | 1,951 | 19.5 | ||
Majority | 6,080 | 61.0 | |||
Turnout | 18.9 |
Party | Candidate | Votes | % | ±% | |
---|---|---|---|---|---|
Labour | Edward Percy Bell* | 10,024 | 82.0 | ||
Conservative | John Johnston | 1,579 | 12.9 | ||
Communist | R. A. Offley | 623 | 5.1 | ||
Majority | 8,445 | 69.1 | |||
Turnout | 21.3 |
Party | Candidate | Votes | % | ±% | |
---|---|---|---|---|---|
Labour | Timothy J. Ridoutt | 9,999 | |||
Conservative | Neil Gordon Thorne* | 9,537 | |||
Liberal | Gareth Laurence Philip Wilson | 4,410 | |||
Majority | |||||
Turnout |
Party | Candidate | Votes | % | ±% | |
---|---|---|---|---|---|
Labour | Dennis Annesley Carradice | 9,678 | |||
Conservative | P A Chalkley | 8,556 | |||
Liberal | Gerald Leslie Wilson | 3,232 | |||
Communist | B S Wallington | 294 | |||
Majority | |||||
Turnout |
Party | Candidate | Votes | % | ±% | |
---|---|---|---|---|---|
Conservative | Robert Mitchell* | 11,439 | |||
Labour | G J Clark | 4,176 | |||
Liberal | David John Gilby | 3,411 | |||
Majority | |||||
Turnout |
Party | Candidate | Votes | % | ±% | |
---|---|---|---|---|---|
Liberal | Anthony Stanley Richard Rundle | 12,160 | 44.2 | ||
Conservative | B. S. Feldman | 9,312 | 33.8 | ||
Labour | Kenneth L Elmes | 5,796 | 21.1 | ||
Communist | Ms E. Tendler | 250 | 0.9 | ||
Majority | |||||
Turnout | 27,518 |
Party | Candidate | Votes | % | ±% | |
---|---|---|---|---|---|
Conservative | George William Tremlett | 13,765 | |||
Labour | P. T. Z. Goldring | 12,386 | |||
Liberal | Cyril J. Barnes | 5,625 | |||
Majority | |||||
Turnout |
Party | Candidate | Votes | % | ±% | |
---|---|---|---|---|---|
Labour | Reginald Eustace Goodwin | 14,617 | |||
Conservative | Alexander J Padmore | 1,480 | |||
National Front | R. S. Pritchard | 992 | |||
Majority | |||||
Turnout |
Party | Candidate | Votes | % | ±% | |
---|---|---|---|---|---|
Labour | Richard Andrew Balfe | 14,184 | |||
Conservative | A. P. Berend | 9,222 | |||
Liberal | C. M. Hall | 2,853 | |||
Communist | Eric L. Hodson | 431 | |||
Majority | |||||
Turnout |
Party | Candidate | Votes | % | ±% | |
---|---|---|---|---|---|
Labour | Harvey W. Hinds* | 14,134 | |||
Conservative | Nicholas Brian Baker | 2,214 | |||
Majority | |||||
Turnout |
Party | Candidate | Votes | % | ±% | |
---|---|---|---|---|---|
Labour | Phillip John Bassett | 11,611 | |||
Conservative | George Frederick Everitt* | 11,239 | |||
Liberal | C Clark | 7,094 | |||
Majority | |||||
Turnout |
Party | Candidate | Votes | % | ±% | |
---|---|---|---|---|---|
Liberal | Ruth Mary Shaw | 15,515 | 53.3 | ||
Conservative | Alan Horace Lewis Leach | 10,367 | 35.6 | ||
Labour | Peter L Spalding | 3,209 | 11.0 | ||
Majority | 5,148 | 17.7 | |||
Turnout | 2,9091 |
Party | Candidate | Votes | % | ±% | |
---|---|---|---|---|---|
Labour | Ernest Ashley Bramall | 10,802 | |||
Conservative | L. E. Smith | 899 | |||
Independent | J. P. Collins | 467 | |||
Majority | |||||
Turnout |
Party | Candidate | Votes | % | ±% | |
---|---|---|---|---|---|
Labour | John Patrick Branagan | 13,062 | |||
Conservative | P. E. Bridge | 782 | |||
Communist | Max Samuel Levitas | 703 | |||
Majority | |||||
Turnout |
Party | Candidate | Votes | % | ±% | |
---|---|---|---|---|---|
Conservative | Richard Maddock Brew* | 9,905 | |||
Labour | F F Land | 7,520 | |||
Liberal | Barry R Woodward | 5,685 | |||
Majority | |||||
Turnout |
Party | Candidate | Votes | % | ±% | |
---|---|---|---|---|---|
Labour | John James Walsh | 11,240 | |||
Conservative | G P Waller | 6,485 | |||
Communist | John Arthur Courcouf | 646 | |||
Majority | |||||
Turnout |
Party | Candidate | Votes | % | ±% | |
---|---|---|---|---|---|
Labour | Robin Ainsworth Raine Young | 9,545 | |||
Conservative | Phillip Charles Desmond Williams* | 4,381 | |||
Liberal | Martin D Silverston | 2,724 | |||
Majority | |||||
Turnout |
Party | Candidate | Votes | % | ±% | |
---|---|---|---|---|---|
Labour | Gladys Felicia Dimson* | 11,542 | |||
Conservative | D. J. Wedgwood | 3,407 | |||
Majority | |||||
Turnout |
Party | Candidate | Votes | % | ±% | |
---|---|---|---|---|---|
Labour | Stephen Robert Hatch | 8,601 | |||
Conservative | Lynda Chalker | 6,224 | |||
Liberal | Cecil Victor Gittins | 1,559 | |||
National Front | Tom Lamb | 826 | |||
Majority | |||||
Turnout |
Party | Candidate | Votes | % | ±% | |
---|---|---|---|---|---|
Labour | Ethel Marie Jenkins* | 15,449 | |||
Conservative | Margaret Williams | 11,282 | |||
Liberal | Walter V Hain | 3,649 | |||
Communist | David John Welsh | 375 | |||
Majority | |||||
Turnout |
Party | Candidate | Votes | % | ±% | |
---|---|---|---|---|---|
Labour | Lilias Girdwood Gillies | 11,783 | |||
Conservative | N. R. Berry | 6,162 | |||
Communist | Robert E. Lewis | 417 | |||
Majority | |||||
Turnout |
Party | Candidate | Votes | % | ±% | |
---|---|---|---|---|---|
Conservative | Mervyn Nelson Scorgie* | 9,152 | |||
Labour | Philip John Turner | 4,993 | |||
Liberal | R. W. Jones | 4,993 | |||
Independent | A Wilson | 195 | |||
Independent | P.A. Clifford | 184 | |||
Majority | |||||
Turnout |
Wilson - Anti-Mass Redevelopment
Party | Candidate | Votes | % | ±% | |
---|---|---|---|---|---|
Labour | Jean Merriton | 11,085 | |||
Conservative | Herbert Henry Sandford | 7,101 | |||
Liberal | John H. Gover | 1,609 | |||
Independent | D. J. B. Morgan | 172 | |||
Majority | |||||
Turnout |
Party | Candidate | Votes | % | ±% | |
---|---|---|---|---|---|
Conservative | Arthur Desmond Herne Plummer* | 7,930 | |||
Labour | Jeremy Gordon | 4,971 | |||
Unofficial Conservative | P. Darvas | 485 | |||
Communist | L. R. Temple | 276 | |||
Socialist (GB) | R. A. Weidberg | 84 | |||
Majority | |||||
Turnout |
The first by-election of the term was caused by the court voiding the election in Croydon North East (see Morgan v Simpson ). The former Conservative member Billie Morgan regained the seat she had narrowly lost in Croydon North East on 5 September 1974. Labour retained seats in Greenwich on 24 October 1974 and Dagenham on 30 January 1975 caused by the deaths of sitting councillors. The Conservatives kept their seat in Finchley on 15 May 1975 caused by the resignation of Roland Freeman and St Marylebone on 8 April 1976 caused by the resignation of former GLC leader Desmond Plummer.
There was one aldermanic by-election caused by the resignation of Oliver Piers Stutchbury (Labour) in 1976. Alfred Frederick Joseph Chorley (Labour) was elected by the council on 21 September 1976, to serve until 1977. [lower-alpha 3]
The Greater London Council (GLC) was the top-tier local government administrative body for Greater London from 1965 to 1986. It replaced the earlier London County Council (LCC) which had covered a much smaller area. The GLC was dissolved in 1986 by the Local Government Act 1985 and its powers were devolved to the London boroughs and other entities. A new administrative body, known as the Greater London Authority (GLA), was established in 2000.
The first election to the Greater London Council (GLC) was held on 9 April 1964.
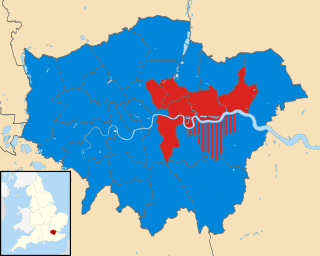
The second election to the Greater London Council was held on 13 April 1967, and saw the first Conservative victory for a London-wide authority since 1931.
The third election to the Greater London Council was held on 9 April 1970 and saw a Conservative victory with a reduced majority.
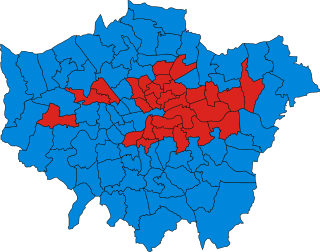
The fifth election to the Greater London Council (GLC) was held on 5 May 1977. The Conservatives, led by Horace Cutler, gained control of the council from Labour.
The first elections to the new local authorities established by the Local Government Act 1972 in England and Wales and the new Northern Ireland district councils created by the Local Government Act 1972 took place in 1973. Elections to the existing Greater London Council also took place.
An election to the County Council of London took place on 5 March 1913. It was the ninth triennial election of the whole Council. The size of the council was 118 councillors and 19 aldermen. The councillors were elected for electoral divisions corresponding to the parliamentary constituencies that had been created by the Representation of the People Act 1884. There were 57 dual member constituencies and one four member constituency. The council was elected by First Past the Post with each elector having two votes in the dual member seats. Unlike for parliamentary elections, women qualified as electors for these elections on exactly the same basis as men. Women were also permitted to stand as candidates for election.
An election to the County Council of London took place on 6 March 1919. It was the tenth triennial election of the whole Council. The size of the council was increased to 124 councillors and 20 aldermen. The councillors were elected for electoral divisions corresponding to the new parliamentary constituencies that had been created by the Representation of the People Act 1918. There were 60 dual-member constituencies and one four-member constituency. The council was elected by First Past the Post, with each elector having two votes in the dual-member seats.
The 1964 London local elections were held on 7 May 1964 alongside nationwide elections. They were the inaugural elections for the thirty-two London boroughs, which were created on 1 April 1965 by the London Government Act 1963. All seats were up for election, with polling stations open between 08:00 and 21:00.
Norwood was an electoral division for the purposes of elections to the Greater London Council. The constituency elected one councillor for a four-year term in 1973, 1977 and 1981, with the final term extended for an extra year ahead of the abolition of the Greater London Council.
Vauxhall was an electoral division for the purposes of elections to the Greater London Council. The constituency elected one councillor for a four-year term in 1973, 1977 and 1981, with the final term extended for an extra year ahead of the abolition of the Greater London Council.
Lambeth Central was an electoral division for the purposes of elections to the Greater London Council. The constituency elected one councillor for a four-year term in 1973, 1977 and 1981, with the final term extended for an extra year ahead of the abolition of the Greater London Council.
Streatham was an electoral division for the purposes of elections to the Greater London Council. The constituency elected one councillor for a four-year term in 1973, 1977 and 1981, with the final term extended for an extra year ahead of the abolition of the Greater London Council.
Newham North East was an electoral division for the purposes of elections to the Greater London Council. The constituency elected one councillor for a four-year term in 1973, 1977 and 1981, with the final term extended for an extra year ahead of the abolition of the Greater London Council.
Croydon North West was an electoral division for the purposes of elections to the Greater London Council. The constituency elected one councillor for a four-year term in 1973, 1977 and 1981, with the final term extended for an extra year ahead of the abolition of the Greater London Council.
Croydon South was an electoral division for the purposes of elections to the Greater London Council. The constituency elected one councillor for a four-year term in 1973, 1977 and 1981, with the final term extended for an extra year ahead of the abolition of the Greater London Council.
Croydon Central was an electoral division for the purposes of elections to the Greater London Council. The constituency elected one councillor for a four-year term in 1973, 1977 and 1981, with the final term extended for an extra year ahead of the abolition of the Greater London Council.
Croydon North East was an electoral division for the purposes of elections to the Greater London Council. The constituency elected one councillor for a four-year term in 1973, 1977 and 1981, with the final term extended for an extra year ahead of the abolition of the Greater London Council.
Hornsey was an electoral division for the purposes of elections to the Greater London Council. The constituency elected one councillor for a four-year term in 1973, 1977 and 1981, with the final term extended for an extra year ahead of the abolition of the Greater London Council.