| |||||||||||||||||||||||||||||||||||||||||
50 seats up for election to Kingston upon Thames London Borough Council 26 seats needed for a majority | |||||||||||||||||||||||||||||||||||||||||
---|---|---|---|---|---|---|---|---|---|---|---|---|---|---|---|---|---|---|---|---|---|---|---|---|---|---|---|---|---|---|---|---|---|---|---|---|---|---|---|---|---|
Registered | 94,678 [1] | ||||||||||||||||||||||||||||||||||||||||
Turnout | 53,403, 56.41% [1] | ||||||||||||||||||||||||||||||||||||||||
| |||||||||||||||||||||||||||||||||||||||||
|
The 1990 Kingston upon Thames Council election took place on 3 May 1990 to elect members of Kingston upon Thames London Borough Council in London, England. The whole council was up for election and the council stayed in no overall control. [2] [3]
Party | Seats | Gains | Losses | Net gain/loss | Seats % | Votes % | Votes | +/− | |
---|---|---|---|---|---|---|---|---|---|
Conservative | 25 | 6 | 5 | 1 | 50.00 | 41.52 | 54,044 | ||
Liberal Democrats | 18 | 3 | 7 | 4 | 36.00 | 30.30 | 39,433 | ||
Labour | 7 | 3 | 0 | 3 | 14.00 | 25.96 | 33,784 | ||
Green | 0 | 0 | 0 | 0.00 | 1.68 | 2,188 | |||
Independent | 0 | 0 | 0 | 0.00 | 0.54 | 706 | |||
Total | 50 | 130,155 |
7 | 18 | 25 |
Labour | Liberal Democrats | Conservative |
(*) - Indicates an lncumbent candidate
Party | Candidate | Votes | % | |
---|---|---|---|---|
Conservative | Peter C. Gray* | 1,775 | 55.48 | |
Conservative | Edna M. Gray* | 1,773 | ||
Conservative | Paul N.H. Clokie* | 1,736 | ||
Labour | John A. Lee | 668 | 19.12 | |
Labour | Sylvia Denham | 595 | ||
Labour | William S. Mutimer | 557 | ||
Lib Dem Focus Team | Rosemary A. Tatler | 469 | 14.27 | |
Liberal Democrats | Rusi Kerr-Waller | 449 | ||
Liberal Democrats | Sallu A. Bernstone | 441 | ||
Independent | Edgar Scruby | 394 | 11.12 | |
Independent | Peter G. Bell | 312 | ||
Registered electors | 6,231 | |||
Turnout | 3,255 | 52.24 | ||
Rejected ballots | 12 | 0.37 | ||
Conservative hold | ||||
Party | Candidate | Votes | % | |
---|---|---|---|---|
Lib Dem Focus Team | Derek R. Osbourne* | 1,166 | 49.80 | |
Lib Dem Focus Team | Adrian J. McLeay | 1,139 | ||
Conservative | Douglas V.P. Frost | 768 | 33.09 | |
Conservative | Michael G. Amson | 764 | ||
Labour | Barry J. Whatley | 400 | 17.11 | |
Labour | Mark D. Agnew | 391 | ||
Registered electors | 4,047 | |||
Turnout | 2,457 | 60.71 | ||
Rejected ballots | 2 | 0.08 | ||
Lib Dem Focus Team hold | ||||
Party | Candidate | Votes | % | |
---|---|---|---|---|
Lib Dem Focus Team | Julie A. Haines* | 1,647 | 47.81 | |
Lib Dem Focus Team | Ian Manders* | 1,641 | ||
Lib Dem Focus Team | Claire V. Jackson* | 1,625 | ||
Conservative | Roderick F. Scott | 1,384 | 39.87 | |
Conservative | Peter F. Groves | 1,361 | ||
Conservative | John S. Moloney | 1,354 | ||
Labour | Audrey M. Barker | 438 | 12.32 | |
Labour | Christopher R. Priest | 425 | ||
Labour | Rosemary L. Webb | 404 | ||
Registered electors | 5,586 | |||
Turnout | 3,593 | 64.32 | ||
Rejected ballots | 5 | 0.14 | ||
Lib Dem Focus Team hold | ||||
Party | Candidate | Votes | % | |
---|---|---|---|---|
Lib Dem Focus Team | John Tilley* | 1,389 | 41.63 | |
Lib Dem Focus Team | Barbara Janke* | 1,381 | ||
Lib Dem Focus Team | David J. Twigg | 1,279 | ||
Labour | Barry G. Bennett | 1,044 | 31.05 | |
Labour | Robert H. Markless | 1,021 | ||
Labour | Matthew F. Rees | 956 | ||
Conservative | Roy S.E. Beat | 619 | 18.53 | |
Conservative | Nicholas J.H. Wilson | 613 | ||
Conservative | Derrick B. Mastrocola | 571 | ||
Green | Susanna M. Hawkins | 285 | 8.79 | |
Registered electors | 5,104 | |||
Turnout | 3,207 | 62.83 | ||
Rejected ballots | 2 | 0.06 | ||
Lib Dem Focus Team hold | ||||
Party | Candidate | Votes | % | |
---|---|---|---|---|
Lib Dem Focus Team | Ian F. Osborne* | 1,460 | 64.42 | |
Lib Dem Focus Team | Brian M. Bennett* | 1,439 | ||
Conservative | Emmanuel J.G. Brooker | 478 | 20.30 | |
Conservative | Fiona H. Townley | 435 | ||
Labour | Geraldene E. Dawson | 365 | 15.28 | |
Labour | Matthew J, Foulsham | 323 | ||
Registered electors | 3,789 | |||
Turnout | 2,364 | 62.39 | ||
Rejected ballots | 2 | 0.08 | ||
Lib Dem Focus Team hold | ||||
Party | Candidate | Votes | % | |
---|---|---|---|---|
Lib Dem Focus Team | Susan Goodship | 1,463 | 38.73 | |
Lib Dem Focus Team | Jeffrey P. Hanna | 1,399 | ||
Lib Dem Focus Team | Mary Watts | 1,353 | ||
Conservative | Herbert M.V. Barker | 1,251 | 32.19 | |
Conservative | Colin A.T. Suckling | 1,131 | ||
Conservative | Paul J. Johnston | 1,123 | ||
Labour | Christopher J. Duggan | 1,117 | 29.08 | |
Labour | David Preece | 1,038 | ||
Labour | Adrian P. Haren | 1,010 | ||
Registered electors | 6,627 | |||
Turnout | 3,889 | 58.68 | ||
Rejected ballots | 6 | 0.15 | ||
Lib Dem Focus Team gain from Conservative | ||||
Party | Candidate | Votes | % | |
---|---|---|---|---|
Conservative | Kenneth R. Wootton* | 999 | 63.94 | |
Conservative | Marjorie Hartfree* | 986 | ||
Labour | Catherine E.L. Pestano | 295 | 18.67 | |
Liberal Democrats | John M. Wadleton | 295 | 17.39 | |
Labour | Trevor E. Webb | 284 | ||
Liberal Democrats | Iris R.J. Grender | 244 | ||
Registered electors | 3,023 | |||
Turnout | 1,658 | 54.85 | ||
Rejected ballots | 0 | 0.00 | ||
Conservative hold | ||||
Party | Candidate | Votes | % | |
---|---|---|---|---|
Lib Dem Focus Team | Christine S. Hitchcock | 1,523 | 47.15 | |
Lib Dem Focus Team | Christopher A. Nicholson* | 1,426 | ||
Lib Dem Focus Team | Katherine J. Stones | 1,348 | ||
Conservative | Francis P. McHugh | 824 | 26.90 | |
Conservative | Rupert StJ. Stephens | 821 | ||
Conservative | Terence W. Bowers | 806 | ||
Labour | David K.J. Cooper | 553 | 17.75 | |
Labour | Leo B. Brightley | 536 | ||
Labour | Shona C. Godkin | 529 | ||
Green | Michael J. Seviour | 249 | 8.20 | |
Registered electors | 5,483 | |||
Turnout | 3,006 | 54.82 | ||
Rejected ballots | 5 | 0.17 | ||
Lib Dem Focus Team hold | ||||
Party | Candidate | Votes | % | |
---|---|---|---|---|
Conservative | David M. Edwards | 1,059 | 54.95 | |
Conservative | Trevor F. Thorpe | 1,037 | ||
Labour | Julia A. Rees | 423 | 21.03 | |
Labour | Roger J. Price | 378 | ||
Lib Dem Focus Team | Ian M. Cridland | 276 | 14.00 | |
Lib Dem Focus Team | Alan R. Pemberton | 258 | ||
Green | Margaret Torr | 191 | 10.02 | |
Registered electors | 3,690 | |||
Turnout | 1,884 | 51.06 | ||
Rejected ballots | 3 | 0.16 | ||
Conservative hold | ||||
Party | Candidate | Votes | % | |
---|---|---|---|---|
Lib Dem Focus Team | David Campanale* | 1,235 | 53.86 | |
Lib Dem Focus Team | Ian A. Reid | 1,149 | ||
Conservative | Timothy D. Brown | 669 | 29.19 | |
Conservative | Edith L.E. Millidge | 622 | ||
Labour | David A. Denham | 306 | 13.33 | |
Labour | Sean T. McLoughlin | 283 | ||
Green | Laurence A. Thompson | 80 | 3.62 | |
Registered electors | 3,670 | |||
Turnout | 2,273 | 61.93 | ||
Rejected ballots | 2 | 0.09 | ||
Lib Dem Focus Team hold | ||||
Party | Candidate | Votes | % | |
---|---|---|---|---|
Conservative | Adrian J. Clare* | 1,120 | 60.67 | |
Conservative | John S. Godden | 1,052 | ||
Labour | Warren M. Kloman | 429 | 23.41 | |
Labour | Margaret J. Rainger | 408 | ||
Liberal Democrats | Christopher M. Bryan | 300 | 15.92 | |
Liberal Democrats | Jonathan P.K. Lawlor | 269 | ||
Registered electors | 3,736 | |||
Turnout | 1,971 | 52.76 | ||
Rejected ballots | 79 | 4.01 | ||
Conservative hold | ||||
Party | Candidate | Votes | % | |
---|---|---|---|---|
Labour | Steven Mama | 1,677 | 58.68 | |
Labour | George A. Forsyth | 1,587 | ||
Labour | Julie A. Reay | 1,575 | ||
Conservative | Anne C. Horsfield | 548 | 18.95 | |
Conservative | Audrey D. Parry | 517 | ||
Conservative | Mark S. Parry | 497 | ||
Liberal Democrats | Peter E.B. Harris | 364 | 11.89 | |
Liberal Democrats | Antonia M. Harrison Crook | 310 | ||
Liberal Democrats | Robert S. Griffiths | 306 | ||
Green | Jean Vidler | 288 | 10.48 | |
Registered electors | 5,294 | |||
Turnout | 2,869 | 54.19 | ||
Rejected ballots | 1 | 0.04 | ||
Labour hold | ||||
Labour gain from Lib Dem Focus Team | ||||
Labour hold | ||||
Party | Candidate | Votes | % | |
---|---|---|---|---|
Conservative | Jeffrey A. Reardon | 1,261 | 57.12 | |
Conservative | Frank Hartfree* | 1,225 | ||
Liberal Democrats | Susan E. Baxter | 506 | 22.61 | |
Liberal Democrats | Stephen J. Porter | 477 | ||
Labour | Gerald A. Jones | 466 | 20.27 | |
Labour | Sally Richardson | 415 | ||
Registered electors | 4,133 | |||
Turnout | 2,317 | 56.06 | ||
Rejected ballots | 2 | 0.09 | ||
Conservative hold | ||||
Party | Candidate | Votes | % | |
---|---|---|---|---|
Conservative | David Fraser* | 1,735 | 60.53 | |
Conservative | Peter S. Bridger | 1,675 | ||
Conservative | Gavin N. French* | 1,599 | ||
Labour | Susanne K. Burridge | 721 | 24.28 | |
Labour | David G. Rainger | 679 | ||
Labour | Brian A.W. Shemmings | 610 | ||
Liberal Democrats | Jennifer A. Catchpole | 429 | 15.19 | |
Liberal Democrats | Carol M. Orton | 418 | ||
Liberal Democrats | Olly M. Grender | 410 | ||
Registered electors | 5,153 | |||
Turnout | 2,938 | 57.02 | ||
Rejected ballots | 4 | 0.14 | ||
Conservative hold | ||||
Conservative gain from Lib Dem Focus Team | ||||
Conservative hold | ||||
Party | Candidate | Votes | % | |
---|---|---|---|---|
Conservative | Rupert O. Matthews | 1,287 | 44.60 | |
Conservative | David V. Smedley* | 1,282 | ||
Conservative | Dennis F. Doe* | 1,262 | ||
Labour | Sadie Cheston | 653 | 22.01 | |
Labour | Arthur G. Cheston | 625 | ||
Labour | Mark D.G. Heather | 612 | ||
Liberal Democrats | Anthony J. Abbott | 563 | 18.55 | |
Liberal Democrats | Leon Grabman | 523 | ||
Liberal Democrats | Robert M. Steed | 508 | ||
Green | Martin Lake | 425 | 14.84 | |
Registered electors | 5,708 | |||
Turnout | 2,785 | 48.79 | ||
Rejected ballots | 4 | 0.14 | ||
Conservative hold | ||||
Party | Candidate | Votes | % | |
---|---|---|---|---|
Conservative | Justin N. Bradford | 1,270 | 47.71 | |
Conservative | Jane O. Smith* | 1,257 | ||
Conservative | Quentin R. Edgington | 1,227 | ||
Labour | Brian A. Bonsey | 680 | 24.83 | |
Labour | Jeremy J. Thorn | 659 | ||
Labour | Neil Willoughby | 615 | ||
Liberal Democrats | Myra R.L. Abbott | 437 | 15.75 | |
Liberal Democrats | Judith A. Manwell | 409 | ||
Liberal Democrats | David M. Horwill | 393 | ||
Green | Brian J. Holmes | 307 | 11.71 | |
Registered electors | 5,756 | |||
Turnout | 2,637 | 45.81 | ||
Rejected ballots | 1 | 0.04 | ||
Conservative hold | ||||
Party | Candidate | Votes | % | |
---|---|---|---|---|
Conservative | Leslie G.P. Dale | 920 | 43.22 | |
Conservative | Christopher B. Hunt | 909 | ||
Liberal Democrats | Philip J. Carr | 907 | 42.84 | |
Liberal Democrats | Victoria C.M. Harris | 907 | ||
Labour | Lionel R. Hockley | 307 | 13.94 | |
Labour | Laurence G. Simmonds | 282 | ||
Registered electors | 3,888 | |||
Turnout | 2,228 | 57.30 | ||
Rejected ballots | 1 | 0.03 | ||
Conservative gain from Lib Dem Focus Team | ||||
Party | Candidate | Votes | % | |
---|---|---|---|---|
Labour | Toby Flux | 1,103 | 50.09 | |
Labour | Paul S. Wright | 1,024 | ||
Conservative | Patricia S. Gardham | 834 | 38.80 | |
Conservative | Michael J.F. Mannall* | 814 | ||
Lib Dem Focus Team | Christine J. Leach | 241 | 11.11 | |
Lib Dem Focus Team | John B. Walker | 231 | ||
Registered electors | 3,828 | |||
Turnout | 2,246 | 58.67 | ||
Rejected ballots | 4 | 0.18 | ||
Labour gain from Conservative | ||||
Party | Candidate | Votes | % | |
---|---|---|---|---|
Labour | Robin T. Hutchinson* | 1,177 | 54.82 | |
Labour | Loraine Monk | 1,106 | ||
Conservative | Philip E. Whiting | 728 | 33.37 | |
Conservative | Rosham Sadri | 662 | ||
Lib Dem Focus Team | Louise A. Bloom | 255 | 11.81 | |
Lib Dem Focus Team | Paul J. Jackson | 236 | ||
Registered electors | 3,903 | |||
Turnout | 2,203 | 56.44 | ||
Rejected ballots | 2 | 0.09 | ||
Labour hold | ||||
Labour hold | ||||
Party | Candidate | Votes | % | |
---|---|---|---|---|
Conservative | David H. Cunningham | 1,838 | 48.82 | |
Conservative | Andrew L. Lee | 1,803 | ||
Conservative | Lynne M.M. Dunn | 1,763 | ||
Lib Dem Focus Team | Charles N. Bloom* | 924 | 22.96 | |
Lib Dem Focus Team | Jane E. Ware | 838 | ||
Lib Dem Focus Team | Peter J.W. Grender | 778 | ||
Labour | Marion Richardson | 695 | 18.38 | |
Labour | Rosemary M. Wagner | 676 | ||
Labour | James R. Smy | 664 | ||
Green | Jane E. Taylor | 363 | 9.84 | |
Registered electors | 6,029 | |||
Turnout | 3,623 | 60.09 | ||
Rejected ballots | 3 | 0.08 | ||
Conservative gain from Lib Dem Focus Team | ||||
Kingston upon Thames London Borough Council is elected every four years.
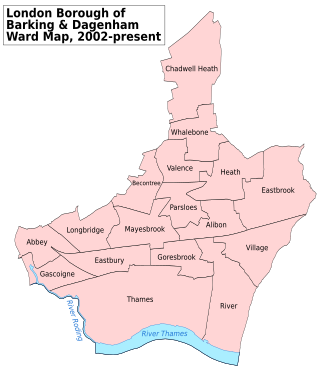
Barking and Dagenham London Borough Council in London, England is elected every four years. Since the last boundary changes in 2022 the council has comprised 51 councillors representing 19 wards, with each ward electing two or three councillors. Elections are held every four years.
Richmond upon Thames London Borough Council elections are held every four years for all 54 councillor seats in the 18 wards that make up the Borough Council. By-elections are held in individual wards when vacancies arise outside the four-year cycle.
Elections to Lambeth London Borough Council were held in May 1990. The whole council was up for election. Turnout was 42.3%.
Canbury was an electoral ward in the Royal Borough of Kingston upon Thames from 1965 to 2022. The ward was first used in the 1964 elections and last used for the 2018 elections. It returned three councillors to Kingston upon Thames London Borough Council.
The 1990 Brent Council election took place on 3 May 1990 to elect members of Brent London Borough Council in London, England. The whole council was up for election and the council went in no overall control.
The 1990 Bromley Council election took place on 3 May 1990 to elect members of Bromley London Borough Council in London, England. The whole council was up for election and the Conservative party stayed in overall control of the council.
The 1990 Greenwich Council election took place on 3 May 1990 to elect members of Greenwich London Borough Council in London, England. The whole council was up for election and the Labour party stayed in overall control of the council.
The 1990 Harrow Council election took place on 3 May 1990 to elect members of Harrow London Borough Council in London, England. The whole council was up for election and the Conservative party stayed in overall control of the council.
The 1990 Havering Council election took place on 3 May 1990 to elect members of Havering London Borough Council in London, England. The whole council was up for election and the council stayed in no overall control.
The 1990 Hillingdon Council election tooklace on 3 May 1990 to elect members of Hillingdon London Borough Council in London, Englaland. The whole council was up for election and the Conservative Party gained overall control of the council.
The 1990 Hounslow Council election took place on 3 May 1990 to elect members of Hounslow London Borough Council in London, England. The whole council was up for election and the Labour party stayed in overall control of the council.
The 1990 Kensington and Chelsea Council election took place on 3 May 1990 to elect members of Kensington and Chelsea London Borough Council in London, England. The whole council was up for election and the Conservative party stayed in overall control of the council.
The 1994 Kingston upon Thames Council election took place on 5 May 1994 to elect members of Kingston upon Thames London Borough Council in London, England. The whole council was up for election and the Liberal Democrats gained overall control of the council.
The 1990 Redbridge Council election took place on 3 May 1990 to elect members of Redbridge London Borough Council in London, England. The whole council was up for election and the Conservative party stayed in overall control of the council.
The 1990 Richmond upon Thames Borough Council election took place on 3 May 1990 to elect members of Richmond upon Thames London Borough Council in London, England. The whole council was up for election and the Liberal Democrats stayed in overall control of the council.
The 1994 Richmond upon Thames Council election took place on 5 May 1994 to elect members of Richmond upon Thames London Borough Council in London, England. The whole council was up for election and the Liberal Democrats stayed in overall control of the council.
The 1990 Waltham Forest Council election took place on 3 May 1990 to elect members of Waltham Forest London Borough Council in London, England. The whole council was up for election and the Labour party stayed in overall control of the council.
The 1990 Wandsworth Council election took place on 3 May 1990 to elect members of Wandsworth London Borough Council in London, England. The whole council was up for election and the Conservative Party stayed in overall control of the council.
The 1990 Westminster Council election took place on 3 May 1990 to elect members of Westminster City Council in London, England. The whole council was up for election and the Conservative Party stayed in overall control of the council.