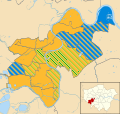
Richmond upon Thames London Borough Council elections are held every four years for all 54 councillor seats in the 18 wards that make up the Borough Council. [1] By-elections are held in individual wards when vacancies arise outside the four-year cycle.
The first election to the council was held in 1964, initially operating as a shadow authority before the new system came into full effect in 1965. Political control of the council since 1964 has been held by the following parties: [2]
Election | Overall control | Conservative | Lib Dem | Labour | Green | Ind. | |
---|---|---|---|---|---|---|---|
1964 | Conservative | 41 | – | 12 | – | 1 | |
1968 | Conservative | 54 | – | – | – | – | |
1971 | Conservative | 36 | 3 | 15 | – | – | |
1974 | Conservative | 36 | 10 | 8 | – | – | |
1978 | Conservative | 34 | 18 | – | – | – | |
1982 | No overall control | 26 | 26 | – | – | – | |
1986 | Alliance | 3 | 49 | – | – | – | |
1990 | Liberal Democrats | 4 | 48 | – | – | – | |
1994 | Liberal Democrats | 7 | 43 | 2 | – | – | |
1998 | Liberal Democrats | 14 | 34 | 4 | – | – | |
2002 | Conservative | 39 | 15 | – | – | – | |
2006 | Liberal Democrats | 18 | 35 | – | – | 1 | |
2010 | Conservative | 30 | 24 | – | – | – | |
2014 | Conservative | 39 | 15 | – | – | – | |
2018 | Liberal Democrats | 11 | 39 | – | 4 | – | |
2022 | Liberal Democrats | 1 | 48 | – | 5 | – |
There were no by-elections. [3]
Party | Candidate | Votes | % | ±% | |
---|---|---|---|---|---|
Conservative | P. J. Maitland | 1199 | |||
Independent | M. V. Smith | 618 | |||
Labour | A. G. H. Lawrance [n 5] | 151 | |||
Turnout | 31.7% |
Party | Candidate | Votes | % | ±% | |
---|---|---|---|---|---|
Conservative | J. K. Baker | 1160 | |||
Liberal | A. D. Reddrop | 615 | |||
Labour | Mrs J. M. Hyam | 262 | |||
Turnout | 24.2% |
Party | Candidate | Votes | % | ±% | |
---|---|---|---|---|---|
Conservative | Mrs H. M. Abell | 603 | |||
Liberal | Dr S. Rundle | 569 | |||
Independent | A. P. Warren | 248 | |||
Labour | A. B. Hart | 207 | |||
Turnout | 26.7% |
Party | Candidate | Votes | % | ±% | |
---|---|---|---|---|---|
Liberal | Dr S. Rundle | 1676 | |||
Conservative | Miss J. M. Hooper | 1079 | |||
Labour | Miss D. J. Kidger | 323 | |||
Turnout | 35.7% |
Party | Candidate | Votes | % | ±% | |
---|---|---|---|---|---|
Conservative | G. M. Cooper | 1766 | |||
Liberal | R. D. McArthur | 605 | |||
Labour | Miss J. R. F. Brown | 405 | |||
Turnout | 37.4% |
Party | Candidate | Votes | % | ±% | |
---|---|---|---|---|---|
Conservative | T. A. Bligh | 1266 | |||
Labour | P. T. Z. Goldring | 391 | |||
Liberal | Mrs D. O. Collins | 374 | |||
Turnout | 28.6% |
Party | Candidate | Votes | % | ±% | |
---|---|---|---|---|---|
Conservative | P. G. Lockyer | 1065 | |||
Labour | K. L. Elmes | 502 | |||
Liberal | J. E. Twaits | 361 | |||
Turnout | 25.3% |
Party | Candidate | Votes | % | ±% | |
---|---|---|---|---|---|
Conservative | J. M. Russell | 1190 | |||
Liberal | R. W. Marlow | 435 | |||
Labour | E. C. Eldridge | 424 | |||
Turnout | 28.9% |
Party | Candidate | Votes | % | ±% | |
---|---|---|---|---|---|
Conservative | T. J. Attwood | 1081 | |||
Labour | K. L. Elmes | 525 | |||
Liberal | J. E. Twaits | 377 | |||
Turnout | 24.5% |
Party | Candidate | Votes | % | ±% | |
---|---|---|---|---|---|
Labour | G. E. F. Samuels | 1,530 | |||
Conservative | P. G. Lockyer | 1,196 | |||
Liberal | J. E. Twaits | 160 | |||
Turnout | 35.5% |
Party | Candidate | Votes | % | ±% | |
---|---|---|---|---|---|
Labour | M. J. Powell | 1,232 | |||
Conservative | R. K. Morland | 1,087 | |||
Liberal | R. W. Marlow | 390 | |||
Turnout | 41.6% |
Party | Candidate | Votes | % | ±% | |
---|---|---|---|---|---|
Labour | Mrs J. M. Pardington | 1,109 | |||
Conservative | Miss M. C. Gregory | 1,012 | |||
Liberal | S. J. Nunn | 244 | |||
Ind. Conservative | Mrs A. Woodward | 185 | |||
Turnout | 37.3% |
Party | Candidate | Votes | % | ±% | |
---|---|---|---|---|---|
Liberal | J. Waller | 1,301 | |||
Conservative | J. L. Saunders | 937 | |||
Labour | R. G. Marshall-Andrews | 928 | |||
Turnout | 48.1 % |
Party | Candidate | Votes | % | ±% | |
---|---|---|---|---|---|
Liberal | Anthony L. Manners | 1,769 | |||
Conservative | Margery Segar | 1,253 | |||
Labour | John P. Sheppard | 519 | |||
Turnout | 51.5 |
Party | Candidate | Votes | % | ±% | |
---|---|---|---|---|---|
Liberal | Bryan T. B. Lewis | 1,651 | |||
Conservative | John L. Saunders | 1,100 | |||
Labour | Roy F. Piper | 421 | |||
Ratepayers | Joshua P. Kielty | 253 | |||
Turnout | 54.4 |
Party | Candidate | Votes | % | ±% | |
---|---|---|---|---|---|
Liberal | David C. Cornwell | 1,722 | |||
Conservative | Patrick V. Marshall | 1,718 | |||
Labour | Joy P. Mostyn | 577 | |||
Turnout | 56.3 |
Following the discovery of a series of voting errors, the High Court on 5 August 1976 declared the Liberal candidate in place of the Conservative. The revised votes are recorded here.
Party | Candidate | Votes | % | ±% | |
---|---|---|---|---|---|
Liberal | Marie C. Biddulph | 1,716 | |||
Labour | Roger D. Smith | 1,182 | |||
Conservative | Vera Goodman | 810 | |||
Turnout | 57.3 |
Party | Candidate | Votes | % | ±% | |
---|---|---|---|---|---|
Conservative | Peter J. Temlett | 1,637 | |||
Liberal | Sidney J. Marshall | 1,229 | |||
Labour | John W. Shelton | 558 | |||
National Front | Terence Denville-Faulkner | 57 | |||
Turnout | 50.8 |
Party | Candidate | Votes | % | ±% | |
---|---|---|---|---|---|
Liberal | Deirdre B. Martineau | 1,668 | |||
Conservative | Christopher Sandy | 826 | |||
Labour | Joy P. Mostyn | 734 | |||
Turnout | 57.6 |
Party | Candidate | Votes | % | ±% | |
---|---|---|---|---|---|
Liberal Democrats | John W. G. Coombs | 896 | 40.1 | ||
Conservative | Jennie E. Edwards | 786 | 35.2 | ||
Labour | Michael D. Gold | 457 | 20.5 | ||
Green | Rowland R. Morgan | 54 | 2.4 | ||
National Front | Jeremy Bedford-Turner | 40 | 1.8 | ||
Turnout | 43.1 | ||||
Liberal Democrats gain from Conservative | Swing |
The by-election was called following the resignation of Cllr. Anthony T. Johnson.
Party | Candidate | Votes | % | ±% | |
---|---|---|---|---|---|
Liberal Democrats | Robert D. Parslow | 1,430 | 46.4 | ||
Conservative | Anne Woodward | 1,236 | 40.1 | ||
Labour | Martin P. Cross | 413 | 13.4 | ||
Turnout | 48.2 | ||||
Liberal Democrats hold | Swing |
The by-election was called following the death of Cllr. Gavin Alexander.
Party | Candidate | Votes | % | ±% | |
---|---|---|---|---|---|
Liberal Democrats | Joanna Frith | 1,377 | |||
Conservative | Peter J. Temlett | 990 | |||
Labour | Christopher J. Boaler | 686 | |||
Turnout | |||||
Liberal Democrats hold | Swing |
The by-election was called following the resignation of Cllr. Elaine I. Pippard.
Party | Candidate | Votes | % | ±% | |
---|---|---|---|---|---|
Liberal Democrats | John W. Coombs | 972 | 36.0 | ||
Conservative | Mary A. Rae | 908 | 33.7 | ||
Labour | Graham R. Nixon | 818 | 30.3 | ||
Majority | 64 | 2.3 | |||
Turnout | 2,698 | 49.5 | |||
Liberal Democrats gain from Conservative | Swing |
The by-election was called following the resignation of Cllr. Philip A. Northey.
Party | Candidate | Votes | % | ±% | |
---|---|---|---|---|---|
Liberal Democrats | Eleanor M. Stanier | 908 | 42.9 | ||
Conservative | Malcolm K. McAlister | 615 | 29.0 | ||
Labour | Michelle Thew | 594 | 28.1 | ||
Majority | 293 | 13.9 | |||
Turnout | 2,120 | 35.2 | |||
Liberal Democrats hold | Swing |
The by-election was called following the resignation of Cllr. Susan E. Fenwick.
Party | Candidate | Votes | % | ±% | |
---|---|---|---|---|---|
Conservative | Geoffrey J. Samuel | 1,138 | 40.3 | −0.1 | |
Liberal Democrats | John R. Gossage | 1,096 | 38.8 | −3.0 | |
Labour | Stephen J. Cox | 591 | 20.9 | +3.1 | |
Majority | 42 | 1.5 | |||
Turnout | 2,825 | 42.1 | |||
Conservative gain from Liberal Democrats | Swing |
The by-election was called following the resignation of Cllr. David A. R. Martin.
Party | Candidate | Votes | % | ±% | |
---|---|---|---|---|---|
Conservative | Nicola Urquhart | 1,496 | 49.1 | +7.5 | |
Liberal Democrats | Julian D. Rudd | 1,215 | 39.9 | −6.3 | |
Labour | Maureen H. Metzger | 333 | 10.9 | −1.3 | |
Majority | 281 | 9.2 | |||
Turnout | 3,044 | 48.3 | |||
Conservative hold | Swing |
The by-election was called following the resignation of Cllr. Helen Blake.
Party | Candidate | Votes | % | ±% | |
---|---|---|---|---|---|
Liberal Democrats | Eleanor M. Stanier | 936 | 44.5 | +14.0 | |
Conservative | Jane M. West | 927 | 44.1 | +4.2 | |
Labour | Benjamin R. Rowland | 132 | 6.3 | −23.3 | |
Green | James R. Page | 109 | 5.2 | +5.2 | |
Majority | 9 | 0.4 | |||
Turnout | 2,104 | 30.3 | |||
Liberal Democrats gain from Conservative | Swing |
The by-election was called following the death of Cllr. John L. Saunders.
Party | Candidate | Votes | % | ±% | |
---|---|---|---|---|---|
Liberal Democrats | Jane A. Arneil | 1,722 | 54.7 | +11.3 | |
Conservative | Ewan G. Wallace | 1,235 | 39.3 | −5.8 | |
Green | Sylvia R. Levi | 104 | 3.3 | +3.3 | |
Labour | John Simon Fowler | 85 | 2.7 | −8.9 | |
Majority | 487 | 15.4 | |||
Turnout | 3,146 | 46.6 | |||
Liberal Democrats hold | Swing |
The by-election was called following the death of Cllr. Anthony J. Barnett.
Party | Candidate | Votes | % | ±% | |
---|---|---|---|---|---|
Liberal Democrats | Suzette B. Nicholson | 1,669 | 57.9 | +18.3 | |
Conservative | Stuart N. Leamy | 1,111 | 38.6 | −10.4 | |
Labour | Kanbar Hosseinbor | 101 | 3.5 | −8.0 | |
Majority | 558 | 19.3 | |||
Turnout | 2,881 | 42.0 | |||
Liberal Democrats gain from Conservative | Swing |
The by-election was called following the death of Cllr. Jean M. Matthews.
Party | Candidate | Votes | % | ±% | |
---|---|---|---|---|---|
Liberal Democrats | Celia J. Hodges | 1,384 | 51.9 | +14.9 | |
Conservative | Paul Hodgins | 1,043 | 39.1 | −4.7 | |
Labour | Barnaby J. L. Marder | 129 | 4.8 | −5.6 | |
Green | Sylvia Wills | 110 | 4.1 | +4.1 | |
Majority | 341 | 12.8 | |||
Turnout | 2,666 | 39.6 | |||
Liberal Democrats gain from Conservative | Swing |
The by-election was called following the resignation of Cllr. Marc L. Cranfield-Adams.
Party | Candidate | Votes | % | ±% | |
---|---|---|---|---|---|
Liberal Democrats | David S. F. Trigg | 2,111 | 45.8 | +5.3 | |
Conservative | Nicholas J. F. Lait | 1,513 | 32.8 | −9.4 | |
Labour | John Grant | 548 | 11.9 | −5.4 | |
Green | Henry B. L. Gower | 435 | 9.4 | +9.4 | |
Majority | 598 | 13.0 | |||
Turnout | 4,607 | ||||
Liberal Democrats gain from Conservative | Swing |
The by-election was called following the death of Cllr. Derek Beattie.
Party | Candidate | Votes | % | ±% | |
---|---|---|---|---|---|
Conservative | Rita G. S. Palmer | 1,643 | 56.2 | +3.8 | |
Liberal Democrats | Barbara Westmorland | 1,103 | 37.7 | −5.8 | |
Labour | Ann F. Neimer | 91 | 3.1 | −1.0 | |
Green | James R. Page | 87 | 3.0 | +3.0 | |
Majority | 540 | 18.5 | |||
Turnout | 2,924 | 41.2 | |||
Conservative hold | Swing |
The by-election was called following the resignation of Cllr. Benedict A. Stanberry.
Party | Candidate | Votes | % | ±% | |
---|---|---|---|---|---|
Conservative | Stephen Speak | 1,733 | 42.4 | ||
Liberal Democrats | Jane Dodds | 1,587 | 38.9 | ||
Labour | Brian Caton | 364 | 8.9 | ||
Green | James Page | 206 | 5.0 | ||
Independent | Marc Cranfield-Adams | 123 | 3.0 | ||
Turnout | 4,084 | 52.4 | |||
Conservative hold | Swing |
The by-election was called following the resignation of Cllr. Richard Montague.
Party | Candidate | Votes | % | ±% | |
---|---|---|---|---|---|
Liberal Democrats | Geraldine Locke | 1,189 | 43.0 | +25.0 | |
Conservative | Jon Hollis | 1,081 | 39.1 | −10.6 | |
Green | Anthony Breslin | 237 | 8.6 | −9.9 | |
Labour | Paul Tanto | 185 | 6.7 | −7.2 | |
UKIP | Sam Naz | 69 | 2.5 | N/A | |
Independent | Michael John Lloyd | 7 | 0.3 | N/A | |
Majority | 108 | 3.9 | |||
Turnout | 2,769 | 34.89 | |||
Liberal Democrats gain from Conservative | Swing |
The by-election was called following the resignation of Cllr. Tania Mathias, of the Conservative Party, following her election as the Member of Parliament for Twickenham.
Party | Candidate | Votes | % | ±% | |
---|---|---|---|---|---|
Liberal Democrats | Julia Cambridge | 1,809 | 55.9 | ||
Conservative | Helen Margaret Edward | 1,090 | 35.5 | ||
Women's Equality | Trixie Rawlinson | 90 | 2.8 | ||
Labour | Giles Oakley | 82 | 2.7 | ||
Turnout | 3,071 | 40.7 | |||
Liberal Democrats hold | Swing |
The by-election was called following the death of Cllr. Mona Adams. [21]
Party | Candidate | Votes | % | ±% | |
---|---|---|---|---|---|
Liberal Democrats | Petra Fleming | 2,447 | 52.4 | 11.5 | |
Conservative | Nina Watson | 1,232 | 26.4 | 0.9 | |
Green | Chas Warlow | 538 | 11.5 | 15.5 | |
Labour | Nick Dexter | 446 | 9.5 | 3.1 | |
Majority | 1,215 | 26.0 | N/A | ||
Turnout | 4,663 | 56.7 | 4.5 | ||
Liberal Democrats gain from Green | Swing | N/A |
The by-election was called following the resignation of Cllr. Dylan Baxendale. [22]
Party | Candidate | Votes | % | ±% | |
---|---|---|---|---|---|
Liberal Democrats | Carey Bishop | 1,177 | 53.2 | ||
Conservative | Nupur Majumdar | 771 | 34.8 | ||
Labour | Sam Cullen | 159 | 7.2 | ||
Green | Danielle Coleman | 106 | 4.8 | ||
Turnout | 2,213 | 30.9 | |||
Liberal Democrats gain from Conservative | Swing | N/A |
The by-election was called following the death of Cllr. Geoffrey Samuel.
Party | Candidate | Votes | % | ±% | |
---|---|---|---|---|---|
Liberal Democrats | Richard Baker | 1,716 | 64.3 | ||
Conservative | Elizabeth Foster | 561 | 21.0 | ||
Green | Chantal Kerr-Sheppard | 184 | 6.9 | ||
Labour | James Thomson | 163 | 6.1 | ||
Independent | Dominic Stockford | 46 | 1.7 | ||
Turnout | 2,670 | 33.8 | |||
Liberal Democrats hold | Swing | N/A |
The by-election was called following the death of Cllr. Martin Elengorn.
Kingston upon Thames London Borough Council is elected every four years.
Barking and Dagenham London Borough Council in London, England is elected every four years. Since the last boundary changes in 2022 the council has comprised 51 councillors representing 19 wards, with each ward electing two or three councillors. Elections are held every four years.
Elections for the Croydon London Borough Council are held every four years to elect 70 councillors. The last ward boundary changes came into force at the 2018 local elections.
Bexley London Borough Council is the local authority for the London Borough of Bexley in London, England. The council is elected every four years.
Bromley London Borough Council is the local authority for the London Borough of Bromley. The council is elected every four years.
Ealing Council is the local authority for the London Borough of Ealing. It is elected every four years.
Redbridge London Borough Council in London, England is elected every four years.
Harrow London Borough Council in London, England is elected every four years. Since the last boundary changes in 2022, 55 councillors are elected from 22 wards.
Hounslow Council in London, England is elected every four years. 60 councillors are elected from 20 wards, with by-elections held to fill any vacancies between elections.
Tower Hamlets London Borough Council, the local authority for the London Borough of Tower Hamlets, is elected every four years.
Southwark London Borough Council is the local authority for the London Borough of Southwark in London, England. The council is elected every four years. Since the last boundary changes in 2018, 63 councillors have been elected from 23 wards.
Elections for Hackney Council in London take place every four years.
Waltham Forest London Borough Council in London is elected every four years. Since the last boundary changes in 2022, 60 councillors have been elected from 22 wards, with 2 or 3 councillors per ward.
Sutton London Borough Council in London, England is elected every four years.
Haringey London Borough Council is the local authority for the London Borough of Haringey in London, England. The council is elected every four years.
The members of the Hillingdon London Borough Council in London, England are elected every four years. Since the 2022 boundary changes, the council is composed of 53 councillors.
Merton London Borough Council in London, England is elected every four years; it has administrative control over the London Borough of Merton.
Kensington and Chelsea London Borough Council in London, England, is elected every four years. Since the last boundary changes in 2014, 50 councillors have been elected from 18 wards.
Wandsworth London Borough Council, England, is elected every four years. From 2002 to 2018, 60 councillors were elected from 20 wards. Following ward boundary changes, in 2022 58 councillors were elected in 22 wards returning either 2 or 3 councillors each.
Newham London Borough Council is elected every four years.