| ||||||||||||||||||||||
All 63 seats to Bexley London Borough Council 32 seats needed for a majority | ||||||||||||||||||||||
---|---|---|---|---|---|---|---|---|---|---|---|---|---|---|---|---|---|---|---|---|---|---|
| ||||||||||||||||||||||
Map of the results of the 2006 Bexley council election. Conservatives in blue and Labour in red. | ||||||||||||||||||||||
|
The 2006 Bexley Council election took place on 4 May 2006 to elect members of Bexley London Borough Council in London, England. [1] [2] The whole council was up for election and the Conservative Party gained control of the council from the Labour Party.
Party | Seats | Gains | Losses | Net gain/loss | Seats % | Votes % | Votes | +/− | |
---|---|---|---|---|---|---|---|---|---|
Conservative | 54 | 23 | 0 | 24 | 85.7 | 50.0 | 37,564 | 8.4 | |
Labour | 9 | 0 | 23 | 23 | 14.3 | 24.7 | 18,539 | 8.3 | |
Liberal Democrats | 0 | 0 | 1 | 1 | 0.0 | 11.6 | 8,732 | 3.4 | |
Independent | 0 | 0 | 0 | 0.0 | 5.1 | 3,864 | 2.8 | ||
BNP | 0 | 0 | 0 | 0.0 | 3.8 | 2,869 | 1.8 | ||
UKIP | 0 | 0 | 0 | 0.0 | 2.7 | 2,027 | 2.7 | ||
Thamesmead Community Party | 0 | 0 | 0 | 0.0 | 0.8 | 628 | New | ||
Orange Squash | 0 | 0 | 0 | 0.0 | 0.8 | 583 | New | ||
English Democrat | 0 | 0 | 0 | 0.0 | 0.5 | 392 | New |
Party | Candidate | Votes | % | ±% | |
---|---|---|---|---|---|
Conservative | William McEwen | 2,333 | 58.4 | ||
Conservative | Richard Gillespie | 2,223 | |||
Conservative | Simon Windle | 2,188 | |||
Labour | Charan Gill | 735 | 18.4 | ||
Labour | John Husband | 685 | |||
Labour | Derek Steedman | 653 | |||
UKIP | Barrie Thomas | 513 | 12.9 | ||
Liberal Democrats | Maurice Morpurgo | 411 | 10.3 | ||
Turnout | 45.6 | ||||
Conservative hold | Swing | ||||
Party | Candidate | Votes | % | ±% | |
---|---|---|---|---|---|
Conservative | David Leaf | 1,287 | 43.0 | ||
Labour | Daniel Francis | 1,268 | 42.4 | ||
Conservative | John Fuller | 1,256 | |||
Labour | Janet White | 1,168 | |||
Conservative | Gooroodev Nangon | 1,050 | |||
Labour | John Pegg | 1,041 | |||
Liberal Democrats | Lesley Morpurgo | 439 | 14.7 | ||
Turnout | 35.9 | ||||
Conservative gain from Labour | Swing | ||||
Labour hold | Swing | ||||
Conservative gain from Labour | Swing | ||||
Party | Candidate | Votes | % | ±% | |
---|---|---|---|---|---|
Conservative | Brian Beckwith | 1,830 | 51.8 | ||
Conservative | Peter Craske | 1,804 | |||
Conservative | Katherine Perrior | 1,777 | |||
UKIP | Michael Barnbrook | 821 | 23.2 | ||
UKIP | John Dunford | 669 | |||
UKIP | George Wright | 664 | |||
Labour | Carole Borella | 494 | 14.0 | ||
Labour | Bernard Justham | 440 | |||
Labour | Josephine Chodha | 437 | |||
Liberal Democrats | Doreen La Roche | 391 | 11.1 | ||
Liberal Democrats | John La Roche | 363 | |||
Liberal Democrats | Peter Scopes | 355 | |||
Turnout | 44.3 | ||||
Conservative hold | Swing | ||||
Party | Candidate | Votes | % | ±% | |
---|---|---|---|---|---|
Conservative | Margaret Cammish | 2,445 | 73.3 | ||
Conservative | Graham D'Amiral | 2,364 | |||
Conservative | Nicholas O'Hare | 2,287 | |||
Liberal Democrats | Michael Jaques | 450 | 13.5 | ||
Labour | David Prior | 441 | 13.2 | ||
Liberal Democrats | Kaye Cudmore | 430 | |||
Liberal Democrats | John Cudmore | 415 | |||
Labour | Gerda Slater | 400 | |||
Labour | Stuart Slater | 387 | |||
Turnout | 42.1 | ||||
Conservative hold | Swing | ||||
Party | Candidate | Votes | % | ±% | |
---|---|---|---|---|---|
Conservative | Ronald French | 2,596 | 59.9 | ||
Conservative | Teresa O'Neill | 2,537 | |||
Conservative | John Wilkinson | 2,406 | |||
Labour | Joanne Browning | 802 | 18.5 | ||
Labour | Christopher Kirby | 734 | |||
Labour | John Perry | 710 | |||
Liberal Democrats | Barry Standen | 531 | 12.3 | ||
Liberal Democrats | Susan Hall | 515 | |||
Liberal Democrats | Peggy Wagstaff | 431 | |||
UKIP | William Jenner | 404 | 9.3 | ||
Turnout | 50.3 | ||||
Conservative hold | Swing | ||||
Party | Candidate | Votes | % | ±% | |
---|---|---|---|---|---|
Conservative | Roy Ashmole | 2,205 | 63.9 | ||
Conservative | Ian Clement | 2,188 | |||
Conservative | Leonard Newton | 2,098 | |||
Labour | Stephanie David | 733 | 21.2 | ||
Labour | Floyd Millen | 633 | |||
Labour | Peter West | 621 | |||
Liberal Democrats | Maureen Hall | 513 | 14.9 | ||
Liberal Democrats | David Hall | 501 | |||
Liberal Democrats | Betty Lockington | 443 | |||
Turnout | 42.2 | ||||
Conservative hold | Swing | ||||
Party | Candidate | Votes | % | ±% | |
---|---|---|---|---|---|
Conservative | Christopher Brockwell | 1,506 | 44.7 | ||
Conservative | David Cammish | 1,415 | |||
Conservative | David Hurt | 1,349 | |||
Labour | Ronald Browning | 1,175 | 34.9 | ||
Labour | Patricia Ball | 1,165 | |||
Labour | Peter Kilner | 1,163 | |||
Independent | Sally Briant | 397 | 11.8 | ||
Independent | Dianne Joyce | 387 | |||
Independent | Joanne Wilfort | 321 | |||
Liberal Democrats | Angela Thick | 293 | 8.7 | ||
Turnout | 40.5 | ||||
Conservative gain from Labour | Swing | ||||
Party | Candidate | Votes | % | ±% | |
---|---|---|---|---|---|
Conservative | Cheryl Bacon | 1,947 | 53.3 | ||
Conservative | Rosaline Downing | 1,903 | |||
Conservative | Donald Massey | 1,865 | |||
Labour | Helen Cash | 1,065 | 29.2 | ||
Labour | Stefano Borella | 1,019 | |||
Labour | Michael O'Neill | 995 | |||
Independent | Barry Parfett | 640 | 17.5 | ||
Independent | Elaine Cheeseman | 631 | |||
Independent | Laurence Williams | 611 | |||
Turnout | 46.4 | ||||
Conservative gain from Labour | Swing | ||||
Party | Candidate | Votes | % | ±% | |
---|---|---|---|---|---|
Conservative | Geraldene Lucia-Hennis | 1,378 | 36.5 | ||
Conservative | Howard Marriner | 1,345 | |||
Conservative | Melvin Seymour | 1,286 | |||
Labour | John Shepheard | 1,180 | 31.3 | ||
Labour | Tonya Kelsey | 1,147 | |||
Labour | Trevor Perrin | 1,058 | |||
BNP | Stephen James | 786 | 20.8 | ||
Liberal Democrats | Amanda Buckley | 430 | 11.4 | ||
Turnout | 42.3 | ||||
Conservative gain from Labour | Swing | ||||
Party | Candidate | Votes | % | ±% | |
---|---|---|---|---|---|
Conservative | Linda Bailey | 2,011 | 59.3 | ||
Conservative | Sharon Massey | 2,002 | |||
Conservative | John Waters | 1,985 | |||
Liberal Democrats | James McVeigh | 915 | 27.0 | ||
Liberal Democrats | Paul Hurren | 875 | |||
Liberal Democrats | Tejinder Singh Aulakh | 815 | |||
Labour | Alan Scutt | 466 | 13.7 | ||
Labour | Linda Husband | 453 | |||
Labour | Peter Hollamby | 453 | |||
Turnout | 44.1 | ||||
Conservative hold | Swing | ||||
Party | Candidate | Votes | % | ±% | |
---|---|---|---|---|---|
Conservative | Alfred Catterall | 1,362 | 32.0 | ||
Conservative | Michael Tarrant | 1,340 | |||
Conservative | James Hunt | 1,234 | |||
Labour | John Lawrenson | 937 | 22.0 | ||
Labour | Richard Everitt | 860 | |||
Labour | Sylvia Malt | 833 | |||
Liberal Democrats | Anthony Pickett | 681 | 16.0 | ||
Liberal Democrats | David Sexton | 604 | |||
BNP | Sheila Clark | 601 | 14.1 | ||
Liberal Democrats | Surinder Singh Manak | 564 | |||
English Democrat | John-Anthony Fitzpatrick | 392 | 9.2 | ||
UKIP | Malcolm Clarke | 289 | 6.8 | ||
UKIP | Pamela Perrin | 211 | |||
UKIP | Christopher Marshall | 209 | |||
Turnout | 45.3 | ||||
Conservative gain from Liberal Democrats | Swing | ||||
Conservative gain from Labour | Swing | ||||
Party | Candidate | Votes | % | ±% | |
---|---|---|---|---|---|
Labour | Christopher Ball | 1,066 | 36.0 | ||
Labour | Margaret O'Neill | 939 | |||
Conservative | Bernard Clewes | 884 | 29.9 | ||
Conservative | James Douglas | 850 | |||
Labour | Munir Malik | 833 | |||
Conservative | Priti Patel | 653 | |||
Independent | Stephen West | 574 | 19.4 | ||
Independent | Rita Grootendorst | 506 | |||
Liberal Democrats | Florence Jamieson | 434 | 14.7 | ||
Turnout | 32.2 | ||||
Labour hold | Swing | ||||
Conservative gain from Labour | Swing | ||||
Party | Candidate | Votes | % | ±% | |
---|---|---|---|---|---|
Conservative | Nigel Betts | 2,074 | 48.1 | ||
Conservative | Peter Catterall | 1,854 | |||
Conservative | Valerie Clark | 1,721 | |||
BNP | James Seadon | 1,001 | 23.2 | ||
Labour | Stephen Perfect | 640 | 14.9 | ||
Liberal Democrats | Andrew O'Gorman | 593 | 13.8 | ||
Liberal Democrats | Edward Shrimpton | 588 | |||
Labour | Mavis Persaud | 540 | |||
Liberal Democrats | Gurdeepak Singh Chaggar | 540 | |||
Labour | Carol Pieri | 517 | |||
Turnout | 48.2 | ||||
Conservative hold | Swing | ||||
Party | Candidate | Votes | % | ±% | |
---|---|---|---|---|---|
Conservative | John Davey | 1,860 | 42.5 | ||
Conservative | Margaret Hurt | 1,710 | |||
Conservative | Kirsty Duncombe | 1,707 | |||
Labour | Ronald Brown | 1,450 | 33.1 | ||
Labour | Samuel Blake | 1,422 | |||
Labour | Corinna Huxley | 1,253 | |||
Orange Squash | Gary Cripps | 583 | 13.3 | ||
Liberal Democrats | Peter Hofford | 482 | 11.0 | ||
Turnout | 45.3 | ||||
Conservative gain from Labour | Swing | ||||
Party | Candidate | Votes | % | ±% | |
---|---|---|---|---|---|
Conservative | Gareth Bacon | 1,966 | 55.0 | ||
Conservative | Kenneth McAndrew | 1,956 | |||
Conservative | Michael Slaughter | 1,921 | |||
Independent | Michael Lowe | 633 | 17.7 | ||
Labour | Clifford Judge | 517 | 14.5 | ||
Liberal Democrats | Zoe Brooks | 456 | 12.8 | ||
Liberal Democrats | Margaret Shrimpton | 449 | |||
Labour | Garth Pilling-Lindsell | 446 | |||
Labour | Philip Scrivener | 434 | |||
Liberal Democrats | John Brooks | 431 | |||
Turnout | 43.3 | ||||
Conservative hold | Swing | ||||
Party | Candidate | Votes | % | ±% | |
---|---|---|---|---|---|
Labour | John Eastaugh | 1,093 | 36.0 | ||
Labour | Brenda Langstead | 1,070 | |||
Labour | Alan Deadman | 962 | |||
Conservative | Sylvia Cassells | 637 | 21.0 | ||
Conservative | Bernard Gillespie | 601 | |||
Independent | Simon Goding | 553 | 18.2 | ||
Conservative | Edgar Silvester | 498 | |||
BNP | John Bowles | 481 | 15.9 | ||
Liberal Democrats | William Shrimpton | 269 | 8.9 | ||
Turnout | 31.9 | ||||
Labour hold | Swing | ||||
Party | Candidate | Votes | % | ±% | |
---|---|---|---|---|---|
Conservative | Helen Fuller | 1,975 | 52.7 | ||
Conservative | Peter Reader | 1,913 | |||
Conservative | Alex Sawyer | 1,806 | |||
Labour | Geoffrey Hacker | 1,280 | 34.1 | ||
Labour | Kathryn Smith | 1,236 | |||
Labour | Edward Akuamoah-Boateng | 1,202 | |||
Liberal Democrats | Paul Bargery | 496 | 13.2 | ||
Turnout | 46.6 | ||||
Conservative gain from Labour | Swing | ||||
Party | Candidate | Votes | % | ±% | |
---|---|---|---|---|---|
Conservative | Colin Campbell | 2,596 | 72.5 | ||
Conservative | Alan Downing | 2,546 | |||
Conservative | Colin Tandy | 2,472 | |||
Labour | Joseph Riches | 493 | 13.8 | ||
Liberal Democrats | Angela Nurse | 491 | 13.7 | ||
Labour | Broderick Bassett | 487 | |||
Labour | Teresa Pearce | 481 | |||
Liberal Democrats | David Nicolle | 454 | |||
Liberal Democrats | Shule Basaran | 413 | |||
Turnout | 45.4 | ||||
Conservative hold | Swing | ||||
Party | Candidate | Votes | % | ±% | |
---|---|---|---|---|---|
Conservative | Joseph Pollard | 2,062 | 57.0 | ||
Conservative | Raymond Sams | 1,907 | |||
Conservative | Matthew Scott | 1,890 | |||
Labour | Wendy Perfect | 1,101 | 30.4 | ||
Labour | Grant Blowers | 1,090 | |||
Labour | Matthew Murphy | 1,023 | |||
Liberal Democrats | Janette Codd | 457 | 12.6 | ||
Liberal Democrats | Colin Wright | 450 | |||
Liberal Democrats | Philip Codd | 413 | |||
Turnout | 46.5 | ||||
Conservative gain from Labour | Swing | ||||
Party | Candidate | Votes | % | ±% | |
---|---|---|---|---|---|
Conservative | Aileen Beckwith | 2,127 | 57.1 | ||
Conservative | Jacqueline Evans | 2,099 | |||
Conservative | June Slaughter | 2,090 | |||
Independent | Graham Holland | 1,067 | 28.6 | ||
Independent | Robert Griffiths | 966 | |||
Independent | David Gorton | 850 | |||
Labour | Colin Dawes | 532 | 14.3 | ||
Labour | Robert Bedwell | 523 | |||
Labour | Doreen Ives | 470 | |||
Turnout | 44.7 | ||||
Conservative hold | Swing | ||||
Party | Candidate | Votes | % | ±% | |
---|---|---|---|---|---|
Labour | Sandra Bauer | 1,071 | 49.1 | ||
Labour | Harbans Singh Buttar | 983 | |||
Labour | Harry Persaud | 956 | |||
Thamesmead Community Party | Jenny Bellinger | 628 | 28.8 | ||
Thamesmead Community Party | Jeremy Cotton | 573 | |||
Thamesmead Community Party | Anthony Cusack | 544 | |||
Conservative | Irene Reader | 483 | 22.1 | ||
Conservative | Irma Nangon | 438 | |||
Conservative | Philip Read | 228 | |||
Turnout | 26.2 | ||||
Labour hold | Swing | ||||
The London Borough of Bexley is a London borough in south-east London, forming part of Outer London. It has a population of 248,287. The main settlements are Sidcup, Erith, Bexleyheath, Crayford, Welling and Old Bexley. The London Borough of Bexley is within the Thames Gateway, an area designated as a national priority for urban regeneration. The local authority is Bexley London Borough Council.
Old Bexley and Sidcup is a constituency created in 1983 and represented in the House of Commons of the UK Parliament represented since 2021 by Louie French of the Conservative Party.
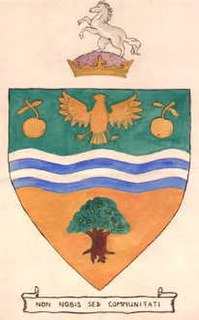
Bexley was a local government district in north west Kent from 1879 to 1965 around the town of Old Bexley.
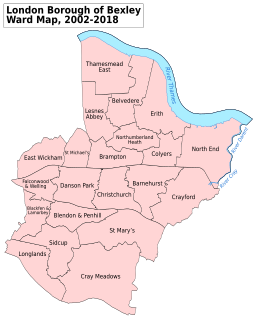
Bexley London Borough Council is the local authority for the London Borough of Bexley in London, England. The council is elected every four years.
Local government elections took place in London, and some other parts of the United Kingdom on Thursday 4 May 2006. Polling stations were open between 7am and 10pm.
Gareth Andrew Bacon is a British Conservative Party politician who has served as the Member of Parliament (MP) for Orpington since 2019. He was a member of the London Assembly, but stood down at the 2021 election after his election as an MP in 2019.
This article lists the British National Party's election results in the UK parliamentary, Scottish parliamentary and Welsh Assembly elections, as well as in the European Parliament elections and at a local level.
Local government elections were held in the thirty-two London boroughs on Thursday 9 May 1968. Polling stations were open between 8am and 9pm.
Local government elections took place in London, and some other parts of the United Kingdom on Thursday 6 May 2010. Polling stations were open between 7am and 10pm.
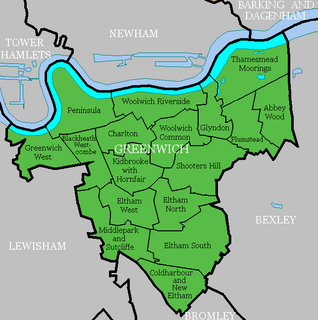
The politics of the Royal Borough of Greenwich.
Bexley London Borough Council is the local authority for the London Borough of Bexley in the ceremonial county of Greater London, England. It is one of 32 London borough councils in the county. The council comprises 45 councillors.
Greenwich London Borough Council is the local authority for the Royal Borough of Greenwich in London, England. The council is elected every four years. Since the last boundary changes in 2022, 55 councillors have been elected from 23 wards.
Wandsworth London Borough Council, England, is elected every four years. From 2002 to 2018, 60 councillors were elected from 20 wards. Following ward boundary changes, in 2022 58 councillors were elected in 22 wards returning either 2 or 3 councillors each.
Local government elections took place in London, and some other parts of the United Kingdom on Thursday 2 May 2002. Ward changes took place in every borough, following a series of reviews and 32 statutory instruments which reduced the total number of councillors by 56 from 1,917 to 1,861.
The 1964 Bexley Council election took place on 7 May 1964 to elect members of Bexley London Borough Council in London, England. The whole council was up for election and the Labour party gained control of the council.
The London Conservatives are the regional party of the Conservative Party that operates in Greater London.
The 2018 London local elections took place in London on 3 May 2018 as part of wider local elections in England. All London borough councillor seats were up for election. Elections to the Corporation of London were held in 2017. Mayoral contests were also held in Hackney, Lewisham, Newham and Tower Hamlets. The previous London borough elections were in 2014.
The 2018 Bexley Council election took place on 3 May 2018 to elect members of Bexley Council in England. This was on the same day as other local elections.
The 2022 Bexley London Borough Council election took place on 5 May 2022. 45 members of Bexley London Borough Council were elected. The elections took place alongside local elections in the other London boroughs and elections to local authorities across the United Kingdom.
Louie Thomas French is a British politician who has served as the Member of Parliament (MP) for Old Bexley and Sidcup since the 2021 by-election. A member of the Conservative Party, he was a councillor on Bexley London Borough Council from 2014 until 2022. Prior to this parliamentary career, he worked for as a lead portfolio manager for the financial planning and investment firm Tilney.