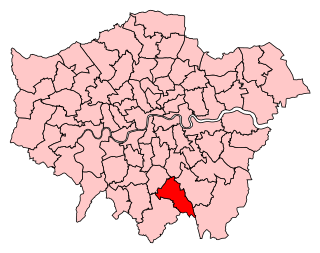
| |||||||||||||||||||||||||||||||||||||||||
All 70 seats, in 27 wards in the London Borough of Croydon 36 seats needed for a majority | |||||||||||||||||||||||||||||||||||||||||
---|---|---|---|---|---|---|---|---|---|---|---|---|---|---|---|---|---|---|---|---|---|---|---|---|---|---|---|---|---|---|---|---|---|---|---|---|---|---|---|---|---|
Turnout | 41.6% | ||||||||||||||||||||||||||||||||||||||||
| |||||||||||||||||||||||||||||||||||||||||
Map of the results of the 1978 Croydon Council election. | |||||||||||||||||||||||||||||||||||||||||
|
The 1978 Croydon Council election took place on 4 May 1978 to elect members of Croydon London Borough Council in London, England. The whole council was up for election and the Conservative party stayed in overall control of the council. [1]
This was the first election to Croydon Council since 1974. This was the first election fought on new boundaries, and the first without Aldermen, increasing the total number of Councillors from 60 to 70.
Party | Seats | Gains | Losses | Net gain/loss | Seats % | Votes % | Votes | +/− | |
---|---|---|---|---|---|---|---|---|---|
Conservative | 56 | 9 | 0 | 9 | 80 | 59.8 | 7.0% | ||
Labour | 11 | 0 | 9 | 9 | 15.71 | 29.4 | 0.8% | ||
Liberal | 0 | 0 | 0 | 0 | 0 | 6.6 | 7.7% | ||
Other parties | 3 | 0 | 0 | 0 | 4.29 | 4.1 | 1.7% |
56 | 3 | 11 |
Con | Others | Labour |
Party | Candidate | Votes | % | ±% | |
---|---|---|---|---|---|
Conservative | Muriel C. Elliott | 2,461 | |||
Conservative | Dennis F. Todd | 2,426 | |||
Conservative | Megan Holt-Thomas | 2,393 | |||
Labour | James L. Walker, J.P. | 2,041 | |||
Labour | Robert J. Irwin | 2,038 | |||
Labour | Michael Cohen | 2,021 | |||
Liberal | Martin D. Patrick | 271 | |||
Liberal | Peter D. Rees | 270 | |||
Liberal | Brenda A. Piesing | 246 | |||
Majority | 352 | ||||
Turnout | 48.5 | 2.5% | |||
Registered electors | 10,744 | ||||
Conservative gain from Labour | Swing | ||||
Party | Candidate | Votes | % | ±% | |
---|---|---|---|---|---|
Conservative | William H. Simpson | 2,038 | |||
Conservative | Donald J. Sutton | 1,851 | |||
Labour | Frank D. J. Bailey | 805 | |||
Labour | Dennis W. Finch | 770 | |||
Liberal | Leslie A. Christie | 230 | |||
Liberal | Barry Foster | 206 | |||
Majority | 1,046 | ||||
Turnout | 45.1 | ||||
Registered electors | 6,972 | ||||
Conservative win (new seat) | |||||
Conservative win (new seat) |
Party | Candidate | Votes | % | ±% | |
---|---|---|---|---|---|
Conservative | Arthur Bourne | 2,137 | |||
Conservative | Ronald J. Bowker | 2,111 | |||
Conservative | Christopher B. Wesson | 1,950 | |||
Labour | Ralph W. Attoe | 1,940 | |||
Labour | Amrit P. Devesar | 1,879 | |||
Labour | Joseph K. Towns | 1,852 | |||
Liberal | Michael J. Walker | 316 | |||
Liberal | Peter J. McCarthy | 309 | |||
Liberal | Sarah V. Walker | 281 | |||
Majority | 10 | ||||
Turnout | 43.3 | 5.1% | |||
Registered electors | 10,988 | ||||
Conservative hold | Swing | ||||
Party | Candidate | Votes | % | ±% | |
---|---|---|---|---|---|
Conservative | Philomena M. Drummond-Brown | 1,993 | |||
Conservative | Klemens E. Zdanowicz | 1,849 | |||
Labour | Doris L. George | 652 | |||
Labour | William H. R. Johnson | 596 | |||
Liberal | Brigid M. Hurn | 171 | |||
Liberal | Peter W. Austin | ||||
Majority | 1,197 | ||||
Turnout | 42.1 | ||||
Registered electors | 6,988 | ||||
Conservative win (new seat) | |||||
Conservative win (new seat) |
Party | Candidate | Votes | % | ±% | |
---|---|---|---|---|---|
Labour | James A. Keeling | 1,708 | |||
Labour | Ann Watson, J.P. | 1,700 | |||
Labour | Michael Warne | 1,694 | |||
Conservative | Christopher N. P. Lewis | 1,316 | |||
Conservative | Rosemary P. Tomlin | 1,304 | |||
Conservative | Joseph P. Szadlo | 1,177 | |||
Liberal | Joan H. Leck | 305 | |||
Liberal | Roger W. Stephens | 279 | |||
Liberal | Gwendoline M. Luxford | 274 | |||
Majority | 378 | ||||
Turnout | 37.9 | 3.1% | |||
Registered electors | 9,624 | ||||
Labour hold | Swing | ||||
Party | Candidate | Votes | % | ±% | |
---|---|---|---|---|---|
Conservative | Stanley E. Littlechild | 2,613 | |||
Conservative | Pamela A. M. Little | 2,563 | |||
Conservative | Martin A. Levie | 2,451 | |||
Liberal | Jean R. Douglas | 556 | |||
Liberal | John M. Payne | 554 | |||
Liberal | Raymond G. Abdey | 503 | |||
Labour | Jean Barlow | 434 | |||
Labour | John M. Dunning | 421 | |||
Labour | Leslie E. Deane | 419 | |||
Majority | 1,895 | ||||
Turnout | |||||
Registered electors | |||||
Conservative hold | Swing | ||||
Party | Candidate | Votes | % | ±% | |
---|---|---|---|---|---|
Conservative | Paul W. Rickards | 2,989 | |||
Conservative | Keith A. Wells | 2,922 | |||
Conservative | William N. Peet | 2,907 | |||
Labour | Wendy M. Holt | 698 | |||
Labour | Mary Jones | 673 | |||
Labour | Raymond G. M. Jones | 664 | |||
Liberal | Judith A. Stuart | 386 | |||
Liberal | Alan J. Hussey | 355 | |||
Liberal | John Hatherley | 349 | |||
Turnout | 41.1 | ||||
Registered electors | 10,217 | ||||
Conservative win (new seat) | |||||
Conservative win (new seat) |
Party | Candidate | Votes | % | ±% | |
---|---|---|---|---|---|
Conservative | Robert W. Coatman, J.P. | 3,445 | |||
Conservative | John L. Aston, J.P. | 3,436 | |||
Conservative | Peter R. Gilham | 3,320 | |||
Labour | Mary E. Curson | 925 | |||
Labour | Iain K. Forbes | 864 | |||
Labour | Steven Worley | 831 | |||
Liberal | John F. Chandler | 334 | |||
Liberal | Margaret Slade | 322 | |||
Liberal | Kathleen J. Walker | 288 | |||
Majority | 2,395 | ||||
Turnout | |||||
Registered electors | |||||
Conservative win (new seat) | |||||
Conservative win (new seat) |
Party | Candidate | Votes | % | ±% | |
---|---|---|---|---|---|
Labour Co-op | David F. White | 1,279 | |||
Labour Co-op | Mary M. Walker | 1,264 | |||
Conservative | Roy T. Miller | 581 | |||
Conservative | Richard E. Gayler | 558 | |||
Majority | 683 | ||||
Turnout | |||||
Registered electors | |||||
Labour Co-op win (new seat) | |||||
Labour Co-op win (new seat) |
Party | Candidate | Votes | % | ±% | |
---|---|---|---|---|---|
Conservative | Richard F. Pannett | 3,017 | |||
Conservative | John Parfitt | 2,958 | |||
Conservative | Mary M. H. Horden | 2,946 | |||
Labour | David L. Meen | 633 | |||
Labour | Bernard E. A. Evans | 618 | |||
Labour | Andrew M. S. Ward | 583 | |||
Liberal | Robert J. Williams | 262 | |||
Liberal | John W. Hardy | 244 | |||
Liberal | David A. Leck | 225 | |||
Majority | 2,313 | ||||
Turnout | |||||
Registered electors | |||||
Conservative win (new seat) | |||||
Conservative win (new seat) |
Party | Candidate | Votes | % | ±% | |
---|---|---|---|---|---|
Conservative | Margaret E. Campbell | 1,905 | |||
Conservative | Brian G. Smith | 1,806 | |||
Labour | Stephen E. Smart | 355 | |||
Labour | Colin F. Whelton | 314 | |||
Liberal | Richard L. Dawson | 249 | |||
Liberal | Norman McLeod | 244 | |||
Independent | Kenneth P. Dulieu | 201 | |||
Majority | 1,451 | ||||
Turnout | |||||
Registered electors | |||||
Conservative win (new seat) | |||||
Conservative win (new seat) |
Party | Candidate | Votes | % | ±% | |
---|---|---|---|---|---|
Conservative | Albert W. Elliott | 1,951 | |||
Conservative | Derek R. Loughborough | 1,929 | |||
Independent | Kenneth R. Brown | 1,293 | |||
Independent | Hugh W. Allardyce | 1,269 | |||
Labour | John C. Barlow | 406 | |||
Labour | Edna Briscoe | 366 | |||
Majority | 636 | ||||
Turnout | |||||
Registered electors | |||||
Conservative win (new seat) | |||||
Conservative win (new seat) |
Party | Candidate | Votes | % | ±% | |
---|---|---|---|---|---|
Labour | Reginald J. Page, J.P. | 1,880 | |||
Labour | Trevor J. Laffin | 1,719 | |||
Labour | Peter J. Walker | 1,686 | |||
Conservative | Alfred J. Doherty | 890 | |||
Conservative | Norah W. Beck | 841 | |||
Conservative | Adrian A. Bray | 836 | |||
National Front | Peter T. Robinson | 194 | |||
National Front | Brian A. Eve | 173 | |||
National Front | Roland Dummer | 154 | |||
Liberal | Frances M. Williams | 137 | |||
Majority | 796 | ||||
Turnout | |||||
Registered electors | |||||
Labour win (new boundaries) | |||||
Labour win (new boundaries) |
Party | Candidate | Votes | % | ±% | |
---|---|---|---|---|---|
Conservative | Colin Johnston | 2,281 | |||
Conservative | Keith M. B. Munro | 2,256 | |||
Conservative | Michael D. O'Mahony | 2,223 | |||
Labour | Christopher C. Gibbons | 925 | |||
Labour | Shantilal L. H. Shah | 854 | |||
Labour Co-op | Maureen E. Tullett | 837 | |||
Liberal | Leo C. E. Held | 247 | |||
Liberal | Michael J. Walker | 223 | |||
Liberal | Josephine M. Croton | 222 | |||
Majority | 1,298 | ||||
Turnout | |||||
Registered electors | |||||
Conservative hold | Swing | ||||
Party | Candidate | Votes | % | ±% | |
---|---|---|---|---|---|
Conservative | Peter J. F. Macdonald | 3,207 | |||
Conservative | Jacqueline M. C. Baker | 3,181 | |||
Conservative | George A. Smith | 3,154 | |||
Labour | Kevin W. Allen | 614 | |||
Labour | Timothy E. Lamport | 603 | |||
Labour | Ursula Alexis | 585 | |||
Majority | 2,540 | ||||
Turnout | |||||
Registered electors | |||||
Conservative win (new boundaries) | |||||
Conservative win (new boundaries) |
Party | Candidate | Votes | % | ±% | |
---|---|---|---|---|---|
Conservative | John C. Mann | 1,343 | |||
Conservative | Richard M. Wevill | 1,222 | |||
Labour | Stephen J. Bill | 1,140 | |||
Labour | Patricia F. L. Knight | 1,092 | |||
Liberal | Michael Bethell | 133 | |||
Liberal | Maurice E. Pache | 118 | |||
Majority | 82 | ||||
Turnout | |||||
Registered electors | |||||
Conservative win (new seat) | |||||
Conservative win (new seat) |
Party | Candidate | Votes | % | ±% | |
---|---|---|---|---|---|
Conservative | David N. Bowen | 2,823 | |||
Conservative | Ronald W. Haskins | 2,819 | |||
Liberal | Trevor J. Barker | 352 | |||
Liberal | June C. Duffelen | 352 | |||
Labour | Edward L. Hall | 300 | |||
Labour | Eileen E. Daisley, J.P. | 298 | |||
Majority | 2,467 | ||||
Turnout | |||||
Registered electors | |||||
Conservative win (new seat) | |||||
Conservative win (new seat) |
Party | Candidate | Votes | % | ±% | |
---|---|---|---|---|---|
Conservative | Donald J. Johnson | 2,269 | |||
Conservative | Ian L. Aarons | 2,243 | |||
Liberal | Christina M. Forrest | 562 | |||
Liberal | Michael J. Thomas | 550 | |||
Labour | David G. Taylor | 295 | |||
Labour | John A. E. Beamish-Crooke | 286 | |||
Majority | 1,681 | ||||
Turnout | |||||
Registered electors | |||||
Conservative win (new seat) | |||||
Conservative win (new seat) |
Party | Candidate | Votes | % | ±% | |
---|---|---|---|---|---|
Conservative | Beryl Saunders | 1,899 | |||
Conservative | Paul A. Saunders | 1,889 | |||
Conservative | Eileen J. Longhorn | 1,838 | |||
Labour | Patrick Byrne | 1,038 | |||
Labour | Valerie L. Simanowitz | 998 | |||
Labour | Alun W. Jones | 978 | |||
Liberal | John R. Holoway | 242 | |||
Liberal | Yvonne L. Cattermole | 205 | |||
Liberal | Alan Taylor | 193 | |||
Majority | 800 | ||||
Turnout | |||||
Registered electors | |||||
Conservative hold | Swing | ||||
Party | Candidate | Votes | % | ±% | |
---|---|---|---|---|---|
Conservative | Peter S. Bowness | 3,189 | |||
Conservative | Denis E. Perry | 3,167 | |||
Labour | Alan C. Lord | 661 | |||
Labour | Frederick W. Bean | 644 | |||
Liberal | Roy A. Lightwing | 354 | |||
Liberal | Patricia M. Boreham | 294 | |||
Majority | 2,506 | ||||
Turnout | |||||
Registered electors | |||||
Conservative win (new seat) | |||||
Conservative win (new seat) |
Party | Candidate | Votes | % | ±% | |
---|---|---|---|---|---|
Residents | John G. Davies | 2,283 | |||
Residents | William Blackwood | 2,265 | |||
Residents | Gordon Poluck | 2,198 | |||
Labour | Kenneth J. Kinnard | 1,296 | |||
Labour | Susan E. Lord | 1,243 | |||
Labour | Mushtaq Ahmad | 1,145 | |||
Majority | 902 | ||||
Turnout | |||||
Registered electors | |||||
Residents hold | Swing | ||||
Party | Candidate | Votes | % | ±% | |
---|---|---|---|---|---|
Conservative | Margaret C. V. Parfitt, J.P. | 1,695 | |||
Conservative | Phyllis A. Stelling | 1,617 | |||
Labour | Keith M. Roberts | 832 | |||
Labour | Susan E. Johnson | 809 | |||
Liberal | Leo C. E. Held, J.P. | 226 | |||
Majority | 785 | ||||
Turnout | |||||
Registered electors | |||||
Conservative win (new boundaries) | |||||
Conservative win (new boundaries) |
Party | Candidate | Votes | % | ±% | |
---|---|---|---|---|---|
Conservative | James J. Nea | 2,639 | |||
Conservative | Michael D. Wunn | 2,459 | |||
Conservative | Reginald H. Kent | 2,419 | |||
Labour | Alan Brett | 1,682 | |||
Labour | Barry V. Bulled | 1,655 | |||
Labour | Christopher Wright | 1,512 | |||
Liberal | J. Scott | 242 | |||
Workers Revolutionary | J.E. Bean | 82 | |||
Majority | 453 | ||||
Turnout | |||||
Registered electors | |||||
Conservative gain from Labour | Swing | ||||
Conservative hold | Swing | ||||
Conservative gain from Labour | Swing | ||||
Party | Candidate | Votes | % | ±% | |
---|---|---|---|---|---|
Conservative | Yvonne A. L. Stewart | 2,017 | |||
Conservative | Ernest G. Noad | 1,923 | |||
Conservative | Iris S. Rodda | 1,878 | |||
Labour | Stanley J. Boden | 1,788 | |||
Labour | Michael P. Rix | 1,733 | |||
Labour Co-op | Bernadette R. Supiramaniam | 1,457 | |||
Liberal | William H. Pitt | 490 | |||
Liberal | Janet R. Pitt | 452 | |||
Liberal | David R. Dayus | 388 | |||
Majority | 90 | ||||
Turnout | |||||
Registered electors | |||||
Conservative hold | Swing | ||||
Party | Candidate | Votes | % | ±% | |
---|---|---|---|---|---|
Labour | George E. Mitchell, J.P. | 1,509 | |||
Labour | Robert T. Bishop | 1,508 | |||
Labour | Stanley L. Eaton | 1,436 | |||
Conservative | Denis V. Read | 1,360 | |||
Conservative | Julia A. Wood | 1,330 | |||
Conservative | Hugh J. A. Sawyer | 1,324 | |||
Majority | 76 | ||||
Turnout | |||||
Registered electors | |||||
Labour hold | Swing | ||||
Party | Candidate | Votes | % | ±% | |
---|---|---|---|---|---|
Conservative | Alan K. Carey | 3,342 | |||
Conservative | Richard D. May | 3,332 | |||
Conservative | Maurice A. Fowler | 3,274 | |||
Liberal | Margaret R. A. Billenness , J.P. | 630 | |||
Liberal | Trevor J. Austin | 560 | |||
Liberal | John P. Callen | 553 | |||
Labour | Roger M. Burgess | 358 | |||
Labour | Sarah A. Bolsover | 357 | |||
Labour | Sheila D. Poole | 300 | |||
Majority | 2,644 | ||||
Turnout | |||||
Registered electors | |||||
Conservative hold | Swing | ||||
Party | Candidate | Votes | % | ±% | |
---|---|---|---|---|---|
Conservative | David L. Congdon | 1,440 | |||
Conservative | Stephen G. Ghero | 1,171 | |||
Labour | Robert B. Fenton | 955 | |||
Labour Co-op | Sinnathamby Supiramaniam | 624 | |||
Liberal | Anthony J. Cattermole | 187 | |||
Liberal | Surendrakumar I. Patel | 105 | |||
Majority | 216 | ||||
Turnout | |||||
Registered electors | |||||
Conservative gain from Labour | Swing | ||||
Croydon Central is a constituency created in 1974 and is represented in the House of Commons of the UK Parliament since 2017 by Labour MP Sarah Jones. The seat bucked the trend in national results in 2019, with Labour holding the seat with a slightly increased majority.
Croydon South is a constituency created in 1974 and represented in the House of Commons of the UK Parliament since 2015 by Chris Philp, a Conservative.
Lambeth London Borough Council is elected every four years.
Elections for the Croydon London Borough Council are held every four years to elect 70 councillors. The last ward boundary changes came into force at the 2018 local elections.
Bromley London Borough Council is the local authority for the London Borough of Bromley. The council is elected every four years.
Lewisham London Borough Council is the local authority for the London Borough of Lewisham, in London, United Kingdom. Elections are held every four years using a plurality bloc vote electoral system for the councillors and the supplementary vote electoral system for the elected mayor.
Southwark London Borough Council is the local authority for the London Borough of Southwark in London, England. The council is elected every four years. Since the last boundary changes in 2018, 63 councillors have been elected from 23 wards.
Sutton London Borough Council in London, England is elected every four years.
Elections for the London Borough of Merton were held on 7 May 1998 to elect members of Merton London Borough Council in London, England. This was on the same day as other local elections in England and a referendum on the Greater London Authority; in the latter, Merton voted in favour of creating the Greater London Authority by 72.2% on a 37.6% turnout.
Croydon London Borough Council is the local authority for the London Borough of Croydon in Greater London, England. It is a London borough council, one of 32 in the United Kingdom capital of London. Croydon is divided into 28 wards, electing 70 councillors.
There were local government elections in London on Thursday 22 May 2014. All councillor seats on the 32 London borough councils were up for election. The electorates of Hackney, Lewisham, Newham and Tower Hamlets also elected their executive mayors, who operate in place of council leaders in those boroughs. Ward changes took place in Hackney, Kensington and Chelsea, and Tower Hamlets, which reduced the total number of councillors by 10 to 1,851. Both the mayoral and councillor elections are four-yearly.
The 1964 Croydon Council election took place on 7 May 1964 to elect members of Croydon London Borough Council in London, England. The whole council was up for election and the council went into no overall control.
The 1974 Croydon Council election took place on 2 May 1974 to elect members of Croydon London Borough Council in London, England. The whole council was up for election and the Conservative party stayed in overall control of the council.
The 1986 Croydon Council election took place on 8 May 1986 to elect members of Croydon London Borough Council in London, England. The whole council was up for election and the Conservative party stayed in overall control of the council.
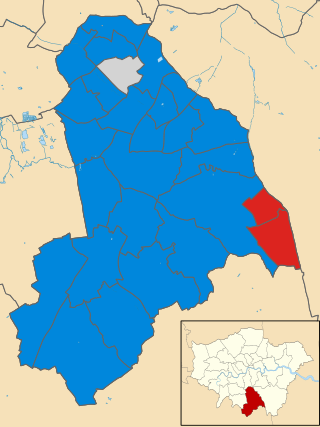
The 1982 Croydon Borough Council election took place on 6 May 1982 to elect members of Croydon London Borough Council in London, England. The whole council was up for election and the Conservative Party stayed in overall control of the council.
The 1994 Croydon Council election took place on 5 May 1994 to elect members of Croydon London Borough Council in London, England. The whole council was up for election and the Labour party gained overall control of the council.
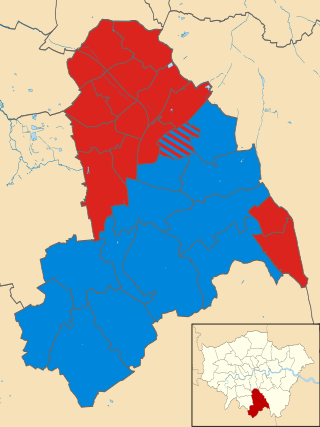
The 2018 Croydon Council election took place on 3 May 2018 to elect members of Croydon Council in England. This was on the same day as other London local elections.
Sanderstead North was a ward in the London Borough of Croydon, London in the United Kingdom, created in 1965, and abolished in 1978.
The 2022 London local elections took place on 5 May 2022, as part of the 2022 United Kingdom local elections. All London borough councillor seats were up for election. Mayoral elections took place in Hackney, Lewisham, Newham and Tower Hamlets, with Croydon electing a mayor for the first time following a local referendum in October 2021.
In the 2022 Croydon London Borough Council election, on 5 May 2022, all 70 members of Croydon London Borough Council, and the Mayor of Croydon, were up for election. The elections took place alongside the local elections in the other London boroughs and elections to local authorities across the United Kingdom. Jason Perry of the Conservative Party narrowly won the mayoral election.