| |||||||||||||||||||||||||||||||||
All 60 seats to Hammersmith and Fulham London Borough Council 31 seats needed for a majority | |||||||||||||||||||||||||||||||||
---|---|---|---|---|---|---|---|---|---|---|---|---|---|---|---|---|---|---|---|---|---|---|---|---|---|---|---|---|---|---|---|---|---|
Turnout | 41.3% (![]() | ||||||||||||||||||||||||||||||||
| |||||||||||||||||||||||||||||||||
|
The 1974 Hammersmith Council election took place on 2 May 1974 to elect members of Hammersmith London Borough Council in London, England. The whole council was up for election and the Labour party stayed in overall control of the council. [2]
Both Labour and the Conservatives fielded a full slate of 60 candidate, as usual.
The Liberal Party ran 19 candidates across seven wards - an increase on the seven candidates across three wards which they ran in 1971.
In an era when candidates could choose their party designation without reference to an officially registered entity - two candidates in the Avonmore ward ran under the 'Powellite Conservative' banner. These were the only candidates across the whole of the London local elections to use this designation.
Whilst 125 people across London stood as Communist Party candidates - there was just one in Hammersmith. Mr J Gould stood again in the White City ward.
Across London 72 people stood under the 'Save London Action Group' banner - but in Hammersmith there was a single such candidate, in the Crabtree ward.
Two independent candidates stood for election - one each in Crabtree ward and St Stephen's ward.
A total of 145 candidates put themselves forward for the 60 seats.
The Labour Party won 48 seats - a loss of 10 seats from the previous election, but remained firmly in control. The Conservative Party won 10 seats - a gain of 8 seats from their previous result. The Liberal Party won 2 seats - a gain of two from the last election, and the first time that any party other than Labour and the Conservatives won a seat on this council. One of the newly elected Liberal councillors (Simon Knott) previously stood as a candidate at all three elections for the same ward. [3] [4]
Party | Candidate | Votes | % | ±% | |
---|---|---|---|---|---|
Labour | Hammond, Mrs C. J. | 999 | |||
Labour | Hanscomb, L. | 934 | |||
Labour | Perlin, P. S. | 908 | |||
Conservative | Belsham Mrs F. E. J. | 832 | |||
Conservative | Fleetwood-Hesketh, Miss E. D. | 817 | |||
Conservative | Prior, C. C. L. | 795 | |||
Turnout | % | % | |||
Labour hold | Swing | ||||
Party | Candidate | Votes | % | ±% | |
---|---|---|---|---|---|
Conservative | Putnam, J. C. | 982 | |||
Conservative | Wylie, J.C. | 965 | |||
Labour | Whalley, Miss A. | 701 | |||
Labour | Hall, M. A. | 677 | |||
Liberal | Dyer, Mrs C. M. | 233 | |||
Liberal | Davis, B. | 204 | |||
Powellite Conservative | Simmerson, R. E. G. | 65 | |||
Powellite Conservative | Stokes, M. R. | 50 | |||
Turnout | % | % | |||
Conservative hold | Swing | ||||
Party | Candidate | Votes | % | ±% | |
---|---|---|---|---|---|
Liberal | Knott, S. H. J. A. | 1,370 | |||
Labour | Simpson, G. E. C. | 1,054 | |||
Liberal | Stratton, Miss C. E. | 997 | |||
Labour | Mason, Mrs A. E. | 988 | |||
Labour | Harris, Mrs S. H. | 954 | |||
Liberal | Allen, H. V. | 925 | |||
Conservative | Bryce-Smith, N. | 599 | |||
Conservative | Hogan, Miss G. C. | 560 | |||
Conservative | Cohen, I. | 550 | |||
Turnout | % | % | |||
Liberal gain from Labour | Swing | ||||
Labour hold | Swing | ||||
Liberal gain from Labour | Swing | ||||
Party | Candidate | Votes | % | ±% | |
---|---|---|---|---|---|
Conservative | Smith, W. C. | 1,097 | |||
Conservative | Field, R. G. | 1,090 | |||
Conservative | Waterson, N. C. | 1,072 | |||
Labour | Stanley, L. W. | 773 | |||
Labour | Wicks, Mrs J. A. | 726 | |||
Labour | Bamford, Mrs M. J. | 720 | |||
Liberal | Chase, S. G. | 357 | |||
Liberal | Holt, B. | 339 | |||
Liberal | Holt, Mrs M. M. | 339 | |||
Turnout | % | % | |||
Conservative gain from Labour | Swing | ||||
Party | Candidate | Votes | % | ±% | |
---|---|---|---|---|---|
Labour | O'Neill, L. C. | 940 | |||
Labour | Dimmick, Mrs G. I. | 872 | |||
Conservative | Maxwell, P. B. | 423 | |||
Conservative | Akerman, J. F. S. | 417 | |||
Liberal | George, K. | 264 | |||
Liberal | Strickland, Mrs H. | 249 | |||
Turnout | % | % | |||
Labour hold | Swing | ||||
Party | Candidate | Votes | % | ±% | |
---|---|---|---|---|---|
Labour | Fenelon, Miss M. | 1,756 | |||
Labour | Ing, F. W. | 1,756 | |||
Labour | Breeze, A. G. | 1,749 | |||
Conservative | Gellately-Smith, Mrs K. E. | 285 | |||
Conservative | Patterson, Mrs C. G. | 262 | |||
Conservative | Wright, B. L. D. | 250 | |||
Turnout | % | % | |||
Labour hold | Swing | ||||
Party | Candidate | Votes | % | ±% | |
---|---|---|---|---|---|
Labour | Bull, J. | 914 | |||
Labour | Crawford, Mrs E. | 899 | |||
Labour | Martin, A. J. | 873 | |||
Conservative | Harris, R. M. | 376 | |||
Conservative | Hutson, Mrs C. J. | 374 | |||
Conservative | Barnard, Miss M. W. | 361 | |||
Turnout | % | % | |||
Labour hold | Swing | ||||
Party | Candidate | Votes | % | ±% | |
---|---|---|---|---|---|
Labour | Banfield, Mrs D. J. | 1,340 | |||
Conservative | Howe, K. G. F. B. | 1,297 | |||
Labour | Evans, J. G. | 1,295 | |||
Labour | Hewitt, J. J. A. | 1285 | |||
Conservative | Tickler, G. R. G. C. | 1267 | |||
Conservative | Fitzgerald, Miss P. A. | 1263 | |||
Save London Action Group | de Maupeou, Mrs V. M. | 132 | |||
Independent | Ashworth, M. S. | 124 | |||
Turnout | % | % | |||
Labour hold | Swing | ||||
Conservative gain from Labour | Swing | ||||
Labour hold | Swing | ||||
Party | Candidate | Votes | % | ±% | |
---|---|---|---|---|---|
Labour | Clarke, Mrs M. L. | 1,388 | |||
Labour | Kelly, Miss F. D. | 1,340 | |||
Labour | Norridge, A. M. | 1,308 | |||
Conservative | James, S. | 1018 | |||
Conservative | Browne, N. N. | 1017 | |||
Conservative | Lengyel, P. I. S. | 984 | |||
Liberal | Lyon, C. | 311 | |||
Liberal | Cox, Mrs C. | 308 | |||
Liberal | Barrington-Ward, Miss C. | 250 | |||
Turnout | % | % | |||
Labour hold | Swing | ||||
Party | Candidate | Votes | % | ±% | |
---|---|---|---|---|---|
Labour | Jackson, Mrs M. | 1,286 | |||
Labour | Jacobs, P. S. | 1,281 | |||
Labour | Jowett, Mrs D. | 1,244 | |||
Conservative | Phillips, P. M. | 920 | |||
Conservative | O'Connor, C. | 909 | |||
Conservative | Thomas, D. E. G. | 878 | |||
Turnout | % | % | |||
Labour hold | Swing | ||||
Party | Candidate | Votes | % | ±% | |
---|---|---|---|---|---|
Labour | Green, A. | 1,136 | |||
Labour | O'Neill, Mrs S. M. | 1,104 | |||
Labour | McCourt, I. | 1,103 | |||
Conservative | Jarvis, Mrs M. M. | 641 | |||
Conservative | Cox, W. D. S. | 629 | |||
Conservative | Osmond, A. J. | 612 | |||
Turnout | % | % | |||
Labour hold | Swing | ||||
Party | Candidate | Votes | % | ±% | |
---|---|---|---|---|---|
Labour | Champion, T. H. | 1,317 | |||
Labour | Rayner, R. W. | 1,286 | |||
Labour | Soley, C. S. | 1,275 | |||
Conservative | Osmond, Mrs C. M. | 436 | |||
Conservative | Wooster, Mrs B. E | 416 | |||
Conservative | Becker, R. A | 411 | |||
Turnout | % | % | |||
Labour hold | Swing | ||||
Party | Candidate | Votes | % | ±% | |
---|---|---|---|---|---|
Conservative | Jackson, A. R. | 1,448 | |||
Conservative | Leishman, Mrs B. M. | 1,420 | |||
Conservative | Leishman, S. N. B. | 1,400 | |||
Labour | Duff, H. D. | 1335 | |||
Labour | Hammocks, J. | 1287 | |||
Labour | Dimmick, G. W. | 1252 | |||
Turnout | % | % | |||
Conservative gain from Labour | Swing | ||||
Party | Candidate | Votes | % | ±% | |
---|---|---|---|---|---|
Labour | Jones, L. S. | 936 | |||
Labour | Braggins, Mrs G. | 927 | |||
Labour | Degory, P. D. | 923 | |||
Liberal | Griffith, Mrs E. | 286 | |||
Conservative | Cohen, Mrs R. | 265 | |||
Liberal | Turner, M. A. | 265 | |||
Liberal | Coombes, Mrs V. E. K. | 249 | |||
Conservative | Webb, F. W. Miss | 221 | |||
Independent | Sugrue, M. J. | 215 | |||
Conservative | Sharif, M. | 206 | |||
Turnout | % | % | |||
Labour hold | Swing | ||||
Party | Candidate | Votes | % | ±% | |
---|---|---|---|---|---|
Labour | Ireland, J. | 1,744 | |||
Labour | Raynsford, W. R. N. | 1,709 | |||
Labour | Finn, M. | 1,670 | |||
Conservative | Hayes, F. G. | 839 | |||
Conservative | Hammond, S. T. | 833 | |||
Conservative | Lapham, R. D. | 815 | |||
Turnout | % | % | |||
Labour hold | Swing | ||||
Party | Candidate | Votes | % | ±% | |
---|---|---|---|---|---|
Labour | Chapman, Mrs J. | 1,174 | |||
Labour | Gray, I. | 1,108 | |||
Conservative | De Chair, H. G. D. | 327 | |||
Conservative | Barrow, B. P. | 321 | |||
Turnout | % | % | |||
Labour hold | Swing | ||||
Party | Candidate | Votes | % | ±% | |
---|---|---|---|---|---|
Labour | Freeman, L. W. | 1,086 | |||
Labour | Johnson, Mrs R. M. | 1,069 | |||
Labour | Wicks, L. J. | 1,011 | |||
Conservative | Lewis, C. A. | 995 | |||
Conservative | Hutson, E. J. | 992 | |||
Conservative | Radmore, C. D. | 980 | |||
Liberal | Cook, Miss S. C. | 304 | |||
Liberal | Quinn, S. | 278 | |||
Liberal | Beger-Spayne, Mrs E. C. | 258 | |||
Turnout | % | % | |||
Labour hold | Swing | ||||
Party | Candidate | Votes | % | ±% | |
---|---|---|---|---|---|
Labour | Powell, A. F. W. | 1,598 | |||
Labour | Godden, Mrs V. | 1,577 | |||
Labour | Liardet, Mrs C. J. | 1,556 | |||
Conservative | Ibbott, E. C. | 1101 | |||
Conservative | Kingham, B. | 1101 | |||
Conservative | Colegrave, W. R. B. | 1081 | |||
Turnout | % | % | |||
Labour hold | Swing | ||||
Party | Candidate | Votes | % | ±% | |
---|---|---|---|---|---|
Labour | Hilliard, L. H. | 1,245 | |||
Labour | Unwin, S. W. | 1,239 | |||
Conservative | Clarke, Mrs E. L. L. | 1,237 | |||
Conservative | Colling, D. J. | 1234 | |||
Conservative | Tweedie, D. A. O. | 1220 | |||
Labour | Widdowson, R. | 1217 | |||
Turnout | % | % | |||
Labour hold | Swing | ||||
Conservative gain from Labour | Swing | ||||
Party | Candidate | Votes | % | ±% | |
---|---|---|---|---|---|
Labour | Hathaway, Miss J. M. | 1,237 | |||
Labour | Stead, B. J. | 1,084 | |||
Labour | Beresford, R. | 1,068 | |||
Conservative | Gellately-Smith, R. | 238 | |||
Conservative | Lewis, Mrs C. H. | 232 | |||
Conservative | Rolfe, Mrs P. F. | 217 | |||
Communist | Gould, J. | 176 | |||
Turnout | % | % | |||
Labour hold | Swing | ||||
Party | Candidate | Votes | % | ±% | |
---|---|---|---|---|---|
Labour | Ingram, A. A. | 1,184 | |||
Labour | Donoghue, O. | 1,164 | |||
Labour | Ingram, Mrs M. E. | 1,153 | |||
Conservative | Barnes, J. M. | 574 | |||
Conservative | Darwin, Mrs J. M. | 544 | |||
Conservative | Lesniowski, J. J. | 534 | |||
Turnout | % | % | |||
Labour hold | Swing | ||||
The 1990 Newham London Borough Council election to the Newham London Borough Council was held on 3 May 1990. The whole council was up for election. Turnout was 33.0%. Labour maintained its overwhelming majority.
The 1986 Newham London Borough Council election for the Newham London Borough Council was held on 8 May 1986. The whole council was up for election. Turnout was 30.7%. Labour, for the first time, won all 60 seats.
The 1982 Newham London Borough Council election for the Newham London Borough Council was held on 6 May 1982. The whole council was up for election. Turnout was 27.0%. The Labour Party held onto its overwhelming majority.
Elections to Newham London Borough Council were held in May 1971. The whole council was up for election. Turnout was 27.3%. This election had aldermen as well as councillors. Labour won all ten aldermen positions.
The 1964 Lewisham Council election took place on 7 May 1964 to elect members of Lewisham London Borough Council in London, England. The whole council was up for election and the Labour Party gained control of the council.
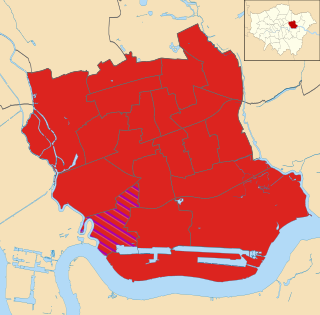
Elections to Newham London Borough Council were held on 2 May 2002. The whole council was up for election. Turnout was 25.49%. Labour won all but one seat. The sole opposition councillor was Alan Craig of the Christian Peoples Alliance.
The 1964 Barking Borough Council election took place on 7 May 1964 to elect members of Barking London Borough Council in London, England. The whole council was up for election and the Labour Party gained control of the council.
The 1964 Bromley Council election took place on 7 May 1964 to elect members of Bromley London Borough Council in London, England. The whole council was up for election and the Conservative party gained control of the council.
The 1964 Greenwich Council election took place on 7 May 1964 to elect members of Greenwich London Borough Council in London, England. The whole council was up for election and the Labour party gained control of the council.
The 1964 Hammersmith Council election took place on 7 May 1964 to elect members of Hammersmith London Borough Council in London, England. The whole council was up for election and the Labour party gained control of the council with almost 63% of the vote.
The 1964 Tower Hamlets Council election took place on 7 May 1964 to elect members of Tower Hamlets London Borough Council in London, England. The whole council was up for election and the Labour party won control.
The 1964 Wandsworth Council election took place on 7 May 1964 to elect members of Wandsworth London Borough Council in England. The whole council was up for election and the Labour party gained control of the council.
The 1964 Kensington and Chelsea Council election took place on 7 May 1964 to elect members of Kensington and Chelsea London Borough Council in London, England. The whole council was up for election and the Conservative party gained control of the council.
The 1964 Sutton Council election took place on 7 May 1964 to elect members of Sutton London Borough Council in London, England. The whole council was up for election and the Conservative party gained control of the council.
The 1971 Hammersmith Council election took place on 13 May 1971 to elect members of Hammersmith London Borough Council in London, England. The whole council was up for election and the Labour party gained overall control of the council.
The 1978 Hammersmith Council election took place on 4 May 1978 to elect members of Hammersmith London Borough Council in London, England. The whole council was up for election, with an extra two wards and 10 fewer councillors - and the council went in no overall control.
The 1982 Hammersmith and Fulham Council election took place on 6 May 1982 to elect members of Hammersmith and Fulham London Borough Council in London, England. The whole council was up for election and the council stayed in no overall control.
The 1986 Hammersmith and Fulham Council election took place on 8 May 1986 to elect members of Hammersmith and Fulham London Borough Council in London, England. The whole council was up for election and the Labour party gained overall control of the council.
The 1994 Hammersmith and Fulham Borough Council election took place on 5 May 1994 to elect members of Hammersmith and Fulham London Borough Council in London, England. The whole council was up for election and the Labour Party regained overall control of the council, which it had lost during the previous council term.
The 2018 Newham London Borough Council election was held on 3 May 2018 to elect members of Newham London Borough Council in England. This was on the same day as other local elections.