| |||||||||||||||||||||||||||||||||||||||||||||
All 70 seats, in 27 wards in the London Borough of Croydon 36 seats needed for a majority | |||||||||||||||||||||||||||||||||||||||||||||
---|---|---|---|---|---|---|---|---|---|---|---|---|---|---|---|---|---|---|---|---|---|---|---|---|---|---|---|---|---|---|---|---|---|---|---|---|---|---|---|---|---|---|---|---|---|
| |||||||||||||||||||||||||||||||||||||||||||||
Map of the results of the 1982 Croydon Council election. | |||||||||||||||||||||||||||||||||||||||||||||
|
The 1982 Croydon Borough Council election took place on 6 May 1982 to elect members of Croydon London Borough Council in London, England. The whole council was up for election and the Conservative Party stayed in overall control of the council. [1]
This section is empty. You can help by adding to it. (March 2015) |
Party | Seats | Gains | Losses | Net gain/loss | Seats % | Votes % | Votes | +/− | |
---|---|---|---|---|---|---|---|---|---|
Conservative | 62 | 6 | 0 | +8 | 88.6 | 55.6 | |||
Alliance | 0 | 0 | 0 | 0 | 0.0 | 22.5 | |||
Labour | 5 | 0 | 6 | -8 | 7.1 | 18.6 | |||
Independent | 3 | 0 | 0 | 0 | 4.3 | 3.2 |
Party | Candidate | Votes | % | ±% | |
---|---|---|---|---|---|
Conservative | Peter G. Holt-Thomas | 2,312 | |||
Conservative | Megan Holt-Thomas | 2,291 | |||
Conservative | Ronald W. Richens | 2,211 | |||
Labour Co-op | Nancy T. Irwin | 1,480 | |||
Labour Co-op | Rona A. Thomson | 1,447 | |||
Labour Co-op | Patricia F.L. Knight | 1,418 | |||
SDP | Angela C. Thomson | 992 | |||
Liberal | Paul David Wiggin | 943 | |||
SDP | Patricia A. Charman | 875 | |||
Majority | |||||
Turnout | |||||
Registered electors | |||||
Conservative hold | Swing |
Party | Candidate | Votes | % | ±% | |
---|---|---|---|---|---|
Conservative | Edwin S. Arram | 1,818 | |||
Conservative | Donald J. Sutton | 1,708 | |||
SDP | Tyrrell Burgess | 617 | |||
Liberal | Leslie A. Christie | 587 | |||
Labour | Howard C. Gurr | 552 | |||
Labour | Rodney G.D. Matlock | 511 | |||
Turnout | |||||
Conservative hold | Swing | ||||
Conservative hold | Swing |
Party | Candidate | Votes | % | ±% | |
---|---|---|---|---|---|
Conservative | Ronald J. Bowker | 1,918 | |||
Conservative | Joan M. Goodman | 1,848 | |||
Conservative | Julia A. Wood | 1,705 | |||
Labour | Robert N. Hughes | 1,236 | |||
Labour | Robert P. Priest | 1,149 | |||
Labour | Ian Smedley | 1,146 | |||
SDP | Janice M. Crockett | 811 | |||
SDP | Jai M. Mathur | 773 | |||
Liberal | John A. Pile-Gray | 875 | |||
Ecology | Timothy A.J Rowe | 111 | |||
Turnout | |||||
Conservative hold | Swing |
Party | Candidate | Votes | % | ±% | |
---|---|---|---|---|---|
Conservative | Philomena M. Drummond-Brown | 1,815 | |||
Conservative | Klemens E. Zdanowicz | 1,751 | |||
SDP | Graham F. Williams | 613 | |||
Liberal | Anthony M. Everett | 598 | |||
Labour | Alice R. Tyrell | 495 | |||
Labour | Roger J. Borne | 479 | |||
Turnout | |||||
Conservative hold | Swing | ||||
Conservative hold | Swing |
Party | Candidate | Votes | % | ±% | |
---|---|---|---|---|---|
Conservative | Gillian Charman | 1,216 | |||
Conservative | Andrew John Pelling | 1,173 | |||
Conservative | Douglas A.H. Sharman | 1,151 | |||
Labour | James A. Keeling | 1,138 | |||
Labour | Victor Martin | 1,067 | |||
Labour | Ann M. Watson | 1,057 | |||
SDP | Moira C. Bamfield | 846 | |||
Liberal | Charles E. Burling | 831 | |||
Liberal | David E. Beeke | 823 | |||
Communist | Peter A.G. Latham | 78 | |||
Turnout | |||||
Conservative gain from Labour | Swing |
Party | Candidate | Votes | % | ±% | |
---|---|---|---|---|---|
Conservative | Stanley E. Littlechild | 2,627 | |||
Conservative | Pamela A.M. Little | 2,600 | |||
Conservative | Martin A. Levie | 2,461 | |||
Liberal | Peter Hasler Billenness | 1,333 | |||
Liberal | Ian R. Atkins | 1,276 | |||
SDP | Richard M. Wevill | 1,270 | |||
Labour | Patrick J. Hearn | 267 | |||
Labour | Andrew M. Conway | 252 | |||
Labour | Edward J. Phillips | 228 | |||
Turnout | |||||
Conservative hold | Swing | ||||
Conservative hold | Swing |
Party | Candidate | Votes | % | ±% | |
---|---|---|---|---|---|
Conservative | Ian Croft | 2,961 | |||
Conservative | John P.B. Hecks | 2,944 | |||
Conservative | Keith A. Wells | 2,884 | |||
SDP | Christopher G. Peacock | 1,308 | |||
Liberal | Richard T. Mascall | 1,215 | |||
Liberal | Richard E. Tudway | 1,148 | |||
Labour | William E. Short | 382 | |||
Labour | Pauline H. Scharp | 373 | |||
Labour | David J. White | 342 | |||
Turnout | 44.8 | ||||
Registered electors | 10,187 | ||||
Conservative hold | Swing | ||||
Conservative hold | Swing |
Party | Candidate | Votes | % | ±% | |
---|---|---|---|---|---|
Conservative | John L. Aston | 3,195 | |||
Conservative | Robert W. Coatman | 3,170 | |||
Conservative | Michael D. Wunn | 3,031 | |||
SDP | Vincent C. Green | 1,027 | |||
SDP | Niccola Swan | 984 | |||
Liberal | Desmond J. Stockley | 913 | |||
Labour | Frank D.J. Bailey | 638 | |||
Labour | Ian E. Chandler | 591 | |||
Labour | Edward L. Hall | 588 | |||
Turnout | |||||
Conservative hold | Swing | ||||
Conservative hold | Swing |
Party | Candidate | Votes | % | ±% | |
---|---|---|---|---|---|
Labour Co-op | James L. Walker | 1,144 | |||
Labour Co-op | Mary M. Walker | 904 | |||
Conservative | Roy T. Miller | 433 | |||
Liberal | Yvette M.G. Luff | 409 | |||
SDP | David A. Partridge | 381 | |||
Conservative | Adrian J. Goodenough | 323 | |||
Turnout | |||||
Labour Co-op hold | Swing | ||||
Labour Co-op hold | Swing |
Party | Candidate | Votes | % | ±% | |
---|---|---|---|---|---|
Conservative | Richard F. Pannett | 3,039 | |||
Conservative | Mary M.H. Horden | 2,942 | |||
Conservative | Nicholas E.V. Perry | 2,847 | |||
Liberal | Michael J. Douglas | 883 | |||
SDP | Kathleen M. Crawford | 856 | |||
Liberal | Robert J. Williams | 844 | |||
Labour | Beatrice A. Pollard | 380 | |||
Labour | Sean Jones | 355 | |||
Labour | Stella M. Harvey | 353 | |||
Turnout | |||||
Conservative hold | Swing | ||||
Conservative hold | Swing |
Party | Candidate | Votes | % | ±% | |
---|---|---|---|---|---|
Conservative | Margaret E. Campbell | 2,192 | |||
Conservative | Brian G. Smith | 2,061 | |||
Liberal | Ivo Nicholls | 664 | |||
SDP | Robert D. Riddett | 634 | |||
Labour | Roger M. Burgess | 268 | |||
Labour | Malcolm E. Kilsby | 263 | |||
Turnout | |||||
Conservative hold | Swing | ||||
Conservative hold | Swing |
Party | Candidate | Votes | % | ±% | |
---|---|---|---|---|---|
Conservative | Derek R. Loughborough | 2,011 | |||
Conservative | Albert W. Elliott | 1,993 | |||
Independent | Kenneth R. Brown | 1,421 | |||
Independent | Hugh W. Allardyce | 1,344 | |||
SDP | Anne M. Brown | 392 | |||
Labour | John C. Barlow | 336 | |||
Labour | Donald A. Ray | 316 | |||
Turnout | |||||
Conservative hold | Swing | ||||
Conservative hold | Swing |
Party | Candidate | Votes | % | ±% | |
---|---|---|---|---|---|
Labour | Reginald J. Page | 1,357 | |||
Labour | Trevor J. Laffin | 1,174 | |||
Labour | Alan C. Lord | 1,087 | |||
Conservative | William J. Eastoe | 779 | |||
Conservative | Robert A. Bell | 746 | |||
Conservative | Michael W. Coatman | 723 | |||
SDP | Anthony E.W. Gooch | 577 | |||
SDP | Ainslie C. Bazely | 492 | |||
Liberal | Frances M. Williams | 484 | |||
Turnout | |||||
Labour hold | Swing | ||||
Labour hold | Swing |
Party | Candidate | Votes | % | ±% | |
---|---|---|---|---|---|
Conservative | Colin Johnston | 2,682 | |||
Conservative | Keith M. B. Munro | 2,657 | |||
Conservative | Bryan J. Kendall | 2,637 | |||
Liberal | Barry J. Davies | 1,258 | |||
Liberal | David Armer | 1,222 | |||
SDP | Geoffrey Morley | 1,197 | |||
Labour | Mark B. Howarth | 755 | |||
Labour | Ruth A. Ishmael | 687 | |||
Labour | Janet M. Pickering | 623 | |||
Turnout | |||||
Conservative hold | Swing | ||||
Conservative hold | Swing |
Party | Candidate | Votes | % | ±% | |
---|---|---|---|---|---|
Conservative | Peter J. F. Macdonald | 3,065 | |||
Conservative | George A. Smith | 3,029 | |||
Conservative | David L. Congdon | 2,988 | |||
SDP | Sheila Buckle | 1,071 | |||
SDP | Katherine A. Mundy | 1,048 | |||
Liberal | Graham P. Wickham | 1,021 | |||
Labour | Barry V. Bulled | 243 | |||
Labour | Jean Barlow | 236 | |||
Labour | Julie A. Taylor | 235 | |||
Turnout | |||||
Conservative hold | Swing | ||||
Conservative hold | Swing |
Party | Candidate | Votes | % | ±% | |
---|---|---|---|---|---|
Conservative | Guy L. Harding | 1,365 | |||
Conservative | Peter R. Crockford | 1,294 | |||
Labour | Robert C. E. Brooks | 722 | |||
Labour | Philip A. Durban | 678 | |||
SDP | Diana M. Dawe | 488 | |||
Liberal | Joseph Short* | 273 | |||
Turnout | |||||
Conservative hold | Swing | ||||
Conservative hold | Swing |
Party | Candidate | Votes | % | ±% | |
---|---|---|---|---|---|
Conservative | Ronald W. Haskins | 2,649 | |||
Conservative | David N. Bowen | 2,570 | |||
Liberal | Raymond W. Bustin | 889 | |||
SDP | Eric J. Mann | 853 | |||
Labour | Keith M. Roberts | 163 | |||
Labour | Lillian L. Scott | 158 | |||
Turnout | |||||
Conservative hold | Swing | ||||
Conservative hold | Swing |
Party | Candidate | Votes | % | ±% | |
---|---|---|---|---|---|
Conservative | Dudley S. Mead | 2,637 | |||
Conservative | Ian L. Aarons | 2,553 | |||
Liberal | James S. Forrest | 1,393 | |||
SDP | Stephen A. Hall | 1,254 | |||
Labour | Michael P. J. Phelan | 196 | |||
Labour | John H. Robinson | 157 | |||
Turnout | |||||
Conservative hold | Swing | ||||
Conservative hold | Swing |
Party | Candidate | Votes | % | ±% | |
---|---|---|---|---|---|
Conservative | Beryl Saunders | 1,785 | |||
Conservative | Paul A. Saunders | 1,752 | |||
Conservative | Eileen J. Longhorn | 1,745 | |||
Liberal | Ian S. Manders | 965 | |||
Liberal | Jeremy E. Cope | 927 | |||
Liberal | Leslie Anthony Rowe | 927 | |||
Labour | Leni Gillman | 600 | |||
Labour | Jonathan Pickering | 588 | |||
Labour | Peter Luxton | 585 | |||
Majority | 780 | ||||
Turnout | |||||
Registered electors | |||||
Conservative hold | Swing |
Party | Candidate | Votes | % | ±% | |
---|---|---|---|---|---|
Conservative | Denis E. Perry | 3,023 | |||
Conservative | Peter Spencer Bowness | 2,976 | |||
SDP | David B. Crampton | 686 | |||
Liberal | John F. Chandler | 602 | |||
Labour | John R. March | 498 | |||
Labour | Stephen H. Tiller | 429 | |||
Turnout | |||||
Conservative hold | Swing |
Party | Candidate | Votes | % | ±% | |
---|---|---|---|---|---|
Residents | John G. Davies | 1,705 | |||
Residents | Gordon Poluck | 1,664 | |||
Residents | William Blackwood | 1,539 | |||
Labour | Patrick Byrne | 1,006 | |||
Labour | Frances M. Conn | 912 | |||
Labour | Herbert W. Tyler | 909 | |||
SDP | Clive Bone | 741 | |||
SDP | William G. A. Graham | 732 | |||
Liberal | Julia S. Gordon | 695 | |||
Majority | 533 | ||||
Turnout | |||||
Registered electors | |||||
Residents hold | Swing | ||||
Residents hold | Swing |
Party | Candidate | Votes | % | ±% | |
---|---|---|---|---|---|
Conservative | Ernest G. Noad | 1,579 | |||
Conservative | Margaret C. V. Perfitt | 1,543 | |||
Labour | Patrick T. Ryan | 555 | |||
Liberal | Leo C. E. Held | 533 | |||
SDP | Lawrence West | 514 | |||
Labour | Andrew M. S. Ward | 508 | |||
Turnout | |||||
Conservative hold | Swing | ||||
Conservative hold | Swing |
Party | Candidate | Votes | % | ±% | |
---|---|---|---|---|---|
Conservative | James J. Nea | 2,328 | |||
Conservative | Reginald H. Kent | 2,285 | |||
Conservative | Beverley S. Winborn | 2,151 | |||
Labour | Christopher R. Allen | 1480 | |||
Labour | Hartley Dean | 1400 | |||
Labour | Martin D. Walker | 1382 | |||
SDP | Janet M. Sinclair | 773 | |||
Liberal | Joan M. Leck | 764 | |||
SDP | Ian Wonacott | 681 | |||
Turnout | |||||
Conservative hold | Swing | ||||
Conservative hold | Swing |
Party | Candidate | Votes | % | ±% | |
---|---|---|---|---|---|
Conservative | Eric W. Howell | 1,771 | |||
Conservative | Yvonne A. L. Stewart | 1,738 | |||
Conservative | Anita C. Drummond-Brown | 1,715 | |||
Labour | Margaret R. Mansell | 1,310 | |||
Liberal | Alan R. Mead | 1,170 | |||
Labour | James J. Penman | 1,135 | |||
SDP | Peter R. Norwood | 1,090 | |||
Labour | Arnold J. Simanwitz | 1,044 | |||
Liberal | David R. Dayus | 1,017 | |||
Majority | 405 | ||||
Turnout | |||||
Registered electors | |||||
Conservative hold | Swing | ||||
Conservative hold | Swing |
Party | Candidate | Votes | % | ±% | |
---|---|---|---|---|---|
Conservative | Corinne A. Cook | 1,165 | |||
Conservative | Arthur S. Dwan | 1,132 | |||
Conservative | Denis V. Read | 1,092 | |||
Liberal | Robert F. Holyoake | 932 | |||
Liberal | Iain Gordon | 916 | |||
Labour | George E. Mitchell | 908 | |||
Labour | Robert T. Bishop | 885 | |||
Labour | Julian V. Gannon | 842 | |||
Liberal | Jill L. Servian | 842 | |||
National Front | Nicholas John Griffin | 50 | |||
National Front | Doris A. Merritt | 36 | |||
Majority | 160 | ||||
Turnout | |||||
Registered electors | |||||
Conservative gain from Labour | Swing |
Party | Candidate | Votes | % | ±% | |
---|---|---|---|---|---|
Conservative | Alan K. Carey | 3,214 | |||
Conservative | Samuel J. Moore | 3,096 | |||
Conservative | Maurice A. Fowler | 3,093 | |||
SDP | Maureen E. E. House | 1,078 | |||
Liberal | John P. Callen | 1,052 | |||
Liberal | Herbert H. Giles | 1,006 | |||
Labour | David Denver | 238 | |||
Labour | Geoffrey G. Daisley | 219 | |||
Labour | James Nugent | 217 | |||
Majority | 2,015 | ||||
Turnout | |||||
Registered electors | |||||
Conservative hold | Swing | ||||
Conservative hold | Swing |
Party | Candidate | Votes | % | ±% | |
---|---|---|---|---|---|
Conservative | Dennis F. Todd | 1,200 | |||
Conservative | Stephen G. Ghero | 1,122 | |||
Labour | John M. Laney | 659 | |||
Labour | Stanley L. Eaton | 611 | |||
SDP | Paul F. West | 411 | |||
Liberal | Henry Russell | 380 | |||
Turnout | |||||
Conservative hold | Swing | ||||
Conservative hold | Swing |
Geraint Richard Davies is a British politician who served as the Member of Parliament (MP) for Swansea West from 2010 to 2024. He was elected as a member of the Labour and Co-operative Party, but was suspended from the party in 2023 and sat the remainder of his term as an independent.
Croydon Central was a constituency created in 1974 and represented in the House of Commons of the UK Parliament from 2017 until its abolition for the 2024 general election by Labour MP Sarah Jones. The seat bucked the trend in national results in 2019, with Labour holding the seat with a slightly increased majority.
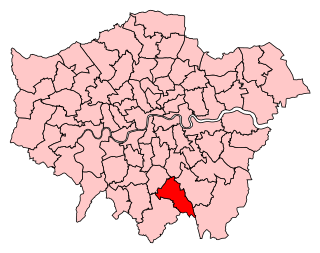
Croydon South is a constituency created in 1974 and represented in the House of Commons of the UK Parliament since 2015 by Chris Philp, a Conservative.
Elections for the Croydon London Borough Council are held every four years to elect 70 councillors. The last ward boundary changes came into force at the 2018 local elections.
Local government elections took place in London, and some other parts of the United Kingdom on Thursday 4 May 2006. Polling stations were open between 7am and 10pm.
Merton London Borough Council in London, England is elected every four years; it has administrative control over the London Borough of Merton.
Elections for the London Borough of Merton were held on 7 May 1998 to elect members of Merton London Borough Council in London, England. This was on the same day as other local elections in England and a referendum on the Greater London Authority; in the latter, Merton voted in favour of creating the Greater London Authority by 72.2% on a 37.6% turnout.
Croydon London Borough Council, which styles itself Croydon Council, is the local authority for the London Borough of Croydon in Greater London, England. It is a London borough council, one of 32 in London. Croydon is divided into 28 wards, electing 70 councillors. Since 2022 the council has been led by a directly elected mayor. The council has been under no overall control since 2022, being run by a Conservative minority administration. The council meets at Croydon Town Hall and has its main offices in the adjoining Bernard Weatherill House.
Local government elections took place in London, and some other parts of the United Kingdom on Thursday 6 May 1982. Ward changes took place in Enfield which increased the total number of councillors by 6 from 1,908 to 1,914.
The 1964 Croydon Council election took place on 7 May 1964 to elect members of Croydon London Borough Council in London, England. The whole council was up for election and the council went into no overall control.
The 1968 Croydon Council election took place on 9 May 1968 to elect members of Croydon London Borough Council in London, England. The whole council was up for election and the Conservative Party gained overall control of the council. Turnout in this election was 36.2%.
The 1974 Croydon Council election took place on 2 May 1974 to elect members of Croydon London Borough Council in London, England. The whole council was up for election and the Conservative Party stayed in overall control of the council.
The 1978 Croydon Council election took place on 4 May 1978 to elect members of Croydon London Borough Council in London, England. The whole council was up for election and the Conservative Party stayed in overall control of the council.
The 1990 Croydon Council election took place on 3 May 1990 to elect members of Croydon London Borough Council in London, England. The whole council was up for election and the Conservative party stayed in overall control of the council.
The 1986 Croydon Council election took place on 8 May 1986 to elect members of Croydon London Borough Council in London, England. The whole council was up for election and the Conservative party stayed in overall control of the council.
The 1994 Croydon Council election took place on 5 May 1994 to elect members of Croydon London Borough Council in London, England. The whole council was up for election and the Labour party gained overall control of the council.
The 2018 Croydon Council election took place on 3 May 2018 to elect members of Croydon Council in England. This was on the same day as other London local elections.
Fieldway was a ward in the London Borough of Croydon, covering part of the New Addington estate in London in the United Kingdom. The ward formed part of the Croydon Central constituency. The population of the ward at the 2011 Census was 11,479. The ward returned two councillors every four years to Croydon Council.
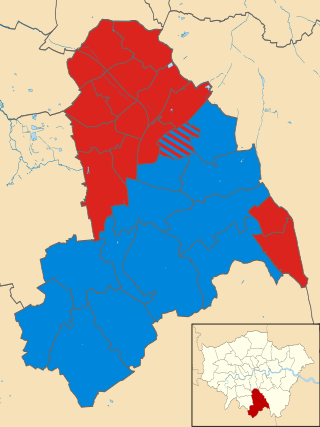
The 2022 London local elections took place on 5 May 2022, as part of the 2022 United Kingdom local elections. All London borough councillor seats were up for election. Mayoral elections took place in Hackney, Lewisham, Newham and Tower Hamlets, with Croydon electing a mayor for the first time following a local referendum in October 2021.
In the 2022 Croydon London Borough Council election, on 5 May 2022, all 70 members of Croydon London Borough Council, and the Mayor of Croydon, were up for election. The elections took place alongside the local elections in the other London boroughs and elections to local authorities across the United Kingdom. Jason Perry of the Conservative Party narrowly won the mayoral election.