| |||||||||||||||||||||||||||||||||||||
All 60 seats to Camden London Borough Council 31 seats needed for a majority | |||||||||||||||||||||||||||||||||||||
---|---|---|---|---|---|---|---|---|---|---|---|---|---|---|---|---|---|---|---|---|---|---|---|---|---|---|---|---|---|---|---|---|---|---|---|---|---|
Turnout | 35.6% | ||||||||||||||||||||||||||||||||||||
| |||||||||||||||||||||||||||||||||||||
|
The 1971 Camden Council election took place on 13 May 1971 to elect members of Camden London Borough Council in London, England. The whole council was up for election and the Labour party gained overall control of the council. [1]
This section is empty. You can help by adding to it. (March 2015) |
Party | Seats | Gains | Losses | Net gain/loss | Seats % | Votes % | Votes | +/− | |
---|---|---|---|---|---|---|---|---|---|
Labour | 49 | 31 | 0 | +31 | 81.7% | 59.5% | +21.0% | ||
Conservative | 11 | 0 | 31 | –31 | 18.3% | 37.7% | –17.2% | ||
Liberal | 0 | 0 | 0 | 0 | 0.0% | 1.8% | –3.7% | ||
Others | 0 | 0 | 0 | 0 | 0.0% | 1.0% | –0.1% |
Party | Candidate | Votes | % | ±% | |
---|---|---|---|---|---|
Conservative | Julian Tobin | 2,090 | |||
Conservative | Brenda Hennessy | 2,087 | |||
Conservative | Madeleine Du Mont | 2,068 | |||
Conservative | Huntly Spence | 2,031 | |||
Labour | Nicholas Bosanquet | 1,981 | |||
Labour | Mark Bass | 1,950 | |||
Labour | Nora Henry | 1,931 | |||
Labour | Barry Phillips | 1,917 | |||
Liberal | Phillip Helemryk | 427 | |||
Liberal | Gillian Latimer | 244 | |||
Liberal | Sheila Williams | 241 | |||
Liberal | Norman Latimer | 226 | |||
Turnout | |||||
Conservative hold | Swing | ||||
Party | Candidate | Votes | % | ±% | |
---|---|---|---|---|---|
Labour | Jill Gibson | 2,225 | |||
Labour | John Lipetz | 2,132 | |||
Labour | Bernard Taylor | 2,130 | |||
Labour | Irving Kuczynski | 2,128 | |||
Conservative | Norman Oatway | 1,955 | |||
Conservative | Irene Burnett | 1,943 | |||
Conservative | Julian Harrison | 1,923 | |||
Conservative | Peter Hilton | 1,885 | |||
Liberal | Margaret Darvall | 352 | |||
Liberal | Mary De La Mahotiere | 313 | |||
Communist | Hubert Bevan | 292 | |||
Liberal | John Swain | 282 | |||
Association of Independents | John Davies | 92 | |||
Association of Independents | Anthony Cunnew | 74 | |||
Association of Independents | Mary Davies | 60 | |||
Turnout | |||||
Labour gain from Conservative | Swing | ||||
Party | Candidate | Votes | % | ±% | |
---|---|---|---|---|---|
Labour | Jennifer Horne | 1,383 | 55.6 | ||
Labour | Richard Arthur | 1,377 | |||
Labour | Florence Parnell | 1,345 | |||
Conservative | Ian Galbraith | 1,105 | 44.4 | ||
Conservative | Colin Jaque | 1,077 | |||
Conservative | Horace Shooter | 1,069 | |||
Turnout | 27.8 | ||||
Labour gain from Conservative | Swing | ||||
Party | Candidate | Votes | % | ±% | |
---|---|---|---|---|---|
Labour | James Buckland | 2,971 | 69.0 | ||
Labour | Ivor Walker | 2,913 | |||
Labour | George Trevelyan | 2,909 | |||
Labour | Philip Turner | 2,864 | |||
Conservative | Leslie Langford | 970 | 22.5 | ||
Conservative | Michael Flynn | 959 | |||
Conservative | Philp Brandt | 942 | |||
Conservative | G. P. Sutherland | 919 | |||
Communist | Ann Sedley | 362 | 8.4 | ||
Turnout | 36.1 | ||||
Labour hold | Swing | ||||
Labour gain from Conservative | Swing | ||||
Party | Candidate | Votes | % | ±% | |
---|---|---|---|---|---|
Labour | Peter Jonas | 1,171 | 57.0 | ||
Labour | Derek Jarman | 1,154 | |||
Conservative | George Radford | 884 | 43.0 | ||
Conservative | Robert Targett | 800 | |||
Turnout | 37.8 | ||||
Labour gain from Conservative | Swing | ||||
Party | Candidate | Votes | % | ±% | |
---|---|---|---|---|---|
Labour | John Keohane | 1,137 | 47.4 | ||
Labour | Brian Loughran | 1,112 | |||
Conservative | Kenneth Graham | 475 | 27.9 | ||
Conservative | John Macdonald | 471 | |||
Communist | Ken Herbert | 90 | 5.3 | ||
Turnout | 46.5 | ||||
Labour gain from Conservative | Swing | ||||
Labour hold | Swing | ||||
Party | Candidate | Votes | % | ±% | |
---|---|---|---|---|---|
Labour | Millie Miller | 2,923 | 76.2 | ||
Labour | John Needham | 2,900 | |||
Labour | Roy Shaw | 2,830 | |||
Labour | Barry Peskin | 2,820 | |||
Conservative | George Paulley | 628 | 16.4 | ||
Conservative | Mary Quilliam | 611 | |||
Conservative | Anthony Boosey | 599 | |||
Conservative | Malcolm Heath | 595 | |||
Communist | Victor Heath | 287 | 7.5 | ||
Turnout | 35.8 | ||||
Labour hold | Swing | ||||
Party | Candidate | Votes | % | ±% | |
---|---|---|---|---|---|
Conservative | James Lemkin | 2,073 | |||
Conservative | Archie Macdonald | 2,071 | |||
Conservative | Harriet Greenaway | 2,064 | |||
Conservative | Arthur Roome* | 1,996 | |||
Labour | Alix Maxwell | 1,574 | |||
Labour | Roger Robinson | 1,537 | |||
Labour | Edwin Rhodes | 1,511 | |||
Labour | Keith Atkins | 1,501 | |||
Liberal | David Sacker | 360 | |||
Liberal | Bonamy Bradby | 337 | |||
Communist | Betty Tate | 258 | |||
Turnout | |||||
Conservative win (new seat) | |||||
Conservative win (new seat) |
Party | Candidate | Votes | % | ±% | |
---|---|---|---|---|---|
Conservative | Ronald Walker | 1,735 | 46.6 | ||
Labour | John Carrier | 1,724 | 46.3 | ||
Conservative | Christopher Fenwick | 1,715 | |||
Conservative | Denis Friis | 1,711 | |||
Labour | Jeanne Cox | 1,703 | |||
Labour | Bernard Miller | 1,656 | |||
Communist | Jean Davis | 262 | 7.0 | ||
Turnout | 46.9 | ||||
Conservative hold | Swing | ||||
Labour gain from Conservative | Swing | ||||
Conservative hold | Swing | ||||
Party | Candidate | Votes | % | ±% | |
---|---|---|---|---|---|
Labour | Clive Robinson | 1,559 | 62.2 | ||
Labour | Frank Dobson | 1,554 | |||
Conservative | John Barker | 949 | 37.8 | ||
Conservative | Kenneth Avery | 923 | |||
Turnout | 39.9 | ||||
Labour win (new seat) | |||||
Labour win (new seat) |
Party | Candidate | Votes | % | ±% | |
---|---|---|---|---|---|
Labour | Albert (Tim) Skinner | 2,263 | 67.4 | ||
Labour | Robert Humphreys | 2,241 | |||
Labour | Francis Rochford | 2,204 | |||
Conservative | Martin Guinness | 882 | 26.3 | ||
Conservative | Anthony Wright | 870 | |||
Conservative | Ian Tomisson | 868 | |||
Liberal | John Gibbs | 131 | 3.9 | ||
Liberal | Colin Brown | 122 | |||
Liberal | Violet Green | 119 | |||
Communist | Stella McEntire | 82 | 2.4 | ||
Turnout | 40.3 | ||||
Labour hold | Swing | ||||
Party | Candidate | Votes | % | ±% | |
---|---|---|---|---|---|
Labour | Lyndal Evans | 2,080 | 58.2 | ||
Labour | Joseph Jacob | 2,057 | |||
Labour | Michael Cendrowicz | 2,034 | |||
Labour | David Offenbach | 2,032 | |||
Conservative | Ian Clarke | 1,494 | 41.8 | ||
Conservative | John Glendinning | 1,481 | |||
Conservative | Edith Martin | 1,466 | |||
Conservative | Joy Burgess | 1,436 | |||
Turnout | 36.0 | ||||
Labour win (new seat) | |||||
Labour win (new seat) |
Party | Candidate | Votes | % | ±% | |
---|---|---|---|---|---|
Labour | Anthony Clarke | 2,170 | 65.4 | ||
Labour | Glyn Thomas | 2,085 | |||
Labour | Enid Wistrich | 2,067 | |||
Conservative | Irene Ellis | 1,019 | 30.7 | ||
Conservative | Ronald Raymond-Cox | 1,016 | |||
Conservative | Brian Hutchins | 1,007 | |||
Communist | Keith Ebbutt | 131 | 3.9 | ||
Turnout | 45.7 | ||||
Labour win (new seat) | |||||
Labour win (new seat) |
Party | Candidate | Votes | % | ±% | |
---|---|---|---|---|---|
Labour | Richard Collins | 2,766 | 67.8 | ||
Labour | Paddy O'Connor | 2,688 | |||
Labour | John Mills | 2,667 | |||
Labour | John Thane | 2,605 | |||
Conservative | Ernest Lee | 1,311 | 32.2 | ||
Conservative | Peter Briggs | 1,309 | |||
Conservative | Roger Gale | 1,298 | |||
Conservative | Marcelle Simpson | 1,294 | |||
Turnout | 40.1 | ||||
Labour win (new seat) | |||||
Labour win (new seat) |
Party | Candidate | Votes | % | ±% | |
---|---|---|---|---|---|
Labour | Corin Hughes-Stanton | 1,761 | 75.1 | ||
Labour | John Palmer | 1,743 | |||
Labour | Geoffrey Bindman | 1,695 | |||
Conservative | Alan Smith | 583 | 24.9 | ||
Conservative | Peter Bennett | 575 | |||
Conservative | Joan Couzens | 560 | |||
Turnout | 35.8 | ||||
Labour hold | Swing | ||||
Party | Candidate | Votes | % | ±% | |
---|---|---|---|---|---|
Labour | Brian Duggan | 2,357 | 88.4 | ||
Labour | Peter Best | 2,342 | |||
Labour | William Oakshott | 2,312 | |||
Conservative | Eric Bland | 310 | 11.6 | ||
Conservative | Carol Favell | 272 | |||
Conservative | Malcolm Watts | 266 | |||
Turnout | 32.2 | ||||
Labour win (new seat) | |||||
Labour win (new seat) |
Party | Candidate | Votes | % | ±% | |
---|---|---|---|---|---|
Labour | Tessa Jowell | 2,026 | 48.9 | ||
Labour | John Eidinow | 2,018 | |||
Labour | Arthur Soutter | 1,974 | |||
Labour | Ernest Wistrich | 1,893 | |||
Conservative | Ronald King | 1,804 | 43.5 | ||
Conservative | Phillippa Raymond-Cox | 1,792 | |||
Conservative | Christine Stewart-Munro | 1,787 | |||
Conservative | Sidney Torrance | 1,780 | |||
Liberal | Kay Peacock | 317 | 7.6 | ||
Liberal | Ray Benad | 298 | |||
Turnout | 38.8 | ||||
Labour win (new seat) | |||||
Labour win (new seat) |
Party | Candidate | Votes | % | ±% | |
---|---|---|---|---|---|
Conservative | Geoffrey Finsberg | 1,941 | 50.4 | ||
Labour | Brian Arnold | 1,914 | 49.6 | ||
Labour | Joan Hymans | 1,888 | |||
Labour | Derek Pollard | 1,880 | |||
Labour | Edwin Lichtenstein | 1,878 | |||
Conservative | Susan Ayliff | 1,852 | |||
Conservative | Christopher Turner | 1,841 | |||
Conservative | Gwyneth Williams | 1,833 | |||
Turnout | 36.8 | ||||
Conservative win (new seat) | |||||
Labour win (new seat) | |||||
Labour win (new seat) |
Barnet London Borough Council in London, England is elected every four years. Since the last boundary changes in 2002, 63 councillors have been elected from 21 wards.
The 
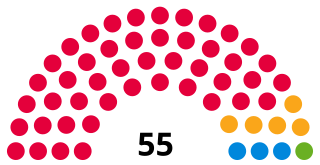
Camden London Borough Council in London, England is elected every four years. Since the last boundary changes in 2002, 54 councillors have been elected from 18 wards.
The 1998 Camden Borough Council election took place on 7 May 1998 to elect members of Camden London Borough Council in London, England. The whole council was up for election and the Labour Party stayed in overall control of the council.
Westminster City Council, the local authority of the City of Westminster in London, England, is elected every four years. Since the last boundary changes in 2002, 60 councillors have been elected from 20 wards. New boundary changes will come into effect for the 2022 elections, when the borough will be represented by 54 councillors in 18 three-member wards.
The London Borough of Camden is a London borough in Inner London. Camden Town Hall, on Euston Road, lies 1.4 mi (2.3 km) north of Charing Cross. The borough was established on 1 April 1965 from the area of the former boroughs of Hampstead, Holborn, and St Pancras, which prior to its establishment had comprised part of the historic County of London.
Camden London Borough Council is the local authority for the London Borough of Camden in Greater London, England. It is a London borough council, one of 32 in the United Kingdom capital of London. Camden is divided into 20 wards, each electing two or three councillors.
The 1994 Camden Council election took place on 5 May 1994 to elect members of Camden London Borough Council in London, England. The whole council was up for election. Labour stayed in overall control of the council, with both them and the Liberal Democrats making gains at the expense of the Conservatives in the north-west of the borough.
The 1990 Camden Council election took place on 3 May 1990 to elect members of Camden London Borough Council in London, England. The whole council was up for election. Labour comfortably stayed in overall control of the council, despite the Conservatives gaining three seats at their expense in Swiss Cottage. The Green Party came third in vote share with 13% of the vote, but won no seats.
The 1986 Camden Council election took place on 8 May 1986 to elect members of Camden London Borough Council in London, England. The whole council was up for election.
West Hampstead is a ward in the London Borough of Camden, in the United Kingdom. The ward was established for the May 2002 election. The population of this ward was 12,060 at the 2011 Census. In 2018, the ward had an electorate of 8,322. The Boundary Commission projects the electorate to rise to 8,926 by 2025.
Hampstead Town is a ward in the London Borough of Camden, in the United Kingdom. It covers most of Hampstead Village, the western half of Hampstead Heath, North End and the Vale of Health. The more residential Frognal ward covers much of the rest of Hampstead.
Swiss Cottage was a ward in the London Borough of Camden, in the United Kingdom. The ward was first created for the 1971 election, redrawn in 1978 and 2002, and abolished for the 2022 elections. The population of this ward at the 2011 Census was 12,900.
The 1982 Camden Council election took place on 6 May 1982 to elect members of Camden London Borough Council in London, England. The whole council was up for election.
The 1978 Camden Council election took place on 4 May 1978 to elect members of Camden London Borough Council in London, the United Kingdom. The whole council was up for election, using new ward boundaries, with one less councillor than had been elected at the 1974 election.
There were local government elections in London on Thursday 22 May 2014. All councillor seats on the 32 London borough councils were up for election. The electorates of Hackney, Lewisham, Newham and Tower Hamlets also elected their executive mayors, who operate in place of council leaders in those boroughs. Ward changes took place in Hackney, Kensington and Chelsea, and Tower Hamlets, which reduced the total number of councillors by 10 to 1,851. Both the mayoral and councillor elections are four-yearly.
Local government elections took place in London, and some other parts of the United Kingdom on Thursday 3 May 1990.
The 1964 Camden Council election took place on 7 May 1964 to elect members of Camden London Borough Council in London, England. The whole council was up for election and the Labour party gained control of the council.
The 1968 Camden Council election took place on 9 May 1968 to elect members of Camden London Borough Council in London, England. The whole council was up for election and the Conservative party gained overall control of the council.
The 1974 Camden Council election took place on 2 May 1974 to elect members of Camden London Borough Council in London, England. The whole council was up for election and the Labour party stayed in overall control of the council.
The 2022 Camden London Borough Council election took place on 5 May 2022. All 55 members of Camden London Borough Council were elected. The elections took place alongside local elections in the other London boroughs and elections to local authorities across the United Kingdom.