| |||||||||||||||||||||||||
| |||||||||||||||||||||||||
100 councillors 51 seats needed for a majority | |||||||||||||||||||||||||
---|---|---|---|---|---|---|---|---|---|---|---|---|---|---|---|---|---|---|---|---|---|---|---|---|---|
| |||||||||||||||||||||||||
|
The first election to the Greater London Council (GLC) was held on 9 April 1964.
The election happened at a time of very high political tension, with a general election due in a few months. The GLC did not come into its powers until 1 April 1965, but spent the first year setting up its committee structure and arranging with its predecessor authorities to take over.
New constituencies to be used for elections to Parliament and also for elections to the GLC had not yet been settled, so the London boroughs were used as multi-member 'first past the post' electoral areas. Westminster was joined with the City of London for this purpose. Each electoral area returned between 2 and 4 councillors.
The first election to the Greater London Council took place a month before the first election to the 32 London borough councils on 7 May 1964.
The Labour Party won a majority of seats at the election.
When the GLC was being planned, it was expected to produce Conservative majorities. [1] However, many suburban Conservative-voting areas had successfully campaigned to be excluded from the Greater London boundaries. [2]
The large constituencies where the winner took all exaggerated Labour's win in votes into a near two-to-one lead in terms of seats. It also made it extremely difficult for the Liberal Party to win any seats.
With an electorate of 5,466,756, there was a turnout of 44.2%. [3] [4] Labour did particularly well to win Bexley and Havering, but performed poorly in Enfield which they might have expected to win. In Tower Hamlets, the Communist Party of Great Britain came in as runners-up with 8% of the vote.
Party | Votes | Seats | ||||||
---|---|---|---|---|---|---|---|---|
Number | % | Stood | Seats | % | ||||
Labour | 1,063,390 | 44.6 | 100 | 64 | 64.0 | |||
Conservative | 956,543 | 40.1 | 100 | 36 | 36.0 | |||
Liberal | 238,967 | 10.0 | 86 | 0 | 0.0 | |||
Communist | 90,779 | 3.8 | 36 | 0 | 0.0 | |||
Independent | 19,983 | 0.9 | 9 | 0 | 0.0 | |||
Ratepayers | 5,858 | 0.3 | 3 | 0 | 0.0 | |||
Christian Independent | 2,895 | 0.1 | 1 | 0 | 0.0 | |||
New Liberal | 2,474 | 0.1 | 3 | 0 | 0.0 | |||
Union Movement | 2,353 | 0.1 | 2 | 0 | 0.0 | |||
In addition to the 100 councillors, there were sixteen aldermen elected by the council. The eight aldermen with the least votes were elected to serve until 1967 and the other eight until 1970. The aldermen were elected on 27 April 1964.
Aldermen elected in 1964, to retire in 1967:
Party | Alderman | |
---|---|---|
Labour | Charles James Christopher | |
Labour | Arthur George Edwards | |
Conservative | Andrew Jardine | |
Conservative | Albert George Knowlden | |
Labour | Terence Charles McMillan | |
Conservative | John Mason | |
Labour | Bernard Harry Rockman | |
Labour | Donald Soper [lower-alpha 1] |
Aldermen elected in 1964, to retire in 1970:
Party | Alderman | |
---|---|---|
Labour | Frank Banfield [lower-alpha 2] | |
Conservative | Francis Ernest Herman Bennett | |
Labour | Audrey Elizabeth Callaghan | |
Labour | Edward Cyril Castle | |
Labour | Alfred Frederick Joseph Chorley | |
Labour | Herbert Ferguson | |
Conservative | Leslie Freeman | |
Labour | Edgar Victor Garton |
The aldermen divided 11 to Labour and 5 to the Conservatives, and so the overall strength of the parties on the council was 75 Labour to 41 Conservatives after the aldermanic election.
Party | Candidate | Votes | % | ±% | |
---|---|---|---|---|---|
Labour | Charles Prendergast | 25,380 | |||
Labour | Maud Ball | 23,803 | |||
Conservative | R. C. Denney | 7,653 | |||
Conservative | C. A. Pool | 7,547 | |||
Liberal | Hubert Herbert Creemer Blake | 4,625 | |||
Liberal | J. D. Tyrrell | 3,824 | |||
Communist | K. Halpin | 1,385 | |||
Turnout | |||||
Labour win (new seat) | |||||
Labour win (new seat) |
Party | Candidate | Votes | % | ±% | |
---|---|---|---|---|---|
Conservative | Peter Blair Black | ||||
Conservative | Jean Leslie Scott | ||||
Conservative | Sir Joseph Henry Haygarth | ||||
Conservative | Reginald Marks | ||||
Labour | N Birch | ||||
Labour | Mrs BR Scharf | ||||
Labour | CHF Reynolds | ||||
Labour | FB Groves | ||||
Liberal | JW Webb | ||||
Liberal | J. Murray Medway | ||||
Liberal | Peter Hasler Billeness | ||||
Liberal | OC Williams | ||||
Communist | RT Gooding | ||||
Communist | JW Pinder | ||||
Turnout | 53.8 | ||||
Conservative win (new seat) | |||||
Conservative win (new seat) |
Party | Candidate | Votes | % | ±% | |
---|---|---|---|---|---|
Labour | Edwin Furness | 41,300 | |||
Labour | John Nicoll Powrie | 39,079 | |||
Labour | Robin Beauchamp Thompson | 37,314 | |||
Conservative | Douglas Melville Fielding | 33,958 | |||
Conservative | A. F. Cobbold | 33,906 | |||
Conservative | R. J. F. Monk | 31,939 | |||
Liberal | R. J. Marsh | 7,435 | |||
Liberal | R. H. A. Saunders | 6,770 | |||
Liberal | C. E. Wright | 5,991 | |||
Communist | L. H. Smith | 2,929 | |||
Turnout | |||||
Labour win (new seat) | |||||
Labour win (new seat) |
Party | Candidate | Votes | % | ±% | |
---|---|---|---|---|---|
Labour | Muriel Rose Forbes | 46,786 | |||
Labour | Peter Otwell | 46,307 | |||
Labour | Illtyd Harrington | 46,284 | |||
Labour | Frank Towell | 45,552 | |||
Conservative | Ruby Georgina Nancy Taylor | 38,500 | |||
Conservative | C. H. Ansted | 38,221 | |||
Conservative | H. J. C. Faulkner | 38,079 | |||
Conservative | Alfred Abram Berney | 37,892 | |||
Liberal | E. Baker | 11,180 | |||
Liberal | J. E. C. Perry | 10,727 | |||
Liberal | G. Phelps | 10,416 | |||
Liberal | M. R. Uziell-Hamilton | 8,029 | |||
Communist | M. E. Alcock | 3,574 | |||
Communist | L. G. Burt | 2,722 | |||
Turnout | |||||
Labour win (new seat) | |||||
Labour win (new seat) |
Party | Candidate | Votes | % | ±% | |
---|---|---|---|---|---|
Conservative | Edith Gordon Beecher-Bryant | ||||
Conservative | Victor Sidney Henry Mitchell | ||||
Conservative | Benita Dorothy Barham | ||||
Conservative | Robert Joseph Turner* | ||||
Labour | CJ Christopher | ||||
Labour | FFW Coates | ||||
Liberal | Michael Alan Minter | ||||
Liberal | Alfred Baldock Howard | ||||
Liberal | Nicholas Dudley Murdoch McGeorge | ||||
Labour | LM Moelwyn-Hughes | ||||
Labour | GH Warrack | ||||
Liberal | LD Ricketts | ||||
Communist | CL Coleman | ||||
Turnout | 54.5 | ||||
Conservative win (new seat) | |||||
Conservative win (new seat) |
Party | Candidate | Votes | % | ±% | |
---|---|---|---|---|---|
Labour | Leila Campbell | 38,198 | |||
Labour | Louis Wolfgang Bondy | 38,191 | |||
Labour | Evelyn Joyce Denington | 37,364 | |||
Conservative | F. E. H. Bennett | 30,096 | |||
Conservative | Lena Moncrieff Townsend | 28,723 | |||
Conservative | Isita Clare Mansel | 28,588 | |||
Liberal | A. J. F. Macdonald | 4,839 | |||
Liberal | J. M. Arram | 4,614 | |||
Liberal | M. S. Watson | 4,087 | |||
Communist | J. Nicolson | 2,875 | |||
Independent | B. W. Haines | 1,016 | |||
Turnout | |||||
Labour win (new seat) | |||||
Labour win (new seat) |
Party | Candidate | Votes | % | ±% | |
---|---|---|---|---|---|
Conservative | John Leonard Aston | ||||
Conservative | Geoffrey Weston Aplin | ||||
Conservative | Paul Alexander Saunders | ||||
Conservative | Keith Andrew Edwards | ||||
Labour | Arthur George Edwards | ||||
Labour | FT Cole | ||||
Labour | JA Clinch | ||||
Labour | S Sutcliffe | ||||
Liberal | Ronald E J Banks | ||||
Liberal | Mrs BM Bashford | ||||
Liberal | LG Pine | ||||
Liberal | RF Tapsell | ||||
Communist | M Rapaport | ||||
Independent | SB Stray | ||||
Independent | Jesse T. E. A. Waddell | ||||
Turnout | |||||
Conservative win (new seat) | |||||
Conservative win (new seat) |
Party | Candidate | Votes | % | ±% | |
---|---|---|---|---|---|
Labour | Peter Ernest Anderson | 50,949 | |||
Labour | Christopher Thomas Higgins | 49,655 | |||
Labour | George Francis Palmer | 49,304 | |||
Labour | Ethel Winifred Jones | 49,253 | |||
Conservative | Lady Henniker-Heaton | 45,688 | |||
Conservative | J. H. Ward | 43,971 | |||
Conservative | E. L. Prodham | 43,118 | |||
Conservative | R. F. Tovell | 42,894 | |||
Liberal | H. C. N. Baylis | 8,649 | |||
Liberal | J. E. Elsom | 8,272 | |||
Liberal | S. E. Smith | 7,448 | |||
Liberal | J. A. Sullivan | 7,299 | |||
Independent | J. McConville | 3,311 | |||
Communist | H. A. Tank | 3,137 | |||
Turnout | |||||
Labour win (new seat) | |||||
Labour win (new seat) |
Party | Candidate | Votes | % | ±% | |
---|---|---|---|---|---|
Conservative | Stanley Graham Rowlandson | 37,527 | |||
Conservative | Gordon Laurence Dixon | 37,284 | |||
Conservative | Thomas Broughton Mitcheson | 36,947 | |||
Labour | E. L. Mackenzie | 36,576 | |||
Labour | E. V. Gorton | 35,260 | |||
Labour | H. S. Newman | 34,906 | |||
Liberal | D. M. Gilbert | 11,240 | |||
Liberal | E. B. Pearce | 10,782 | |||
Liberal | R. F. Skinner | 10,599 | |||
Communist | R. A. Leeson | 2,449 | |||
Turnout | |||||
Conservative win (new seat) | |||||
Conservative win (new seat) |
Party | Candidate | Votes | % | ±% | |
---|---|---|---|---|---|
Labour | Julia Ada Johnson | 44,714 | |||
Labour | John William Andrews | 44,349 | |||
Labour | James Young | 42,621 | |||
Conservative | U. V. Lister | 25,358 | |||
Conservative | W. S. Manners | 25,104 | |||
Conservative | L. J. Smith | 24,851 | |||
Communist | E. Halpin | 3,786 | |||
Independent | H. H. Wright | 2,016 | |||
Turnout | |||||
Labour win (new seat) | |||||
Labour win (new seat) |
Party | Candidate | Votes | % | ±% | |
---|---|---|---|---|---|
Labour | Ellis Simon Hillman | 24,793 | |||
Labour | David Thomas Pitt | 24,281 | |||
Labour | Arthur Ernest Wicks | 24,037 | |||
Conservative | O. S. Henriques | 6,561 | |||
Conservative | W. J. Hawkins | 6,265 | |||
Conservative | A. M. White | 6,260 | |||
Liberal | R. B. James | 3,953 | |||
Liberal | T. Keen | 3,904 | |||
Liberal | T. D. Gates | 3,641 | |||
Communist | M. Goldman | 2,807 | |||
Turnout | |||||
Labour win (new seat) | |||||
Labour win (new seat) |
Party | Candidate | Votes | % | ±% | |
---|---|---|---|---|---|
Labour | Richard Clive Edmonds | 36,051 | |||
Labour | Marjorie Eleanor McIntosh | 35,406 | |||
Labour | Jane Phillips | 35,185 | |||
Conservative | John Stewart Collins | 21,135 | |||
Conservative | Ann McVicker Forbes-Cockell | 20,715 | |||
Conservative | J. Graham | 19,380 | |||
Liberal | C. M. Hildred-Goode | 2,055 | |||
Liberal | D. Webb | 1,966 | |||
Liberal | F. C. Scrivener | 1,892 | |||
Communist | P. T. Robson | 1,736 | |||
Labour win (new seat) | |||||
Labour win (new seat) |
Party | Candidate | Votes | % | ±% | |
---|---|---|---|---|---|
Labour | Annie Florence Remington | 39,698 | |||
Labour | Louis Albert Vitoria | 39,412 | |||
Labour | Gladys Felicia Dimson | 39,412 | |||
Conservative | A. G. Brown | 31,284 | |||
Conservative | H. H. Godwin-Monck | 30,849 | |||
Conservative | N. Muldoon | 30,177 | |||
Communist | E. L. Ramsay | 5,612 | |||
Labour win (new seat) | |||||
Labour win (new seat) |
Party | Candidate | Votes | % | ±% | |
---|---|---|---|---|---|
Conservative | Horace Walter Cutler | 37,895 | |||
Conservative | Oliver John Galley | 37,021 | |||
Conservative | William Emlyn Jones | 35,577 | |||
Labour | A. J. Lovell | 27,000 | |||
Labour | T. T. Swan | 25,995 | |||
Labour | A. R. Judge | 24,684 | |||
Liberal | M. D. Colne | 14,447 | |||
Liberal | D. F. Joyner | 13,333 | |||
Liberal | C. M. Hawkings | 13,151 | |||
Communist | R. A. Ward | 3,426 | |||
Turnout | |||||
Conservative win (new seat) | |||||
Conservative win (new seat) |
Party | Candidate | Votes | % | ±% | |
---|---|---|---|---|---|
Labour | William Geoffrey Fiske | 36,280 | |||
Labour | William Arthur Gillman | 34,915 | |||
Labour | Bertie Edwin Roycraft | 32,150 | |||
Conservative | N. L. Anfilogoff | 29,590 | |||
Conservative | Mrs E. H. Dean | 29,394 | |||
Conservative | E. T. Davies | 28,835 | |||
Liberal | D. M. Hardy | 11,705 | |||
Liberal | C. W. Brewster | 10,437 | |||
Liberal | G. M. Horey | 8,930 | |||
Communist | F. Barlow | 4,000 | |||
Turnout | |||||
Labour win (new seat) | |||||
Labour win (new seat) |
Party | Candidate | Votes | % | ±% | |
---|---|---|---|---|---|
Labour | William John Lipscombe | 34,728 | |||
Labour | Frank Herbert Rapley | 33,216 | |||
Labour | David John Davies | 32,898 | |||
Conservative | E. L. Ing | 32,091 | |||
Conservative | G. Corran | 32,072 | |||
Conservative | Leslie Freeman | 31,715 | |||
Liberal | S. H. Davidson | 7,299 | |||
Liberal | J. B. Leno | 7,112 | |||
Liberal | J. A. Friedlander | 6,545 | |||
Independent | T. H. Barnard | 5,020 | |||
Communist | F. Stanley | 3,240 | |||
Turnout | |||||
Labour win (new seat) | |||||
Labour win (new seat) |
Party | Candidate | Votes | % | ±% | |
---|---|---|---|---|---|
Labour | Jack Dunnett | 40,684 | |||
Labour | Ernest Kinghorn | 38,028 | |||
Labour | Frederick W. Powe | 36,860 | |||
Conservative | Geoffrey Chase-Gardener | 32,044 | |||
Conservative | Andrew Jardine | 31,281 | |||
Conservative | Dyas Cyril Loftus Usher | 29,426 | |||
Liberal | R. P. Power | 7,457 | |||
Liberal | G. C. Middleton | 7,084 | |||
Liberal | J. S. Probert | 6,062 | |||
Communist | F. Stanley | 2,077 | |||
Turnout | |||||
Labour win (new seat) | |||||
Labour win (new seat) |
Party | Candidate | Votes | % | ±% | |
---|---|---|---|---|---|
Labour | Edwin Bayliss | 31,077 | |||
Labour | Irene Chaplin | 30,165 | |||
Labour | Florence Evelyne Cayford | 30,107 | |||
Conservative | R. A. Baker | 8,152 | |||
Conservative | P. E. Postgate | 7,811 | |||
Conservative | A. Hardy | 7,380 | |||
New Liberal | F. C. Barrett | 2,922 | |||
Communist | J. F. Moss | 2,309 | |||
New Liberal | F. G. S. White | 2,292 | |||
Liberal | S. W. Applin | 2,290 | |||
New Liberal | A. E. Lomas | 2,207 | |||
Liberal | C. Simpson | 1,956 | |||
Liberal | A. F. Cook | 1,675 | |||
Independent | D. H. L. Chenappa | 659 | |||
Turnout | |||||
Labour win (new seat) | |||||
Labour win (new seat) |
Party | Candidate | Votes | % | ±% | |
---|---|---|---|---|---|
Conservative | Sir Percy Rugg | 34,683 | |||
Conservative | Robert Louis Vigars | 34,130 | |||
Conservative | Seton Forbes Cockell | 34,114 | |||
Labour | A. L. Grieves | 15,824 | |||
Labour | O. M. Wilson | 15,598 | |||
Labour | T. W. Ives | 15,001 | |||
Liberal | M. Neilson | 5,352 | |||
Liberal | P. C. Boucher | 5,060 | |||
Liberal | J. H. Crowhurst | 4,981 | |||
Communist | H. B. Collins | 2,153 | |||
Turnout | |||||
Conservative win (new seat) | |||||
Conservative win (new seat) |
Party | Candidate | Votes | % | ±% | |
---|---|---|---|---|---|
Conservative | Sydney William Leonard Ripley | 26,252 | |||
Conservative | Geoffrey John David Seaton | 25,868 | |||
Labour | E. K. Leggett | 16,411 | |||
Labour | C. Lesser | 16,068 | |||
Liberal | J. P. Farmer | 6,788 | |||
Liberal | A. M. Hollis | 6,705 | |||
Communist | D. E. Wilson | 1,039 | |||
Union Movement | A. J. C. Murray | 944 | |||
Turnout | |||||
Conservative win (new seat) | |||||
Conservative win (new seat) |
Party | Candidate | Votes | % | ±% | |
---|---|---|---|---|---|
Labour | Robert William George Humphreys | 46,240 | |||
Labour | Victor Mishcon | 46,056 | |||
Labour | Beatrice Serota | 45,492 | |||
Labour | Sidney Aubrey Melman | 45,125 | |||
Conservative | L. Iremonger | 37,812 | |||
Conservative | Gerard Folliott Vaughan | 37,358 | |||
Conservative | A. M. Tennant | 37,122 | |||
Conservative | I. N. Samuel | 37,057 | |||
Liberal | D. R. Chapman | 4,860 | |||
Liberal | W. B. Mattinson | 4,606 | |||
Liberal | J.H. Gardner | 4,451 | |||
Liberal | I. Shaw | 4,116 | |||
Communist | J. Lawrence | 2,416 | |||
Communist | T. Gorringe | 2,052 | |||
Independent | William George Boaks | 1,282 | |||
Independent | A. C. Osman | 1,103 | |||
Turnout | |||||
Labour win (new seat) | |||||
Labour win (new seat) |
Party | Candidate | Votes | % | ±% | |
---|---|---|---|---|---|
Turnout | |||||
Labour win (new seat) | |||||
Labour win (new seat) |
Party | Candidate | Votes | % | ±% | |
---|---|---|---|---|---|
Conservative | Thomas William Scott | 29,920 | |||
Conservative | Frederick William Walker | 29,895 | |||
Labour | C. M. Waugh | 28,752 | |||
Labour | J. T. Pyne | 27,108 | |||
Liberal | E. M. Morrison | 6,753 | |||
Liberal | J. S. Rowlinson | 6,676 | |||
Communist | S. E. French | 1,552 | |||
Union Movement | D. Wheeler | 1,409 | |||
Turnout | |||||
Conservative win (new seat) | |||||
Conservative win (new seat) |
Party | Candidate | Votes | % | ±% | |
---|---|---|---|---|---|
Labour | Samuel Boyce | 34,429 | |||
Labour | Edward Percy Bell | 33,568 | |||
Labour | Arthur Frank George Edwards | 30,674 | |||
Liberal | D. A. S. Brooke | 9,476 | |||
Conservative | C. A. Rugg | 7,616 | |||
Conservative | B. C. Balcomb | 7,155 | |||
Conservative | W. C. Willis | 6,717 | |||
Liberal | E. Johnson | 6,119 | |||
Liberal | R. A. Savill | 5,703 | |||
Communist | J. A. Walker | 2,757 | |||
Turnout | |||||
Labour win (new seat) | |||||
Labour win (new seat) |
Party | Candidate | Votes | % | ±% | |
---|---|---|---|---|---|
Conservative | Robert Mitchell | 37,601 | |||
Conservative | Francis Herbert James | 36,785 | |||
Conservative | Anne Sylvia Terry | 36,259 | |||
Labour | L. Fallaize | 24,463 | |||
Labour | A. F. J. Chorley | 23,205 | |||
Labour | A. E. O'Connor | 22,440 | |||
Liberal | G. S. Bellamy | 17,901 | |||
Liberal | K. H. N. Ives | 17,622 | |||
Liberal | D. F. Murphy | 17,487 | |||
Communist | P. J. Devine | 3,885 | |||
Turnout | |||||
Conservative win (new seat) | |||||
Conservative win (new seat) |
Party | Candidate | Votes | % | ±% | |
---|---|---|---|---|---|
Conservative | Frederick Denis Christian | 34,259 | |||
Conservative | Montague William Garrett | 34,029 | |||
Labour | G. H. Loman | 19,649 | |||
Labour | T. R. Starr | 19,557 | |||
Liberal | D. V. G. Feltham | 12,379 | |||
Liberal | L. Worth | 11,205 | |||
Communist | A. J. Banfield | 1,947 | |||
Conservative win (new seat) | |||||
Conservative win (new seat) |
Party | Candidate | Votes | % | ±% | |
---|---|---|---|---|---|
Labour | Reginald Eustace Goodwin | 49,518 | |||
Labour | Henry George Lamborn | 49,480 | |||
Labour | Edgar Ernest Reed | 48,471 | |||
Labour | Albert Edward Samuels | 47,177 | |||
Conservative | Toby Francis Henry Jessel | 18,333 | |||
Conservative | J. A. Prichard | 17,568 | |||
Conservative | A. P. R. Noble | 17,401 | |||
Conservative | J. G. L. M. Porter | 17,148 | |||
Communist | S. P. Bent | 4,311 | |||
Turnout | |||||
Labour win (new seat) | |||||
Labour win (new seat) |
Party | Candidate | Votes | % | ±% | |
---|---|---|---|---|---|
Conservative | George Frederick Everitt | 30,393 | |||
Conservative | Frederick William Thompson | 28,979 | |||
Labour | P. J. Bassett | 19,023 | |||
Labour | H. Ferguson | 18,129 | |||
Liberal | J. D. Ross | 7,548 | |||
Liberal | G. R. Watkin | 6,787 | |||
Communist | A. T. Goddard | 1,880 | |||
Turnout | |||||
Conservative win (new seat) | |||||
Conservative win (new seat) |
Party | Candidate | Votes | % | ±% | |
---|---|---|---|---|---|
Labour | John Patrick Branagan | 25,350 | |||
Labour | Ernest Ashley Bramall | 24,488 | |||
Communist | Solly Kaye | 2,618 | |||
Liberal | S. H. Woodham | 2,179 | |||
Liberal | J. W. Parton | 2,133 | |||
Conservative | A. J. Lawrence | 2,113 | |||
Conservative | B. Hawley | 1,959 | |||
Turnout | |||||
Labour win (new seat) | |||||
Labour win (new seat) |
Party | Candidate | Votes | % | ±% | |
---|---|---|---|---|---|
Labour | James Albert Edward Collins | 35,338 | |||
Labour | Betty Kathleen Lowton | 33,299 | |||
Labour | Mavis Joan Webster | 31,872 | |||
Conservative | M. J. Harvey | 22,980 | |||
Conservative | J. Gordon | 22,158 | |||
Conservative | G. W. Mason | 21,113 | |||
Ratepayers | W. J. Bowstead | 6,624 | |||
Liberal | J. M. Bishop | 5,995 | |||
Ratepayers | L. E. Norman | 5,557 | |||
Ratepayers | T. H. Oakman | 5,393 | |||
Liberal | W. T. Neilson-Hansen | 4,944 | |||
Liberal | W. V. E. Seymer | 4,748 | |||
Communist | D. J. Solomons | 1,289 | |||
Turnout | |||||
Labour win (new seat) | |||||
Labour win (new seat) |
Party | Candidate | Votes | % | ±% | |
---|---|---|---|---|---|
Labour | M. C. Jay | 53,747 | |||
Labour | Norman George Mollett Prichard | 52,606 | |||
Labour | George Frederick Rowe | 51,857 | |||
Labour | Joseph Simeon Samuels | 51,292 | |||
Conservative | M. Bowen | 37,459 | |||
Conservative | J. I. Tweedie-Smith | 37,292 | |||
Conservative | F. L. Abbott | 37,258 | |||
Conservative | D. Y. Fell | 36,776 | |||
Liberal | A. Cowen | 8,630 | |||
Liberal | R. A. Locke | 8,443 | |||
Liberal | M. E. Lawson | 7,897 | |||
Liberal | C. V. Gittins | 7,716 | |||
Communist | G. M. Easton | 3,116 | |||
Communist | D. J. Welsh | 2,143 | |||
Turnout | |||||
Labour win (new seat) | |||||
Labour win (new seat) |
Party | Candidate | Votes | % | ±% | |
---|---|---|---|---|---|
Conservative | Louis Halle Gluckstein | 40,109 | |||
Conservative | Harold Sebag-Montefiore | 39,856 | |||
Conservative | Samuel Isidore Salmon | 39,703 | |||
Conservative | Arthur Desmond Herne Plummer | 39,581 | |||
Labour | J. J. Curran | 25,735 | |||
Labour | H. E. Browne | 25,511 | |||
Labour | Countess Lucan | 25,136 | |||
Labour | B. C. G. Whitaker | 24,856 | |||
Liberal | Timothy Wentworth Beaumont | 4,996 | |||
Liberal | Richard Lord Afton | 4,405 | |||
Liberal | Arthur William Robert Capel | 4,112 | |||
Liberal | Lady Ruth Abrahams | 4,035 | |||
Communist | L. R. Temple | 1,758 | |||
Turnout | |||||
Conservative win (new seat) | |||||
Conservative win (new seat) |
Less than a month after the election, Marjorie McIntosh (Labour, Hammersmith) died and precipitated a byelection; however, given that the voters had elected the GLC and the new London boroughs, the parties were short of money and the Conservatives decided not to oppose the Labour candidate who was returned unopposed on 18 June. Oliver Galley (Conservative, Harrow, died in October 1965 and the Conservatives retained his seat at a byelection on 27 January 1966. [5] By the end of the term, there were two seats vacant due to the resignations of Sir Joseph Haygarth (Conservative, Barnet) and Mrs Mavis Webster (Labour, Waltham Forest).
There was one aldermanic by-election in 1965 caused by the resignation of Donald Soper (Labour). Frederick Lionel Tonge (Labour) was elected by the council on 6 July 1965, to serve until 1967.
The Greater London Council (GLC) was the top-tier local government administrative body for Greater London from 1965 to 1986. It replaced the earlier London County Council (LCC) which had covered a much smaller area. The GLC was dissolved in 1986 by the Local Government Act 1985 and its powers were devolved to the London boroughs and other entities. A new administrative body, known as the Greater London Authority (GLA), was established in 2000.
The second election to the Greater London Council was held on 13 April 1967, and saw the first Conservative victory for a London-wide authority since 1931.
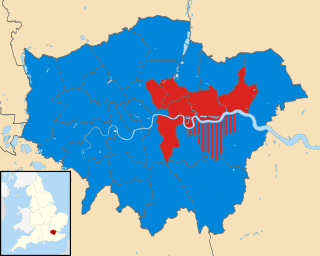
The third election to the Greater London Council was held on 9 April 1970 and saw a Conservative victory with a reduced majority.
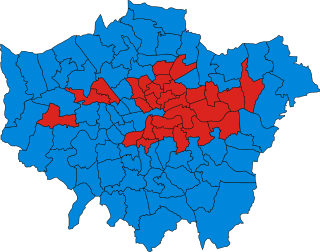
The fourth election to the Greater London Council (GLC) was held on 12 April 1973. Labour won a large majority of 58 seats to 32 for the Conservatives; the Liberals also won their first two seats on the council.
The fifth election to the Greater London Council (GLC) was held on 5 May 1977. The Conservatives, led by Horace Cutler, gained control of the council from Labour.
Westminster City Council is the local authority for the City of Westminster in Greater London, England. The city is divided into 20 wards, each electing three councillors. The council is currently composed of 31 Labour Party members and 23 Conservative Party members. The council was created by the London Government Act 1963 and replaced three local authorities: Paddington Metropolitan Borough Council, St Marylebone Metropolitan Borough Council and Westminster Borough Council.
The 1964 London local elections were held on 7 May 1964. They were the inaugural elections for the thirty-two London boroughs, which were created on 1 April 1965 by the London Government Act 1963. All seats were up for election, with polling stations open between 08:00 and 21:00.
Havering was an electoral division for the purposes of elections to the Greater London Council. The constituency elected three councillors for a three-year term in 1964, 1967 and 1970. Bill Fiske, the first leader of the Greater London Council, was elected from the division.
Harrow West was an electoral division for the purposes of elections to the Greater London Council. The constituency elected one councillor for a four-year term in 1973, 1977 and 1981, with the final term extended for an extra year ahead of the abolition of the Greater London Council.
Harrow Central was an electoral division for the purposes of elections to the Greater London Council. The constituency elected one councillor for a four-year term in 1973, 1977 and 1981, with the final term extended for an extra year ahead of the abolition of the Greater London Council.
Harrow East was an electoral division for the purposes of elections to the Greater London Council. The constituency elected one councillor for a four-year term in 1973, 1977 and 1981, with the final term extended for an extra year ahead of the abolition of the Greater London Council.
Camden was an electoral division for the purposes of elections to the Greater London Council. The constituency elected three councillors for a three-year term in 1964, 1967 and 1970.
Harrow was an electoral division for the purposes of elections to the Greater London Council. The constituency elected three councillors for a three-year term in 1964, 1967 and 1970.
Hammersmith was an electoral division for the purposes of elections to the Greater London Council. The constituency elected three councillors for a three-year term in 1964, 1967 and 1970.
Bexley was an electoral division for the purposes of elections to the Greater London Council. The constituency elected three councillors for a three-year term in 1964, 1967 and 1970.
Ealing was an electoral division for the purposes of elections to the Greater London Council. The constituency elected four councillors for a three-year term in 1964, 1967 and 1970.
Greenwich was an electoral division for the purposes of elections to the Greater London Council. The constituency elected three councillors for a three-year term in 1964, 1967 and 1970.
Haringey was an electoral division for the purposes of elections to the Greater London Council. The constituency elected three councillors for a three-year term in 1964, 1967 and 1970.
Hounslow was an electoral division for the purposes of elections to the Greater London Council. The constituency elected three councillors for a three-year term in 1964, 1967 and 1970.
Wandsworth was an electoral division for the purposes of elections to the Greater London Council. The constituency elected four councillors for a three-year term in 1964, 1967 and 1970.