![]() | |||||||||||||||||||||||||||||||||
| |||||||||||||||||||||||||||||||||
All 55 Havering London Borough Council seats 28 seats needed for a majority | |||||||||||||||||||||||||||||||||
---|---|---|---|---|---|---|---|---|---|---|---|---|---|---|---|---|---|---|---|---|---|---|---|---|---|---|---|---|---|---|---|---|---|
|
The 1968 Havering Council election took place on 9 May 1968 to elect members of Havering London Borough Council in London, England. The whole council was up for election and the Conservative Party gained overall control of the council for the first time.
The election was originally scheduled for 1967, but the term of members due to go out in 1967 was extended for one year to prevent the London borough council elections taking place in the same year as the Greater London Council election. [a] The election used the twenty wards from the previous election for a second time. Councillors were elected for three years with the next election scheduled for 1971.
Polling took place on 9 May 1968. [1]
Gaining nineteen seats, the Conservative Party won overall control of the council for the first time. The Labour Party lost twenty seats and was only able to hold on to seven councillors in the Heaton, Hilldene and Gooshays wards covering the Harold Hill estate. Nineteen seats went from Labour to the Conservatives. One of the three seats in Hylands ward went from Labour to the Independent Residents. Holding on to a further twelve seats in Cranham, Hacton, Rainham and Upminster, the Independent Residents became the second largest group on the council. [1] [2] [3]
Party | Seats | Gains | Losses | Net gain/loss | Seats % | Votes % | Votes | +/− | |
---|---|---|---|---|---|---|---|---|---|
Conservative | 35 | 19 | 0 | ![]() | 63.6 | 53.7 | 98,040 | ![]() | |
Ind. Residents | 13 | 1 | 0 | ![]() | 16.9 | 19.0 | 23,586 | ![]() | |
Labour | 7 | 0 | 20 | ![]() | 12.7 | 22.1 | 40,307 | ![]() | |
Liberal | 0 | 0 | 0 | ![]() | 0% | 3.7 | 6,800 | ![]() | |
Independent | 0 | 0 | 0 | ![]() | 0.0 | 0.9 | 1,594 | New | |
Communist | 0 | 0 | 0 | ![]() | 0.0 | 0.6 | 1,172 | ![]() |
In addition to the 55 elected councillors, there were nine aldermen on the council. Five aldermen elected in 1964 continued to serve until 1971 and the other four retired before the 1968 election. Four aldermen were elected by the council in 1968 to serve until 1974. All four aldermen were for the Conservative Party.
Aldermen elected in 1968, to retire in 1974: [4]
Party | Alderman | |
---|---|---|
Conservative | Evan Davies | |
Conservative | Sydney Legg | |
Conservative | Stanley Shute [b] | |
Conservative | John Whale |
The aldermen divided six to the Conservatives, two Independent and one to Labour after the aldermanic election.
Party | Candidate | Votes | % | ±% | |
---|---|---|---|---|---|
Conservative | Evan Davies | 2,013 | |||
Conservative | Stanley Shute | 1,998 | |||
Labour | H. Packham | 333 | |||
Labour | A. Mills | 321 | |||
Turnout | |||||
Conservative hold | Swing | ||||
Conservative hold | Swing |
Party | Candidate | Votes | % | ±% | |
---|---|---|---|---|---|
Conservative | L. Ellis | 1,849 | |||
Conservative | W. Falk | 1,807 | |||
Conservative | W. Whittingham | 1,754 | |||
Labour | A. Thomas | 799 | |||
Labour | J. Stevenson | 750 | |||
Labour | K. Olsen | 721 | |||
Communist | C. Harper | 214 | |||
Turnout | |||||
Conservative gain from Labour | Swing | ||||
Conservative gain from Labour | Swing |
Party | Candidate | Votes | % | ±% | |
---|---|---|---|---|---|
Conservative | J. Higgs | 2,146 | |||
Conservative | E. Joslin | 2,083 | |||
Conservative | D. Keery | 1,977 | |||
Labour | L. Mills | 1,265 | |||
Labour | W. Cole | 1,258 | |||
Labour | J. Selby | 1,200 | |||
Communist | H. Reeves | 188 | |||
Turnout | |||||
Conservative gain from Labour | Swing | ||||
Conservative gain from Labour | Swing |
Party | Candidate | Votes | % | ±% | |
---|---|---|---|---|---|
Ind. Residents | W. Topp | 2,653 | |||
Ind. Residents | J. Squire | 2,628 | |||
Ind. Residents | Louisa Sinclair | 2,606 | |||
Conservative | R. Baker | 1,781 | |||
Conservative | L. Bonner | 1,749 | |||
Conservative | D. Cranna | 1,749 | |||
Labour | S. Jack | 478 | |||
Labour | E. Goggin | 474 | |||
Labour | N. Plant | 471 | |||
Liberal | W. Wallace | 216 | |||
Liberal | P. Atkinson | 215 | |||
Turnout | |||||
Ind. Residents gain from Independent | Swing | ||||
Ind. Residents gain from Independent | Swing |
Party | Candidate | Votes | % | ±% | |
---|---|---|---|---|---|
Conservative | G. Bunch | 1,842 | |||
Conservative | B. Casey | 1,811 | |||
Conservative | N. Noyes | 1,804 | |||
Labour | J. Hoepelman | 1,244 | |||
Labour | Stanley Heath-Coleman | 1,240 | |||
Labour | G. Rowlands | 1,189 | |||
Liberal | I. Draper | 322 | |||
Liberal | S. Golledge | 300 | |||
Liberal | R. Barwick | 290 | |||
Communist | V. Faversham | 161 | |||
Turnout | |||||
Conservative gain from Labour | Swing | ||||
Conservative gain from Labour | Swing |
Party | Candidate | Votes | % | ±% | |
---|---|---|---|---|---|
Conservative | R. Carnaby | 3,446 | |||
Conservative | E. Gallant | 3,392 | |||
Conservative | N. Kemble | 3,313 | |||
Liberal | P. Ratchford | 643 | |||
Liberal | J. Bastick | 614 | |||
Labour | B. Whitworth | 465 | |||
Labour | A. Mais | 439 | |||
Labour | R. Whitworth | 435 | |||
Turnout | |||||
Conservative hold | Swing | ||||
Conservative hold | Swing |
Party | Candidate | Votes | % | ±% | |
---|---|---|---|---|---|
Conservative | R. Clark | 2,108 | |||
Conservative | J. Johnston | 2,069 | |||
Independent | F. Chatfield | 213 | |||
Independent | L. Robertson | 206 | |||
Labour | A. Houghton | 174 | |||
Labour | A. Miles | 164 | |||
Turnout | |||||
Conservative hold | Swing | ||||
Conservative hold | Swing |
Party | Candidate | Votes | % | ±% | |
---|---|---|---|---|---|
Labour | Frank Coffin | 1,424 | |||
Labour | Reta Coffin | 1,367 | |||
Labour | I. Barber | 1,251 | |||
Conservative | H. Jefferies | 795 | |||
Conservative | C. Mawson | 795 | |||
Conservative | T. Rowswell | 766 | |||
Communist | W. French | 160 | |||
Turnout | |||||
Labour hold | Swing | ||||
Labour hold | Swing |
Party | Candidate | Votes | % | ±% | |
---|---|---|---|---|---|
Ind. Residents | N. Miles | 1,621 | |||
Ind. Residents | A. Davis | 1,591 | |||
Ind. Residents | N. Richards | 1,482 | |||
Conservative | L. Klein | 1,376 | |||
Conservative | S. New | 1,351 | |||
Conservative | S. Johnson | 1,332 | |||
Labour | A. Connor | 611 | |||
Labour | C. Connor | 608 | |||
Labour | V. Belcher | 554 | |||
Turnout | |||||
Ind. Residents gain from Independent | Swing | ||||
Ind. Residents gain from Independent | Swing |
Party | Candidate | Votes | % | ±% | |
---|---|---|---|---|---|
Conservative | J. Smith | 2,789 | |||
Conservative | J. Frost | 2,715 | |||
Conservative | D. Owen | 2,659 | |||
Labour | D. Edwards | 1,005 | |||
Labour | G. Otter | 939 | |||
Labour | R. Smith | 818 | |||
Liberal | A. Stubbs | 460 | |||
Liberal | M. Chambers | 416 | |||
Turnout | |||||
Conservative hold | Swing | ||||
Conservative hold | Swing |
Party | Candidate | Votes | % | ±% | |
---|---|---|---|---|---|
Conservative | W. Smith | 3,441 | |||
Conservative | L. Hutton | 3,406 | |||
Conservative | K. Brown | 3,394 | |||
Independent | E. Bates | 557 | |||
Labour | W. Mills | 384 | |||
Labour | J. Holt | 355 | |||
Labour | S. Horler | 337 | |||
Turnout | |||||
Conservative hold | Swing | ||||
Conservative hold | Swing |
Party | Candidate | Votes | % | ±% | |
---|---|---|---|---|---|
Labour | Michael Ward | 955 | |||
Labour | D. Burn | 922 | |||
Conservative | C. Kemp | 709 | |||
Conservative | D. Cure | 683 | |||
Turnout | |||||
Labour hold | Swing | ||||
Labour hold | Swing |
Party | Candidate | Votes | % | ±% | |
---|---|---|---|---|---|
Labour | Arthur Latham | 1,088 | |||
Labour | Reg Whiting | 1,049 | |||
Conservative | P. Marsden | 572 | |||
Conservative | J. Barrance | 519 | |||
Communist | R. Cohen | 104 | |||
Turnout | |||||
Labour hold | Swing | ||||
Labour hold | Swing |
Party | Candidate | Votes | % | ±% | |
---|---|---|---|---|---|
Ind. Residents | R. Reid | 1,370 | |||
Conservative | T. Kemp | 1,362 | |||
Conservative | G. Panormo | 1,335 | |||
Ind. Residents | T. Dix | 1,316 | |||
Ind. Residents | D. Worker | 1,278 | |||
Conservative | B. Dawson | 1,265 | |||
Labour | E. Watson | 884 | |||
Labour | W. Hegarty | 862 | |||
Labour | K. Ince | 818 | |||
Turnout | |||||
Ind. Residents gain from Labour | Swing | ||||
Conservative gain from Labour | Swing | ||||
Conservative gain from Labour | Swing |
Party | Candidate | Votes | % | ±% | |
---|---|---|---|---|---|
Conservative | J. Lucas | 2,199 | |||
Conservative | I. Harlock | 2,131 | |||
Conservative | A. Sharp | 2,119 | |||
Labour | R. Latham | 1,030 | |||
Labour | F. Carrick | 935 | |||
Labour | R. Kilby | 885 | |||
Communist | C. Bacon | 170 | |||
Turnout | |||||
Conservative gain from Labour | Swing | ||||
Conservative gain from Labour | Swing |
Party | Candidate | Votes | % | ±% | |
---|---|---|---|---|---|
Conservative | S. Swift | 1,189 | |||
Conservative | W. Todd | 1,131 | |||
Labour | R. Baker | 558 | |||
Labour | T. Ward | 540 | |||
Turnout | |||||
Conservative gain from Labour | Swing | ||||
Conservative gain from Labour | Swing |
Party | Candidate | Votes | % | ±% | |
---|---|---|---|---|---|
Ind. Residents | H. Turner | 2,683 | |||
Ind. Residents | D. Poole | 2,643 | |||
Ind. Residents | L. Waterman | 2,504 | |||
Conservative | I. Lamont | 823 | |||
Labour | H. Bygate | 591 | |||
Labour | E. O'Donnell | 578 | |||
Labour | A. Bowers | 575 | |||
Communist | T. Stapleton | 175 | |||
Turnout | |||||
Ind. Residents gain from Independent | Swing | ||||
Ind. Residents gain from Independent | Swing |
Party | Candidate | Votes | % | ±% | |
---|---|---|---|---|---|
Conservative | Sydney Legg | 2,716 | |||
Conservative | Edward Hoad | 2,685 | |||
Conservative | Albert James | 2,609 | |||
Liberal | B. Grant | 544 | |||
Liberal | M. Reeve | 542 | |||
Liberal | T. Rimmer | 531 | |||
Labour | G. Dodge | 481 | |||
Labour | G. Saunders | 477 | |||
Labour | D. Ramstead | 462 | |||
Turnout | |||||
Conservative hold | Swing | ||||
Conservative hold | Swing |
Party | Candidate | Votes | % | ±% | |
---|---|---|---|---|---|
Conservative | J. Collins | 1,095 | |||
Conservative | J. Smith | 1,092 | |||
Conservative | C. Sherman | 1,090 | |||
Labour | P. Ridley | 993 | |||
Labour | May Rudlin | 964 | |||
Ind. Residents | G. Reynolds | 912 | |||
Labour | A. Lesslie | 895 | |||
Ind. Residents | F. Banning | 738 | |||
Ind. Residents | R. Vickers | 735 | |||
Independent | L. Lowe | 323 | |||
Independent | L. Long | 295 | |||
Liberal | L. Blows | 207 | |||
Liberal | F. Tyson | 182 | |||
Liberal | J. South | 175 | |||
Turnout | |||||
Conservative gain from Labour | Swing | ||||
Conservative gain from Labour | Swing |
Party | Candidate | Votes | % | ±% | |
---|---|---|---|---|---|
Ind. Residents | F. Everett | 2,631 | |||
Ind. Residents | R. Manning | 2,603 | |||
Ind. Residents | F. Morley | 2,592 | |||
Conservative | O. Collins | 1,755 | |||
Conservative | P. Ellis | 1,728 | |||
Conservative | R. Guest | 1,723 | |||
Labour | W. Mansfield | 264 | |||
Labour | H. Sparks | 216 | |||
Labour | A. Booton | 212 | |||
Liberal | A. Rabone | 167 | |||
Liberal | B. Thame | 162 | |||
Liberal | G. Burnett | 153 | |||
Turnout | |||||
Ind. Residents gain from Independent | Swing | ||||
Ind. Residents gain from Independent | Swing |
The following by-elections took place between the 1968 and 1971 elections:
The first election to the Greater London Council (GLC) was held on 9 April 1964.
The second election to the Greater London Council was held on 13 April 1967, and saw the first Conservative victory for a London-wide authority since 1931.
Sheffield City Council elections usually take place by thirds, three years out of every four. Sheffield City Council is the local authority for the metropolitan borough of Sheffield in South Yorkshire, England. Each of Sheffield's 28 wards is represented by three positions on the council, meaning there are usually 28 seats contested in each local election. 1967, 1973, 2004 and 2016 saw new ward boundaries and therefore all seats were contested.
Camden London Borough Council in London, England is elected every four years. Since the last boundary changes in 2022, 55 councillors have been elected from 20 wards.
Arthur Charles Latham was a British Labour Party politician, who was the MP for Paddington North from 1969 to 1974, and its successor seat, Paddington, from that year until 1979.
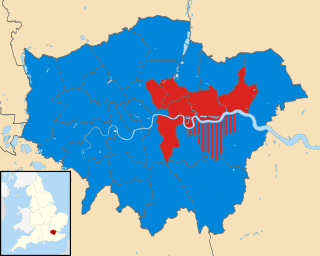
Havering London Borough Council in London, England is elected every four years. Since the last boundary changes in 2022, 55 councillors have been elected from 20 wards.
St Andrew's is an electoral ward in the London Borough of Havering. The ward has existed since the creation of the borough on 1 April 1965 and was first used in the 1964 elections. It returns three councillors to Havering London Borough Council.
The 1964 Barnet Council election took place on 7 May 1964 to elect members of Barnet London Borough Council in London, England. The whole council was up for election and the Conservative party gained control of the council.
The 1964 Barking Borough Council election took place on 7 May 1964 to elect members of Barking London Borough Council in London, England. The whole council was up for election and the Labour Party gained control of the council.
The 1964 Camden Council election took place on 7 May 1964 to elect members of Camden London Borough Council in London, England. The whole council was up for election and the Labour Party gained control of the council.
The 1964 Hammersmith Council election took place on 7 May 1964 to elect members of Hammersmith London Borough Council in London, England. The whole council was up for election and the Labour party gained control of the council with almost 63% of the vote.
The 1964 Havering Council election took place on 7 May 1964 to elect members of Havering London Borough Council in London, England. The whole council was up for election and the council went into no overall control.
The 1971 Havering Council election took place on 13 May 1971 to elect members of Havering London Borough Council in London, England. The whole council was up for election and the Labour Party gained overall control of the council.
The 1974 Havering Council election took place on 2 May 1974 to elect members of Havering London Borough Council in London, England. The whole council was up for election and the council went in no overall control.
The 1986 Havering Council election took place on 8 May 1986 to elect members of Havering London Borough Council in London, England. The whole council was up for election and the council went in no overall control.
The 1982 Havering Council election took place on 6 May 1982 to elect members of Havering London Borough Council in London, England. The whole council was up for election and the Conservative Party stayed in overall control of the council.
The 1978 Havering Council election took place on 4 May 1978 to elect members of Havering London Borough Council in London, England. The whole council was up for election and the Conservative Party gained overall control of the council for the second time.
Elections for the London Borough of Merton were held on 4 May 1978 to elect members of Merton London Borough Council in London, England. This was on the same day as other local elections in England and Scotland.
The 1967 Cardiff City Council election was held on Thursday 11 May 1967 to elect councillors to Cardiff City Council in Cardiff, Glamorgan, Wales. It took place on the same day as several other county borough elections in Wales and England.
The 2022 Havering London Borough Council election was held on 5 May 2022 to elect all 55 members of Havering London Borough Council. The elections took place alongside local elections in the other London boroughs and elections to local authorities across the United Kingdom.