| ||||||||||||||||||||||||||||||||||
All 59 seats to Camden Borough Council 30 seats needed for a majority | ||||||||||||||||||||||||||||||||||
---|---|---|---|---|---|---|---|---|---|---|---|---|---|---|---|---|---|---|---|---|---|---|---|---|---|---|---|---|---|---|---|---|---|---|
| ||||||||||||||||||||||||||||||||||
![]() Map of the results of the 1978 election to Camden London Borough Council. Labour in red, Conservatives in blue. | ||||||||||||||||||||||||||||||||||
|
The 1978 Camden Council election took place on 4 May 1978 to elect members of Camden London Borough Council in London, the United Kingdom. The whole council was up for election, using new ward boundaries, with one less councillor than had been elected at the 1974 election.
Labour were re-elected with an outright majority, but the Conservatives made gains across the borough, after losing heavily in the 1971 and 1974 elections. The Conservatives gained from Labour three seats in the southern Holborn and St Pancras South parliamentary constituency and eleven in the north (three in the Highgate ward and eight across the Hampstead parliamentary constituency).
Party | Seats | Gains | Losses | Net gain/loss | Seats % | Votes % | Votes | +/− | |
---|---|---|---|---|---|---|---|---|---|
Labour | 33 | −15 | 54.2 | 47.8 | 28,482 | ||||
Conservative | 26 | +14 | 45.8 | 45.2 | 26,895 | ||||
Liberal | 0 | 0 | 0.0 | 4.1 | 2,454 | ||||
Others | 0 | 0 | 0.0 | 2.9 | 1,707 | ||||
Party | Candidate | Votes | % | ±% | |
---|---|---|---|---|---|
Conservative | Julian Tobin | 1,825 | |||
Conservative | Donald Degerdon | 1,793 | |||
Conservative | Graham Hirschfield | 1,749 | |||
Labour | Peter Gresham | 1,223 | |||
Labour | Nova Gresham | 1,208 | |||
Labour | Nirmal Roy | 1,133 | |||
Liberal | Jacqueline Kelly | 224 | |||
Liberal | Nicholas Collins | 204 | |||
Liberal | Kwamina Sackey | 169 | |||
Turnout | |||||
Conservative win (new seat) | |||||
Conservative win (new seat) |
Party | Candidate | Votes | % | ±% | |
---|---|---|---|---|---|
Conservative | Anthony Beaton | 1,712 | |||
Conservative | Tony Kerpel | 1,667 | |||
Conservative | Michael Brahams | 1,641 | |||
Labour | Roy Mathias | 981 | |||
Labour | Arthur Soutter | 979 | |||
Labour | Verghese Varkki | 924 | |||
Liberal | Anne Box | 306 | |||
Liberal | Hilary Hawkins | 275 | |||
Turnout | |||||
Conservative win (new seat) | |||||
Conservative win (new seat) |
Party | Candidate | Votes | % | ±% | |
---|---|---|---|---|---|
Labour | Martin McNeill | 1,494 | |||
Conservative | David Harris | 1,399 | |||
Labour | John Thane | 1,385 | |||
Labour | Glyn Thomas | 1,373 | |||
Conservative | Christopher Radmore | 1,355 | |||
Conservative | David Stone | 1,310 | |||
Turnout | |||||
Labour win (new seat) | |||||
Conservative win (new seat) | |||||
Labour win (new seat) |
Party | Candidate | Votes | % | ±% | |
---|---|---|---|---|---|
Conservative | Kenneth Avery | 1,131 | |||
Conservative | Andre Potier | 1,017 | |||
Labour | Ricardo de Freitas | 1,015 | |||
Labour | David Offenbach | 966 | |||
Turnout | |||||
Conservative win (new seat) | |||||
Conservative win (new seat) |
Party | Candidate | Votes | % | ±% | |
---|---|---|---|---|---|
Labour | Anne Robertson | 852 | |||
Labour | Ivor Walker | 775 | |||
Conservative | David Coleman | 496 | |||
Conservative | Ronald Sears | 440 | |||
National Front | John Philpot | 59 | |||
National Front | Esther Sizer | 54 | |||
Turnout | |||||
Labour win (new seat) | |||||
Labour win (new seat) |
Party | Candidate | Votes | % | ±% | |
---|---|---|---|---|---|
Labour | John Tysoe | 1,000 | |||
Labour | John Lipetz | 996 | |||
Conservative | Thomas Crawford | 439 | |||
Conservative | Denis Friis | 406 | |||
National Front | Gordon Callow | 76 | |||
National Front | Malcolm Keith | 66 | |||
Turnout | |||||
Labour win (new seat) | |||||
Labour win (new seat) |
Party | Candidate | Votes | % | ±% | |
---|---|---|---|---|---|
Labour | Nick Bosanquet | 1,289 | |||
Labour | Phil Turner | 1,120 | |||
Conservative | Lilian O'Callaghan | 721 | |||
Conservative | Morag Valentine | 718 | |||
National Front | Michael Harkins | 117 | |||
National Front | Bernard Robinson | 108 | |||
Communist | Elizabeth Harrison | 100 | |||
Turnout | |||||
Labour win (new seat) | |||||
Labour win (new seat) |
Party | Candidate | Votes | % | ±% | |
---|---|---|---|---|---|
Labour | Jonathan Sofer | 1,336 | |||
Labour | Derek Jarman | 1,223 | |||
Conservative | Anthony Blackburn | 1,089 | |||
Conservative | Peter White | 1,013 | |||
Turnout | |||||
Labour win (new seat) | |||||
Labour win (new seat) |
Party | Candidate | Votes | % | ±% | |
---|---|---|---|---|---|
Conservative | Ronald King | 994 | |||
Conservative | John Athisayam | 920* | |||
Labour | John St. John | 485 | |||
Labour | Peter David | 477 | |||
Liberal | Olive Paynton | 193 | |||
Turnout | |||||
Conservative win (new seat) | |||||
Conservative win (new seat) |
Party | Candidate | Votes | % | ±% | |
---|---|---|---|---|---|
Conservative | Richard Almond | 1,055 | |||
Conservative | John Steel | 1,010 | |||
Labour | Haydn Gott | 852 | |||
Labour | Robert Hale | 788 | |||
Liberal | Clive Agran | 203 | |||
Liberal | Bryan Karet | 180 | |||
National Front | Paul Kavanagh | 37 | |||
National Front | Carol Warren | 31 | |||
Turnout | |||||
Conservative win (new seat) | |||||
Conservative win (new seat) |
Party | Candidate | Votes | % | ±% | |
---|---|---|---|---|---|
Conservative | Alan Greengross | 1,363 | |||
Conservative | Julian Harrison | 1,319 | |||
Labour | Alan Yates | 481 | |||
Labour | Richard Wigley | 453 | |||
Liberal | Brian Sugden | 258 | |||
Turnout | |||||
Conservative win (new seat) | |||||
Conservative win (new seat) |
Party | Candidate | Votes | % | ±% | |
---|---|---|---|---|---|
Labour | Ronald Hefferman | 1,125 | |||
Labour | Tessa Jowell | 1,059 | |||
Conservative | Peter Barber | 546 | |||
Conservative | Anthony Earl-Williams | 523 | |||
Communist | Kenneth Herbert | 102 | |||
Turnout | |||||
Labour win (new seat) | |||||
Labour win (new seat) |
Party | Candidate | Votes | % | ±% | |
---|---|---|---|---|---|
Labour | Christopher Gardiner | 1,058 | |||
Labour | Roy Shaw | 1,049 | |||
Conservative | David Roberts | 455 | |||
Conservative | John Martin | 454 | |||
National Front | Linda Evans | 71 | |||
National Front | Ian Tomkins | 56 | |||
Workers Revolutionary | Granville Jones | 37 | |||
Turnout | |||||
Labour win (new seat) | |||||
Labour win (new seat) |
Party | Candidate | Votes | % | ±% | |
---|---|---|---|---|---|
Conservative | Ian Tommison | 1,251 | |||
Conservative | Gwyneth Williams | 1,234 | |||
Labour | Philip Grenall | 647 | |||
Labour | David Bookless | 628 | |||
Liberal | Nigel Barnes | 297 | |||
Save London Alliance | Anthony Diamond | 61 | |||
Turnout | |||||
Conservative win (new seat) | |||||
Conservative win (new seat) |
Party | Candidate | Votes | % | ±% | |
---|---|---|---|---|---|
Conservative | Martin Morton | 2,026 | |||
Conservative | Roger James | 1,961 | |||
Conservative | Derek Spencer | 1,966 | |||
Labour | Walter Burgess | 1,809 | |||
Labour | David Webster | 1,787 | |||
Labour | Albert Crouch | 1,774 | |||
Communist | Margaret Lee | 194 | |||
Turnout | |||||
Conservative win (new seat) | |||||
Conservative win (new seat) |
Party | Candidate | Votes | % | ±% | |
---|---|---|---|---|---|
Labour | Derek Godfrey | 1,234 | |||
Labour | Julian Fulbrook | 1,224 | |||
Conservative | Edith Martin | 1,080 | |||
Conservative | Brian Rathbone | 1,080 | |||
Turnout | |||||
Labour win (new seat) | |||||
Labour win (new seat) |
Party | Candidate | Votes | % | ±% | |
---|---|---|---|---|---|
Labour | Patrick Driscoll | 1,242 | |||
Labour | Neil Fletcher | 1,214 | |||
Labour | Ken Livingstone | 1,198 | |||
Conservative | Peter Bolton | 999 | |||
Conservative | Ann McMullen | 983 | |||
Conservative | Ronald Rees | 980 | |||
Independent Labour | Francis Rochford | 496 | |||
Independent Labour | Albert Skinner | 442 | |||
Liberal | Richard Waddington | 155 | |||
Liberal | John Billouin | 141 | |||
Liberal | Catherine Wilson | 128 | |||
Turnout | |||||
Labour win (new seat) | |||||
Labour win (new seat) |
Party | Candidate | Votes | % | ±% | |
---|---|---|---|---|---|
Labour | Anthony Craig | 840 | |||
Labour | Roderick Cordara | 812 | |||
Conservative | John Glendinning | 777 | |||
Conservative | Aileen Griffith | 758 | |||
Communist | Patricia Langton | 48 | |||
Workers Revolutionary | Margaret Obank | 40 | |||
Turnout | |||||
Labour win (new seat) | |||||
Labour win (new seat) |
Party | Candidate | Votes | % | ±% | |
---|---|---|---|---|---|
Labour | William Budd | 1,211 | |||
Labour | Margaret Bowman | 1,184 | |||
Conservative | Iain Horsburgh | 903 | |||
Conservative | Richard Smith | 902 | |||
Liberal | Patrick Cooney | 91 | |||
Liberal | Alastair Seaton | 80 | |||
Communist | Alan Thomas | 51 | |||
Turnout | |||||
Labour win (new seat) | |||||
Labour win (new seat) |
Party | Candidate | Votes | % | ±% | |
---|---|---|---|---|---|
Labour | John Mills | 1,714 | |||
Labour | Florence Parnell | 1,699 | |||
Labour | Andrew Bethell | 1,685 | |||
Conservative | Laurence Atlas | 1,551 | |||
Conservative | Ian Parsley-Taylor | 1,522 | |||
Conservative | Catherine Mallison | 1,510 | |||
National Front | Sydney Daly | 145 | |||
National Front | Gwendoline Evans | 129 | |||
National Front | Martin Moloney | 127 | |||
Turnout | |||||
Labour win (new seat) | |||||
Labour win (new seat) |
Party | Candidate | Votes | % | ±% | |
---|---|---|---|---|---|
Labour | Sarah Peltier | 1,187 | |||
Labour | Maureen Robinson | 1,170 | |||
Conservative | Paul Brandt | 546 | |||
Conservative | Roland Walker | 536 | |||
Turnout | |||||
Labour win (new seat) | |||||
Labour win (new seat) |
Party | Candidate | Votes | % | ±% | |
---|---|---|---|---|---|
Labour | Michael Morrissey | 1,024 | |||
Labour | Joan Hymans | 1,005 | |||
Conservative | Anthony Cheverton | 386 | |||
Conservative | Catherine O'Sullivan | 362 | |||
National Front | John Haines | 79 | |||
National Front | John Warren | 61 | |||
Communist | Jeffrey Sawtell | 39 | |||
Turnout | |||||
Labour win (new seat) | |||||
Labour win (new seat) |
Party | Candidate | Votes | % | ±% | |
---|---|---|---|---|---|
Labour | Brian Duggan | 1,095 | |||
Labour | Thomas Devine | 1,093 | |||
Conservative | Jacqueline Austin | 443 | |||
Conservative | Noel Moncaster | 399 | |||
National Front | Andrew Cordier | 73 | |||
National Front | Andrew Kimber | 59 | |||
Turnout | |||||
Labour win (new seat) | |||||
Labour win (new seat) |
Party | Candidate | Votes | % | ±% | |
---|---|---|---|---|---|
Conservative | Anthony Kemp | 1,107 | |||
Conservative | Anthony Robinson | 1,081 | |||
Labour | Michael Boye-Anawomah | 1,007 | |||
Labour | John Chanin | 969 | |||
Liberal | Robert Pellegrinetti | 215 | |||
Communist | Hubert Bevan | 98 | |||
Turnout | |||||
Conservative win (new seat) | |||||
Conservative win (new seat) |
Party | Candidate | Votes | % | ±% | |
---|---|---|---|---|---|
Conservative | David Osborne | 1,648 | |||
Conservative | Michael Flynn | 1,633 | |||
Conservative | Brian Stoner | 1,602 | |||
Labour | Christopher Heginbotham | 1,343 | |||
Labour | Enyd Norman | 1,326 | |||
Labour | Denis MacShane | 1,274 | |||
Liberal | Andrew Bridgwater | 297 | |||
Liberal | Jillian Newbrook | 292 | |||
Liberal | Janet Heller | 291 | |||
Turnout | |||||
Conservative win (new seat) | |||||
Conservative win (new seat) |
Party | Candidate | Votes | % | ±% | |
---|---|---|---|---|---|
Conservative | Neil Bourhill | 953 | |||
Labour | Kevin Gould | 938 | |||
Conservative | Cathleen Mainds | 911 | |||
Labour | Sandra Wynn | 896 | |||
Liberal | Ida Linfield | 215 | |||
Liberal | Martin Biermann | 209 | |||
Turnout | |||||
Conservative win (new seat) | |||||
Labour win (new seat) |
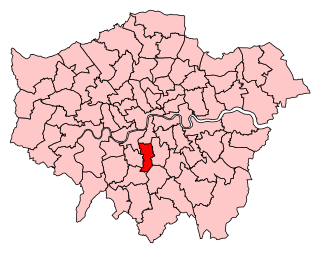
Holborn and St Pancras is a parliamentary constituency in Greater London that was created in 1983. It has been represented in the House of Commons of the Parliament of the United Kingdom since 2015 by Sir Keir Starmer, the Prime Minister since 2024 and Leader of the Labour Party since 2020.
Islington North is a constituency in Greater London established for the 1885 general election. It has been represented in the House of Commons of the UK Parliament since 1983 by Jeremy Corbyn, who was Leader of the Labour Party and Leader of the Opposition from 2015 to 2020. Since 2020, Corbyn has represented the seat as an independent, having been suspended for remarks he made after an investigation of antisemitism in the party, and ultimately was expelled from the party in 2024. He was re-elected to Islington North as an independent in the 2024 general election.
Hornchurch was a borough constituency represented in the House of Commons of the Parliament of the United Kingdom. It elected one Member of Parliament (MP) by the first past the post system of election. At the 2010 general election parts formed the new seats of Hornchurch and Upminster; and Dagenham and Rainham.
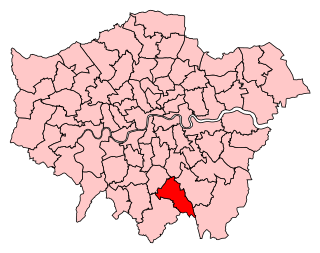
Croydon Central was a constituency created in 1974 and represented in the House of Commons of the UK Parliament from 2017 until its abolition for the 2024 general election by Labour MP Sarah Jones. The seat bucked the trend in national results in 2019, with Labour holding the seat with a slightly increased majority.
Brentford and Isleworth is a constituency represented in the House of Commons of the UK Parliament. It forms the eastern part of the London Borough of Hounslow. Since 2015, it has been represented by Ruth Cadbury of the Labour Party.
Putney is a constituency in Greater London created in 1918 and represented in the House of Commons of the UK Parliament since 2019 by Fleur Anderson of the Labour Party. Putney was the sole Labour gain in the 2019 general election, amid the worst election results for the party since 1935.
Streatham was a constituency represented in the House of Commons of the UK Parliament.
Enfield Southgate was a constituency in the House of Commons of the UK Parliament. It was created in 1950 as Southgate.
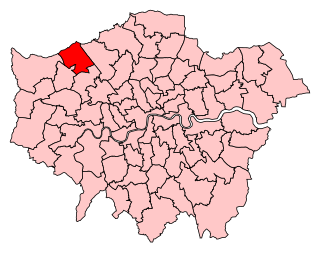
Harrow East is a constituency in Greater London created in 1945 and represented in the House of Commons of the UK Parliament since 2010 by Bob Blackman, a Conservative.
Camden London Borough Council in London, England is elected every four years. Since the last boundary changes in 2022, 55 councillors have been elected from 20 wards.
Bloomsbury is a ward in the London Borough of Camden, in the United Kingdom. It covers much of the historic area of Bloomsbury, and also some of Covent Garden and Fitzrovia.
The 1986 Camden Council election took place on 8 May 1986 to elect members of Camden London Borough Council in London, England. The whole council was up for election.
Hampstead Town is a ward in the London Borough of Camden, in the United Kingdom. It covers most of Hampstead Village, the western half of Hampstead Heath, North End and the Vale of Health. The more residential Frognal ward covers much of the rest of Hampstead.
The 1982 Camden Council election took place on 6 May 1982 to elect members of Camden London Borough Council in London, England. The whole council was up for election.
The 1964 Camden Council election took place on 7 May 1964 to elect members of Camden London Borough Council in London, England. The whole council was up for election and the Labour Party gained control of the council.
The 1974 Hammersmith Council election took place on 2 May 1974 to elect members of Hammersmith London Borough Council in London, England. The whole council was up for election and the Labour Party stayed in overall control of the council.
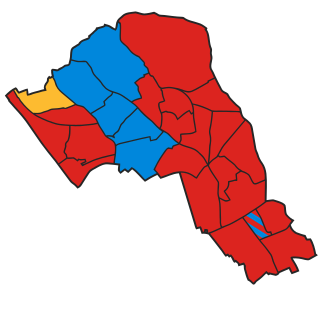
The 1978 Hammersmith Council election took place on 4 May 1978 to elect members of Hammersmith London Borough Council in London, England. The whole council was up for election, with an extra two wards and 10 fewer councillors - and the council went in no overall control.
The 1982 Havering Council election took place on 6 May 1982 to elect members of Havering London Borough Council in London, England. The whole council was up for election and the Conservative party stayed in overall control of the council.
Elections for the London Borough of Merton were held on 4 May 1978 to elect members of Merton London Borough Council in London, England. This was on the same day as other local elections in England and Scotland.
The 2022 Camden London Borough Council election took place on 5 May 2022. All 55 members of Camden London Borough Council were elected. The elections took place alongside local elections in the other London boroughs and elections to local authorities across the United Kingdom.