| |||||||||||||||||||||||||||||||||||||||||||||||||||||||||||
14 out of 42 seats to Cambridge City Council 22 seats needed for a majority | |||||||||||||||||||||||||||||||||||||||||||||||||||||||||||
---|---|---|---|---|---|---|---|---|---|---|---|---|---|---|---|---|---|---|---|---|---|---|---|---|---|---|---|---|---|---|---|---|---|---|---|---|---|---|---|---|---|---|---|---|---|---|---|---|---|---|---|---|---|---|---|---|---|---|---|
Turnout | 38.6% (3.9%) | ||||||||||||||||||||||||||||||||||||||||||||||||||||||||||
| |||||||||||||||||||||||||||||||||||||||||||||||||||||||||||
Winner of each seat at the 1978 Cambridge City Council election | |||||||||||||||||||||||||||||||||||||||||||||||||||||||||||
|
The 1978 Cambridge City Council election took place on 4 May 1978 to elect members of Cambridge City Council in Cambridge, Cambridgeshire, England. [1] This was on the same day as other local elections across England.
1978 Cambridge City Council election | ||||||||||
---|---|---|---|---|---|---|---|---|---|---|
Party | This election | Full council | This election | |||||||
Seats | Net | Seats % | Other | Total | Total % | Votes | Votes % | +/− | ||
Conservative | 7 | 2 | 50.0 | 15 | 22 | 52.4 | 14,262 | 46.4 | –3.8 | |
Labour | 6 | 1 | 42.9 | 11 | 17 | 40.5 | 12,304 | 40.1 | +0.9 | |
Liberal | 0 | 0.0 | 2 | 2 | 4.8 | 2,295 | 7.5 | –1.6 | ||
Independent | 1 | 1 | 7.1 | 0 | 1 | 2.4 | 1,776 | 5.8 | N/A | |
Communist | 0 | 0.0 | 0 | 0 | 0.0 | 79 | 0.3 | –0.1 | ||
Party | Candidate | Votes | % | ±% | |
---|---|---|---|---|---|
Labour | Alec Molt* | 830 | 67.1 | +14.9 | |
Conservative | Edna Jones | 407 | 32.9 | –3.4 | |
Majority | 423 | 34.2 | N/A | ||
Turnout | 1,237 | 26.6 | –5.0 | ||
Registered electors | 4,647 | ||||
Labour hold | Swing | 9.2 | |||
Party | Candidate | Votes | % | ±% | |
---|---|---|---|---|---|
Labour | Barbara May | 1,314 | 53.7 | +2.2 | |
Conservative | Sheila Jones | 1,135 | 46.3 | –2.2 | |
Majority | 179 | 7.3 | N/A | ||
Turnout | 2,449 | 43.5 | –1.9 | ||
Registered electors | 5,632 | ||||
Labour hold | Swing | 2.2 | |||
Party | Candidate | Votes | % | ±% | |
---|---|---|---|---|---|
Conservative | George Reid* | 1,082 | 44.0 | –16.8 | |
Labour | Richard Kimber | 842 | 34.2 | –5.0 | |
Liberal | Andrew Gore | 537 | 21.8 | N/A | |
Majority | 240 | 9.8 | N/A | ||
Turnout | 2,461 | 41.3 | –3.5 | ||
Registered electors | 5,953 | ||||
Conservative hold | Swing | 5.9 | |||
Party | Candidate | Votes | % | ±% | |
---|---|---|---|---|---|
Conservative | Colin Barker | 1,321 | 52.0 | –3.3 | |
Labour | Anthony Carter | 1,217 | 48.0 | +3.3 | |
Majority | 104 | 4.0 | N/A | ||
Turnout | 2,538 | 48.0 | +2.3 | ||
Registered electors | 5,284 | ||||
Conservative hold | Swing | 3.3 | |||
Party | Candidate | Votes | % | ±% | |
---|---|---|---|---|---|
Conservative | Charles Seagrove | 979 | 48.5 | +2.1 | |
Labour | James Curley | 860 | 42.6 | +3.3 | |
Liberal | Philip Mitchell | 178 | 8.8 | –5.5 | |
Majority | 119 | 5.9 | N/A | ||
Turnout | 2,017 | 39.0 | –8.3 | ||
Registered electors | 5,168 | ||||
Conservative hold | Swing | 0.6 | |||
Party | Candidate | Votes | % | ±% | |
---|---|---|---|---|---|
Conservative | Sidney Miller* | 1,277 | 58.3 | +0.1 | |
Labour | Richard Wall | 912 | 41.7 | –0.1 | |
Majority | 365 | 16.7 | N/A | ||
Turnout | 2,189 | 34.6 | –4.7 | ||
Registered electors | 6,332 | ||||
Conservative hold | Swing | 0.1 | |||
Party | Candidate | Votes | % | ±% | |
---|---|---|---|---|---|
Labour | Philip Geoghan* | 793 | 56.2 | –0.9 | |
Conservative | Malcolm Mackenzie | 474 | 33.6 | –9.3 | |
Liberal | Brian Badcock | 145 | 10.3 | N/A | |
Majority | 319 | 22.6 | N/A | ||
Turnout | 1,412 | 34.6 | –12.8 | ||
Registered electors | 4,083 | ||||
Labour hold | Swing | 4.2 | |||
Party | Candidate | Votes | % | ±% | |
---|---|---|---|---|---|
Independent | Margaret Reiss | 1,776 | 71.2 | N/A | |
Conservative | Graham Edwards* | 718 | 28.8 | +4.0 | |
Majority | 1,058 | 42.4 | N/A | ||
Turnout | 2,494 | 38.5 | –0.2 | ||
Registered electors | 6,473 | ||||
Independent gain from Conservative |
Party | Candidate | Votes | % | ±% | |
---|---|---|---|---|---|
Labour | Wendy Nicol | 1,501 | 49.1 | +6.6 | |
Conservative | Ella Craigie | 987 | 32.3 | –5.8 | |
Liberal | Anthony Waite | 567 | 18.6 | –0.8 | |
Majority | 514 | 16.8 | N/A | ||
Turnout | 3,055 | 44.9 | +0.1 | ||
Registered electors | 6,809 | ||||
Labour hold | Swing | 6.2 | |||
Party | Candidate | Votes | % | ±% | |
---|---|---|---|---|---|
Labour | Frank Gawthrop | 1,218 | 49.9 | +9.2 | |
Conservative | Elaine Wheatley* | 1,022 | 41.9 | +1.0 | |
Liberal | Keith Edkins | 201 | 8.2 | N/A | |
Majority | 196 | 8.0 | N/A | ||
Turnout | 2,441 | 40.0 | +2.1 | ||
Registered electors | 6,101 | ||||
Labour gain from Conservative | Swing | 4.1 | |||
Party | Candidate | Votes | % | ±% | |
---|---|---|---|---|---|
Conservative | James Johnson* | 1,569 | 70.3 | +12.4 | |
Labour | Stephen Dartford | 663 | 29.7 | +8.3 | |
Majority | 906 | 40.6 | N/A | ||
Turnout | 2,232 | 36.5 | –10.4 | ||
Registered electors | 6,114 | ||||
Conservative hold | Swing | 2.1 | |||
Party | Candidate | Votes | % | ±% | |
---|---|---|---|---|---|
Labour | Terence Sweeney* | 989 | 49.4 | +4.2 | |
Conservative | Philip Robinson | 601 | 30.0 | –2.9 | |
Liberal | Alan Charlesworth | 380 | 19.0 | –2.8 | |
Communist | Julian Chaloner | 31 | 1.5 | N/A | |
Majority | 388 | 19.4 | N/A | ||
Turnout | 2,001 | 35.0 | –1.2 | ||
Registered electors | 5,722 | ||||
Labour hold | Swing | 3.6 | |||
Party | Candidate | Votes | % | ±% | |
---|---|---|---|---|---|
Conservative | Millicent Suckling* | 1,406 | 62.1 | –5.1 | |
Labour | Stephen Watts | 524 | 23.1 | –9.7 | |
Liberal | David Green | 287 | 12.7 | N/A | |
Communist | David Mourton | 48 | 2.1 | N/A | |
Majority | 882 | 38.9 | N/A | ||
Turnout | 2,265 | 38.5 | –5.7 | ||
Registered electors | 5,880 | ||||
Conservative hold | Swing | 2.3 | |||
Party | Candidate | Votes | % | ±% | |
---|---|---|---|---|---|
Conservative | Chris Gough-Goodman* | 1,284 | 66.7 | +5.9 | |
Labour | Richard Overy | 641 | 33.3 | –5.9 | |
Majority | 643 | 33.4 | N/A | ||
Turnout | 1,925 | 36.2 | –5.4 | ||
Registered electors | 5,318 | ||||
Conservative hold | Swing | 5.9 | |||
South Cambridgeshire was a constituency represented in the House of Commons of the UK Parliament since 2019 by Anthony Browne, a Conservative.
One third of Cambridge City Council is elected each year, followed by one year without election.
Cambridge City Council is the local authority for Cambridge, a non-metropolitan district with city status in Cambridgeshire, England. The council has been under Labour majority control since 2014. It meets at Cambridge Guildhall. The council is a member of the Cambridgeshire and Peterborough Combined Authority.
Elections for Cambridge City Council were held on Thursday 5 May 2011. As the council is elected by thirds, one seat in each of the wards was up for election, with the exception of Cherry Hinton ward where two seats were up for election due to the early retirement of Councillor Stuart Newbold. The vote took place alongside the 2011 United Kingdom Alternative Vote referendum and a Cambridgeshire County Council by-election for Arbury ward.
Elections for Cambridge City Council were held on Thursday 3 May 2012. One third of the council was up for election and the Liberal Democrats lost overall control of the council, to No Overall Control.
The 2014 Cambridge City Council election took place on 22 May 2014 to elect members of Cambridge City Council in England. This was on the same day as other local elections and the European Union elections.
The 1978 Westminster Council election took place on 4 May 1978 to elect members of Westminster City Council in London, England. The whole council was up for election and the Conservative party stayed in overall control of the council.
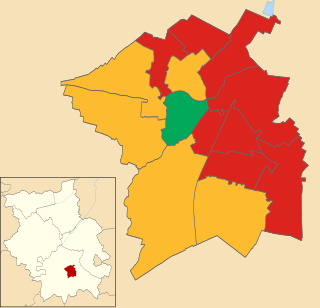
The 2015 Cambridge City Council election took place on 7 May 2015 to elect members of Cambridge City Council in England as part of the English local elections of that year coinciding with the 2015 General Election.
Bath City Council was a non-metropolitan district in Avon, England, that administered the city of Bath, Somerset, from 1974 until 1996. The district council replaced the pre-1974 county borough council.
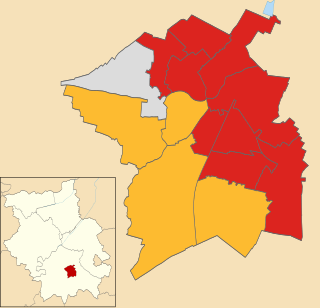
The 2016 Cambridge City Council election took place on 5 May 2016 to elect members of Cambridge City Council in England. This was on the same day as other nationwide local elections. The Labour Party grouping gained two seats from the Liberal Democrats, increasing their majority on the council from 6 to 10 seats.
Elections to Cambridge City Council were held on 6 May 2010 as part of the wider local elections across England.
The 2018 Cambridge City Council election took place on 3 May 2018 to elect members of Cambridge City Council in England. This was on the same day as other nationwide local elections.
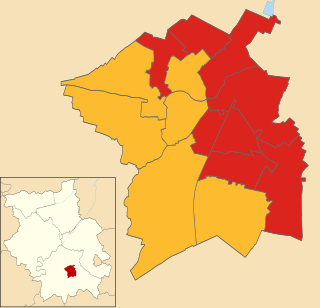
The 2019 Cambridge City Council election took place on 2 May 2019 to elect members of Cambridge City Council in England. It took place on the same day as other nationwide local elections.
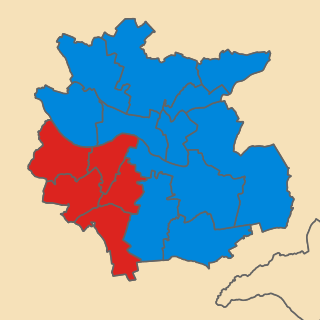
The 2021 Cambridgeshire County Council election took place on 6 May 2021 as part of the 2021 local elections in the United Kingdom. All 61 councillors were elected from 59 electoral divisions, which returned either one or two county councillors each by first-past-the-post voting for a four-year term of office. The election was held alongside a full election for Cambridge City Council, the Cambridgeshire Police and Crime Commissioner, Mayor of Cambridgeshire and Peterborough and one-third of Peterborough City Council.
The 2021 Cambridge City Council election took place on 6 May 2021 to elect members of Cambridge City Council in England. This was on the same day as other nationwide local elections.
The Boston City Council election was held on November 6, 1979, with preliminary elections on September 25, 1979.
The 2002 Cambridge City Council election took place on 2 May 2002 to elect members of Cambridge City Council in England. This was on the same day as other nationwide local elections.
The 2003 Cambridge City Council election took place on 1 May 2003 to elect members of Cambridge City Council in England. This was on the same day as other nationwide local elections.
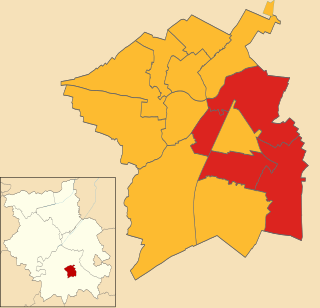
The 2007 Cambridge City Council election took place on 3 May 2007 to elect members of Cambridge City Council in England. This was on the same day as other nationwide local elections.
The 2008 Cambridge City Council election took place on 1 May 2008 to elect members of Cambridge City Council in England. This was on the same day as other nationwide local elections.