2006 Cambridge City Council election

Last updated

Elections for Cambridge City Council were held on Thursday 4 May 2006. As Cambridge City Council is elected by thirds, one seat in each of the city's 14 wards was up for election. The exception was Romsey, where two seats were up for election as a by-election for the other seat was held on the same day. Therefore, 15 of the 42 seats on the council were up for election. Overall turnout was 34.4%, down from 37.0% in 2004. The lowest turnout (28.4%) was in Abbey ward and the highest (40.8%) in Queen Edith's.

Contents

Results summary

2006 Cambridge City Council election
PartyThis electionFull councilThis election
SeatsNetSeats %OtherTotalTotal %VotesVotes %+/−
  Liberal Democrats 11Increase2.svg 173.3182969.012,66838.6-2.7
  Labour 4Steady2.svg26.791331.08,32825.4-0.5
  Conservative 0Decrease2.svg 10.0000.07,01521.4-0.8
  Green 0Steady2.svg0.0000.04,12412.6+3.8
  Respect 0Steady2.svg0.0000.05621.7N/A
  UKIP 0Steady2.svg0.0000.01380.4-0.4

Ward results

Abbey

Abbey
PartyCandidateVotes%±%
Labour Miriam Lynn 668 37.4 -3.0
Green Margaret White46426.0+8.1
Conservative Simon Mitton36220.3-1.3
Liberal Democrats Edward Sexton29216.3-3.8
Majority20411.4N/A
Turnout 1,78628.5+0.7
Labour hold Swing Decrease2.svg5.6

Arbury

Arbury
PartyCandidateVotes%±%
Liberal Democrats Timothy Ward 1,022 40.3 +4.2
Labour Michael Todd-Jones81632.1+4.0
Conservative Shapour Meftah48219.0-2.6
Green Michael Smith2198.6-5.6
Majority2068.2N/A
Turnout 2,53936.9-6.3
Liberal Democrats hold Swing Increase2.svg0.1

Castle

Castle
PartyCandidateVotes%±%
Liberal Democrats Simon Kightley 985 48.3 +2.3
Conservative Edward MacNaghten47623.3+3.5
Green Stephen Lawrence29814.6-3.2
Labour Lucy Sheerman28213.8-2.6
Majority50925.0N/A
Turnout 2,04131.5-1.6
Liberal Democrats hold Swing Decrease2.svg0.6

Cherry Hinton

Cherry Hinton
PartyCandidateVotes%±%
Labour Stuart Newbold 1,071 42.9 +1.8
Conservative Eric Barrett-Payton86434.6+1.5
Liberal Democrats Natalie Mayer-Hutchings36714.7-3.2
Green Neil Ford1937.7-0.1
Majority2078.3N/A
Turnout 2,49539.7-6.7
Labour gain from Conservative Swing Increase2.svg0.2

Coleridge

Coleridge
PartyCandidateVotes%±%
Labour Lewis Herbert 909 41.8 +8.0
Liberal Democrats Andrew Blackhurst47722.0+0.8
Conservative Stephen Jones46321.3-0.9
Green Hamish Downer1868.6-6.1
UKIP Albert Watts1386.4-1.7
Majority43219.8N/A
Turnout 2,17336.3-0.8
Labour hold Swing Increase2.svg3.6

East Chesterton

East Chesterton
PartyCandidateVotes%±%
Liberal Democrats Marian Holness 884 40.6 +4.8
Labour Richard Layfield58326.8+1.4
Conservative Kevin Francis48222.1+6.7
Green Peter Pope22810.5-4.0
Majority30113.8N/A
Turnout 2,17735.9-1.2
Liberal Democrats hold Swing Increase2.svg1.7

King's Hedges

King's Hedges
PartyCandidateVotes%±%
Liberal Democrats Neale Upstone 718 40.0 +14.0
Labour Gerri Bird53329.7-2.6
Conservative Mark Taylor35019.5-8.0
Green Gerhard Golbeck-Wood19310.8-3.3
Majority18510.3N/A
Turnout 1,79429.6+2.0
Liberal Democrats gain from Labour Swing Increase2.svg8.3

Market

Market
PartyCandidateVotes%±%
Liberal Democrats Colin Rosenstiel 772 42.7 +1.8
Conservative Timothy Haire39221.7+3.5
Green Martin Lucas-Smith35919.9+2.8
Labour Maureen Donnelly28515.8+4.9
Majority38021.0N/A
Turnout 1,80828.7-1.2
Liberal Democrats hold Swing Decrease2.svg0.9

Newnham

Newnham
PartyCandidateVotes%±%
Liberal Democrats Rod Cantrill 974 46.2 -0.8
Conservative James Strachan47522.6+2.8
Labour Joseph Powell33616.0+1.4
Green Anna Gomori-Woodcock32115.2-3.3
Majority49923.7N/A
Turnout 2,10631.7+0.1
Liberal Democrats hold Swing Decrease2.svg1.0

Petersfield

Petersfield
PartyCandidateVotes%±%
Labour Kevin Blencowe 879 39.0 +4.3
Liberal Democrats Steven Cooper84837.7+3.4
Green John Collins28212.5-2.7
Conservative Rosemary Clarkson24310.8-1.1
Majority311.4N/A
Turnout 2,25235.8-1.3
Labour hold Swing Increase2.svg0.5

Queen's Edith

Queen's Edith
PartyCandidateVotes%±%
Liberal Democrats Alan Baker 1,489 56.7 +3.6
Conservative Donald Douglas73528.0+7.2
Labour Leonard Freeman2198.3-0.5
Green Shayne Mitchell1816.9-3.8
Majority75428.7N/A
Turnout 2,62440.8-2.8
Liberal Democrats hold Swing Decrease2.svg1.8

Romsey

Romsey (2 seats due to by-election)
PartyCandidateVotes%
Liberal Democrats Sarah Ellis-Miller 1,065 44.6
Liberal Democrats Raj Shah 815 34.1
Labour Jonathan Goodacre62326.1
Labour Tariq Sadiq49120.6
Green Jesse Griffiths35815.0
Respect Thomas Woodcock29412.3
Respect Samuel Caldwell26811.2
Conservative Hugh Mennie2359.8
Green Neil Hewett2169.0
Conservative Angela Ozturk2169.0
Turnout 2,38837.0
Liberal Democrats hold

Trumpington

Trumpington
PartyCandidateVotes%±%
Liberal Democrats Sheila Stuart 960 45.5 -1.9
Conservative John Ionides75235.7+4.6
Green Ceri Galloway2059.7-4.1
Labour Pamela Stacey1919.1+1.4
Majority2089.8N/A
Turnout 2,10839.5-2.9
Liberal Democrats hold Swing Decrease2.svg3.3

West Chesterton

West Chesterton
PartyCandidateVotes%±%
Liberal Democrats Max Boyce 1,000 42.5 -4.6
Conservative Steven Mastin48820.8+3.5
Labour Simon Watkins44218.8+0.6
Green Sarah Peake42117.9+0.5
Majority51221.8N/A
Turnout 2,35136.7-4.1
Liberal Democrats hold Swing Decrease2.svg4.1

Sources

See also

Related Research Articles

Oxford City Council in Oxford, England is elected every two years, with half of the 48 seats in the City Council up for election on each occasion. Elections are held in even-numbered years. Until 2002 the council was elected by thirds.

<span class="mw-page-title-main">2006 London local elections</span>

Local government elections took place in London, and some other parts of the United Kingdom on Thursday 4 May 2006. Polling stations were open between 7am and 10pm.

Elections for Oxford City Council were held on Thursday 4 May 2006. As Oxford City Council is elected by halves, one seat in each of the 24 wards was up for election. The exception was St Clement's, where both seats were up for election as a by-election for the other seat was held on the same day. Therefore, 25 of the 48 seats on the Council were up for election. Overall turnout was 35.8%, down from 37.6% in 2004. The lowest turnout (24.9%) was in Carfax ward and the highest (49.6%) in Marston.

<span class="mw-page-title-main">2006 Barnet London Borough Council election</span> 2006 local election in England

The 2006 Barnet Council election took place on 4 May 2006 to elect members of Barnet London Borough Council in London, England. The whole council was up for election and the Conservative party stayed in overall control of the council.

The Politics of Aberdeen, Scotland have changed significantly in recent years. In 1996, under the Local Government etc. (Scotland) Act 1994, Grampian Regional Council and Aberdeen District Council were dissolved, creating the new unitary Aberdeen City Council to represent the city's council area.

Elections to the Borough Council in Slough, England, were held on 3 May 2007. One third of the council was up for election. This was the 122nd Slough general local authority election since Slough became a local government unit in 1863.

<span class="mw-page-title-main">2006 Hackney London Borough Council election</span> 2006 local election in England, UK

Elections for London Borough of Hackney Council were held on Thursday 4 May 2006. The whole council was up for election. Hackney is divided into 19 wards, each electing three councillors, so a total of 57 seats were up for election.

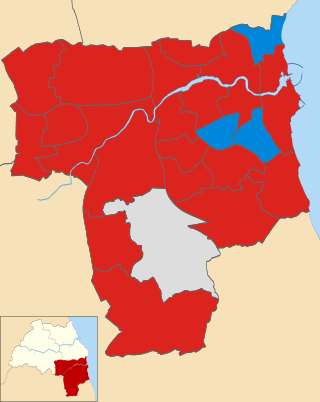
Elections for Oxford City Council were held on Thursday 1 May 2008. As Oxford City Council is elected by halves, one seat in each of the 24 wards is up for election.

The 2007 Thurrock Council election took place on 3 May 2007 to elect members of Thurrock Council in Essex, England. One third of the council was up for election and the Conservative party lost overall control of the council to no overall control.

The 2003 Gateshead Borough Council election was held on 1 May 2003 to elect members of Gateshead Council in Tyne and Wear, England. One third of the council was up for election and the Labour Party kept overall control of the council.

<span class="mw-page-title-main">2004 Hull City Council election</span>

The 2004 Hull City Council election took place on 10 June 2004 to elect members of Hull City Council in England. One third of the council was up for election and the council stayed under no overall control.

<span class="mw-page-title-main">2007 Hull City Council election</span>

The 2007 Hull City Council election took place on 3 May 2007 to elect members of Hull City Council in England. One third of the council was up for election and the Liberal Democrats gained overall control of the council from no overall control. Overall turnout was 27%.

<span class="mw-page-title-main">2004 Winchester City Council election</span>

The 2004 Winchester Council election took place on 10 June 2004 to elect members of Winchester District Council in Hampshire, England. One third of the council was up for election and the Liberal Democrats lost overall control of the council to no overall control.

The 2006 South Tyneside Metropolitan Borough Council election took place on 4 May 2006 to elect members of South Tyneside Metropolitan Borough Council in Tyne and Wear, England. One third of the council was up for election and the Labour Party stayed in overall control of the council.

<span class="mw-page-title-main">2011 Manchester City Council election</span>

Elections to Manchester City Council were held on 5 May 2011, along with the 2011 United Kingdom Alternative Vote referendum. One third of the council was up for election, with each successful candidate serving a four-year term of office, expiring in 2015. The Labour Party retained overall control of the council, managing to win every seat contested. Overall turnout was a comparatively high 31.6%, although much down on the previous year's general election turnout of 50.9%.

<span class="mw-page-title-main">2011 Cambridge City Council election</span>

Elections for Cambridge City Council were held on Thursday 5 May 2011. As the council is elected by thirds, one seat in each of the wards was up for election, with the exception of Cherry Hinton ward where two seats were up for election due to the early retirement of Councillor Stuart Newbold. The vote took place alongside the 2011 United Kingdom Alternative Vote referendum and a Cambridgeshire County Council by-election for Arbury ward.

<span class="mw-page-title-main">2012 Sheffield City Council election</span>

Sheffield City Council elections took place on Thursday 3 May 2012 as part of the 2012 United Kingdom local elections.

<span class="mw-page-title-main">2011 Sunderland City Council election</span>

The 2011 Sunderland Council election took place on 5 May 2011 to elect members of Sunderland Metropolitan Borough Council in Tyne and Wear, England. One third of the council was up for election and the Labour Party stayed in overall control of the council.

<span class="mw-page-title-main">2012 Coventry City Council election</span>

Elections for Coventry City Council were held on Thursday, 3 May 2012, the same day as other 2012 local elections in the United Kingdom. As the council is elected by thirds, one seat in each of the city's 18 wards was up for election. The Labour Party won the seat in 15 of the wards, gaining a total of 8 and increasing their majority to 32 seats. The Conservative Party won the remaining three seats, losing six, with the Liberal Democrats and the Socialist Party both losing their only seat on the council.

Elections for Oxford City Council were held on Thursday 3 May 2012. As Oxford City Council is elected by halves, one seat in each of the 24 wards is up for election.