| |||||||||||||||||||||||||||||||||||||||||||||||||||||||||||
14 out of 42 seats to Cambridge City Council 22 seats needed for a majority | |||||||||||||||||||||||||||||||||||||||||||||||||||||||||||
---|---|---|---|---|---|---|---|---|---|---|---|---|---|---|---|---|---|---|---|---|---|---|---|---|---|---|---|---|---|---|---|---|---|---|---|---|---|---|---|---|---|---|---|---|---|---|---|---|---|---|---|---|---|---|---|---|---|---|---|
Turnout | 41.8% (30.0%) | ||||||||||||||||||||||||||||||||||||||||||||||||||||||||||
| |||||||||||||||||||||||||||||||||||||||||||||||||||||||||||
Winner of each seat at the 1980 Cambridge City Council election | |||||||||||||||||||||||||||||||||||||||||||||||||||||||||||
|
The 1980 Cambridge City Council election took place on 1 May 1980 to elect members of Cambridge City Council in Cambridge, Cambridgeshire, England. [1] This was on the same day as other local elections across England.
1980 Cambridge City Council election | ||||||||||
---|---|---|---|---|---|---|---|---|---|---|
Party | This election | Full council | This election | |||||||
Seats | Net | Seats % | Other | Total | Total % | Votes | Votes % | +/− | ||
Labour | 8 | 3 | 57.1 | 13 | 21 | 50.0 | 13,964 | 42.8 | +3.8 | |
Conservative | 4 | 4 | 28.6 | 12 | 16 | 38.1 | 12,496 | 38.3 | +0.3 | |
Liberal | 2 | 1 | 14.3 | 2 | 4 | 9.5 | 5,990 | 18.4 | –4.5 | |
Independent | 0 | 0.0 | 1 | 1 | 2.4 | N/A | N/A | N/A | ||
Ecology | 0 | 0.0 | 0 | 0 | 0.0 | 145 | 0.4 | N/A | ||
Party | Candidate | Votes | % | ±% | |
---|---|---|---|---|---|
Labour | Richard Smith | 1,169 | 71.6 | +11.7 | |
Conservative | Edna Jones | 365 | 22.4 | –5.8 | |
Liberal | David Green | 99 | 6.1 | –5.8 | |
Majority | 804 | 49.2 | +17.5 | ||
Turnout | 1,633 | 34.5 | –35.5 | ||
Registered electors | 4,740 | ||||
Labour hold | Swing | 8.8 | |||
Party | Candidate | Votes | % | ±% | |
---|---|---|---|---|---|
Labour | Elizabeth Gard* | 1,272 | 52.6 | +7.7 | |
Conservative | Patrick Harris | 922 | 38.2 | –1.0 | |
Liberal | Charles Burch | 222 | 9.2 | –6.7 | |
Majority | 350 | 14.5 | +8.7 | ||
Turnout | 2,416 | 44.2 | –27.6 | ||
Registered electors | 5,463 | ||||
Labour hold | Swing | 4.4 | |||
Party | Candidate | Votes | % | ±% | |
---|---|---|---|---|---|
Liberal | Alan Charlesworth | 1,162 | 43.5 | –6.4 | |
Conservative | Neville Auker* | 984 | 36.9 | +10.1 | |
Labour | Joan Robinson | 524 | 19.6 | –3.7 | |
Majority | 178 | 6.7 | –16.4 | ||
Turnout | 2,670 | 45.2 | –27.3 | ||
Registered electors | 5,913 | ||||
Liberal gain from Conservative | Swing | 8.3 | |||
Party | Candidate | Votes | % | ±% | |
---|---|---|---|---|---|
Labour | John Woodhouse | 1,382 | 52.6 | +8.4 | |
Conservative | John Phillips* | 1,059 | 40.3 | –1.0 | |
Liberal | Ann Corsellis | 187 | 7.1 | –7.4 | |
Majority | 323 | 12.3 | +9.3 | ||
Turnout | 2,628 | 50.3 | –27.5 | ||
Registered electors | 5,225 | ||||
Labour gain from Conservative | Swing | 4.7 | |||
Party | Candidate | Votes | % | ±% | |
---|---|---|---|---|---|
Labour | Mark Todd | 1,236 | 49.0 | +10.2 | |
Conservative | Donald Mackay* | 998 | 39.5 | –5.8 | |
Liberal | Geoffrey Heathcock | 291 | 11.5 | –4.4 | |
Majority | 238 | 9.4 | N/A | ||
Turnout | 2,525 | 48.6 | –26.1 | ||
Registered electors | 5,193 | ||||
Labour gain from Conservative | Swing | 8.0 | |||
Party | Candidate | Votes | % | ±% | |
---|---|---|---|---|---|
Conservative | Graham Knowles* | 1,245 | 45.7 | –1.5 | |
Labour | Carey Widdows | 1,239 | 45.5 | +8.7 | |
Liberal | Anita Anderson | 238 | 8.7 | –7.3 | |
Majority | 6 | 0.2 | –10.2 | ||
Turnout | 2,722 | 44.7 | –25.6 | ||
Registered electors | 6,088 | ||||
Conservative hold | Swing | 5.1 | |||
Party | Candidate | Votes | % | ±% | |
---|---|---|---|---|---|
Labour | Peter Cowell* | 1,134 | 70.6 | +18.3 | |
Conservative | Jane Jenkins | 344 | 21.4 | –10.6 | |
Liberal | Brian Badcock | 128 | 8.0 | –7.7 | |
Majority | 790 | 49.2 | +28.9 | ||
Turnout | 1,606 | 36.5 | –34.0 | ||
Registered electors | 4,398 | ||||
Labour hold | Swing | 14.5 | |||
Party | Candidate | Votes | % | ±% | |
---|---|---|---|---|---|
Liberal | Colin Rosenstiel* | 1,036 | 50.8 | +3.6 | |
Conservative | Michael O'Hannah | 566 | 27.8 | +1.3 | |
Labour | Gwilym Colseno | 436 | 21.4 | –4.8 | |
Majority | 470 | 23.1 | +2.4 | ||
Turnout | 2,038 | 33.5 | –32.5 | ||
Registered electors | 6,082 | ||||
Liberal hold | Swing | 1.2 | |||
Party | Candidate | Votes | % | ±% | |
---|---|---|---|---|---|
Labour | Gwyneth Lipstein* | 1,215 | 47.9 | +0.7 | |
Conservative | Stanley Craigie | 852 | 33.6 | +7.1 | |
Liberal | Shirley Fozzard | 467 | 18.4 | –7.8 | |
Majority | 363 | 14.3 | –6.4 | ||
Turnout | 2,534 | 37.6 | –34.0 | ||
Registered electors | 6,733 | ||||
Labour hold | Swing | 3.2 | |||
Party | Candidate | Votes | % | ±% | |
---|---|---|---|---|---|
Labour | Jill Tufnell | 1,434 | 52.9 | +4.0 | |
Conservative | Elizabeth Sergeant* | 898 | 33.1 | –2.2 | |
Liberal | Patrick Browne | 236 | 8.7 | –7.1 | |
Ecology | Julian Paren | 145 | 5.3 | N/A | |
Majority | 536 | 19.8 | +6.2 | ||
Turnout | 2,713 | 46.5 | –18.6 | ||
Registered electors | 5,836 | ||||
Labour gain from Conservative | Swing | 3.1 | |||
Party | Candidate | Votes | % | ±% | |
---|---|---|---|---|---|
Conservative | Graham Edwards | 1,361 | 46.0 | –5.4 | |
Liberal | Bruce Galloway | 1,016 | 34.4 | +12.4 | |
Labour | Ethel Shepherd | 579 | 19.6 | –7.0 | |
Majority | 345 | 11.7 | –13.1 | ||
Turnout | 2,956 | 50.1 | –26.0 | ||
Registered electors | 5,902 | ||||
Conservative hold | Swing | 8.9 | |||
Party | Candidate | Votes | % | ±% | |
---|---|---|---|---|---|
Labour | Peter Wright* | 1,214 | 59.3 | +10.0 | |
Conservative | Barry Wright | 553 | 27.0 | –4.1 | |
Liberal | Richard Folley | 279 | 13.6 | –5.9 | |
Majority | 661 | 32.3 | +14.1 | ||
Turnout | 2,046 | 36.4 | –31.6 | ||
Registered electors | 5,620 | ||||
Labour hold | Swing | 7.1 | |||
Party | Candidate | Votes | % | ±% | |
---|---|---|---|---|---|
Conservative | R Wright | 1,226 | 56.5 | +4.6 | |
Labour | S Watts | 598 | 27.6 | +0.2 | |
Liberal | J Walker | 345 | 15.9 | –3.3 | |
Majority | 628 | 29.0 | +4.5 | ||
Turnout | 2,169 | 39.1 | –31.0 | ||
Registered electors | 5,549 | ||||
Conservative hold | Swing | 2.2 | |||
Party | Candidate | Votes | % | ±% | |
---|---|---|---|---|---|
Conservative | Maurice Garner* | 1,123 | 57.9 | +8.0 | |
Labour | Richard Wall | 532 | 27.4 | –2.8 | |
Liberal | Anthony Waite | 284 | 14.6 | –5.2 | |
Majority | 591 | 30.5 | +10.8 | ||
Turnout | 1,939 | 36.9 | –32.2 | ||
Registered electors | 5,249 | ||||
Conservative hold | Swing | 5.4 | |||
Party | Candidate | Votes | % | ±% | |
---|---|---|---|---|---|
SDP (Alliance) | Cathy Grove | 947 | 47.6 | ||
Labour | Leonard Freeman | 862 | 43.3 | ||
Conservative | Stephen George | 180 | 9.0 | ||
Majority | 85 | 4.3 | |||
Turnout | 1,989 | ||||
SDP gain from Labour | Swing | ||||
South Cambridgeshire was a constituency represented in the House of Commons of the UK Parliament since 2019 by Anthony Browne, a Conservative.
One third of Cambridge City Council is elected each year, followed by one year without election.
Cambridge City Council is the local authority for Cambridge, a non-metropolitan district with city status in Cambridgeshire, England. The council has been under Labour majority control since 2014. It meets at Cambridge Guildhall. The council is a member of the Cambridgeshire and Peterborough Combined Authority.
Elections for Cambridge City Council were held on Thursday 5 May 2011. As the council is elected by thirds, one seat in each of the wards was up for election, with the exception of Cherry Hinton ward where two seats were up for election due to the early retirement of Councillor Stuart Newbold. The vote took place alongside the 2011 United Kingdom Alternative Vote referendum and a Cambridgeshire County Council by-election for Arbury ward.
Elections for Cambridge City Council were held on Thursday 3 May 2012. One third of the council was up for election and the Liberal Democrats lost overall control of the council, to No Overall Control.
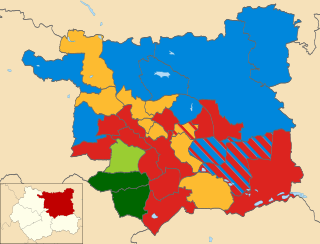
The 2004 Leeds City Council election took place on 10 June 2004 to elect members of City of Leeds Metropolitan Borough Council in England.
The 2014 Cambridge City Council election took place on 22 May 2014 to elect members of Cambridge City Council in England. This was on the same day as other local elections and the European Union elections.
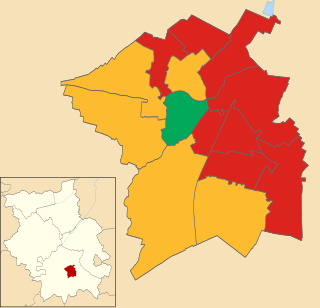
The 2015 Cambridge City Council election took place on 7 May 2015 to elect members of Cambridge City Council in England as part of the English local elections of that year coinciding with the 2015 General Election.
Bath City Council was a non-metropolitan district in Avon, England, that administered the city of Bath, Somerset, from 1974 until 1996. The district council replaced the pre-1974 county borough council.
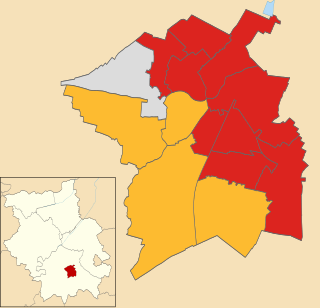
The 2016 Cambridge City Council election took place on 5 May 2016 to elect members of Cambridge City Council in England. This was on the same day as other nationwide local elections. The Labour Party grouping gained two seats from the Liberal Democrats, increasing their majority on the council from 6 to 10 seats.
Elections to Cambridge City Council were held on 6 May 2010 as part of the wider local elections across England.
The 2018 Cambridge City Council election took place on 3 May 2018 to elect members of Cambridge City Council in England. This was on the same day as other nationwide local elections.
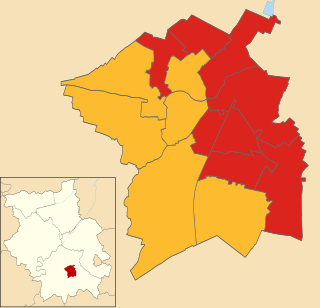
The 2019 Cambridge City Council election took place on 2 May 2019 to elect members of Cambridge City Council in England. It took place on the same day as other nationwide local elections.
The 1980 Derby City Council election took place on 1 May 1980 to elect members of Derby City Council in England. This was on the same day as other local elections. 14 of the council's 44 seats were up for election. The Labour Party retained control of the council.
The 2021 Cambridgeshire County Council election took place on 6 May 2021 as part of the 2021 local elections in the United Kingdom. All 61 councillors were elected from 59 electoral divisions, which returned either one or two county councillors each by first-past-the-post voting for a four-year term of office. The election was held alongside a full election for Cambridge City Council, the Cambridgeshire Police and Crime Commissioner, Mayor of Cambridgeshire and Peterborough and one-third of Peterborough City Council.
The 2021 Cambridge City Council election took place on 6 May 2021 to elect members of Cambridge City Council in England. This was on the same day as other nationwide local elections.
The 2002 Cambridge City Council election took place on 2 May 2002 to elect members of Cambridge City Council in England. This was on the same day as other nationwide local elections.
The 2003 Cambridge City Council election took place on 1 May 2003 to elect members of Cambridge City Council in England. This was on the same day as other nationwide local elections.
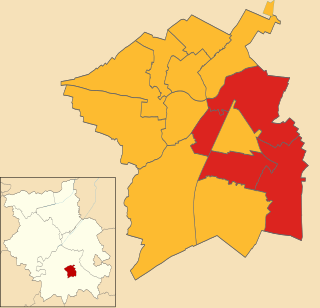
The 2007 Cambridge City Council election took place on 3 May 2007 to elect members of Cambridge City Council in England. This was on the same day as other nationwide local elections.
The 2008 Cambridge City Council election took place on 1 May 2008 to elect members of Cambridge City Council in England. This was on the same day as other nationwide local elections.