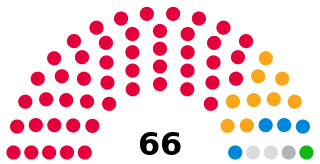
The 2014 Cambridge City Council election took place on 22 May 2014 to elect members of Cambridge City Council in England. [1] This was on the same day as other local elections and the European Union elections. [2]
| |||||||||||||||||||||||||||||||||||
16: one-third of 42 22 seats needed for a majority | |||||||||||||||||||||||||||||||||||
---|---|---|---|---|---|---|---|---|---|---|---|---|---|---|---|---|---|---|---|---|---|---|---|---|---|---|---|---|---|---|---|---|---|---|---|
| |||||||||||||||||||||||||||||||||||
Winner of each seat at the 2014 Cambridge City Council election |
2014 Cambridge City Council election | ||||||||||
---|---|---|---|---|---|---|---|---|---|---|
Party | This election | Full council | This election | |||||||
Seats | Net | Seats % | Other | Total | Total % | Votes | Votes % | +/− | ||
Labour | 10 | 6 | 66.7 | 15 | 25 | 59.5 | 16,025 | 40.8 | -1.9 | |
Liberal Democrats | 4 | 7 | 26.7 | 10 | 14 | 33.3 | 11,619 | 29.6 | +3.5 | |
Independent | 1 | 1 | 6.7 | 1 | 2 | 4.8 | 826 | 2.1 | -1.1 | |
Conservative | 0 | 0.0 | 1 | 1 | 2.4 | 5,218 | 13.3 | -2.1 | ||
Green | 0 | 0.0 | 0 | 0 | 0.0 | 5,271 | 13.4 | +3.3 | ||
UKIP | 0 | 0.0 | 0 | 0 | 0.0 | 328 | 0.8 | +0.4 | ||
Party | Candidate | Votes | % | ±% | |
---|---|---|---|---|---|
Labour | Peter Roberts | 1,130 | 48.7 | -5.7 | |
Green | Oscar Gillespie | 480 | 20.7 | -3.2 | |
Liberal Democrats | Marcus Streets | 384 | 16.4 | +7.1 | |
Conservative | Eric Berrett-Payton | 328 | 14.1 | +1.7 | |
Majority | |||||
Turnout | |||||
Labour hold | Swing | ||||
This seat was gained by the Labour Party in a by-election in 2013 and is therefore shown as a hold.
Party | Candidate | Votes | % | ±% | |
---|---|---|---|---|---|
Labour | Charlotte Perry | 1,300 | 45.6 | -14.3 | |
Liberal Democrats | Tim Ward | 722 | 25.3 | +6.4 | |
Green | Stephen Lawrence | 444 | 15.6 | +5.1 | |
Conservative | James Mottram | 385 | 13.5 | +3.0 | |
Majority | |||||
Turnout | |||||
Labour gain from Liberal Democrats | Swing | ||||
Party | Candidate | Votes | % | ±% | |
---|---|---|---|---|---|
Independent | Marie-Louise Holland | 737 | 27.2 | -22.3 | |
Liberal Democrats | Fergus Blair | 717 | 26.5 | +11.8 | |
Labour | Mark Reader | 565 | 20.9 | +3.2 | |
Green | Sandra Billington | 409 | 15.1 | +6.3 | |
Conservative | Tom Byrne | 281 | 10.4 | +1.1 | |
Majority | |||||
Turnout | |||||
Independent gain from Liberal Democrats | Swing | ||||
Party | Candidate | Votes | % | ±% | |
---|---|---|---|---|---|
Labour | Russ McPherson | 1,533 | 60.6 | -12.6 | |
Conservative | Timothy Haire | 613 | 24.2 | +6.1 | |
Liberal Democrats | Keith Edkins | 383 | 15.1 | +6.4 | |
Majority | |||||
Turnout | |||||
Labour hold | Swing | ||||
Party | Candidate | Votes | % | ±% | |
---|---|---|---|---|---|
Labour Co-op | Lewis Herbert | 1,326 | 51.6 | -8.0 | |
Conservative | Samuel Barker | 430 | 16.7 | -3.8 | |
Liberal Democrats | Donald Adey | 368 | 15.0 | +6.1 | |
Green | Shaun Esgate | 358 | 13.9 | +2.8 | |
Independent | Puffles The Dragon Fairy | 89 | 3.5 | +3.5 | |
Majority | |||||
Turnout | |||||
Labour Co-op hold | Swing | ||||
Party | Candidate | Votes | % | ±% | |
---|---|---|---|---|---|
Labour Co-op | Peter Sarris | 1,076 | 35.5 | -11.9 | |
Liberal Democrats | Zoe O'Connell | 1,066 | 35.2 | +14.7 | |
UKIP | Pater Burkinshaw | 328 | 10.8 | +4.8 | |
Green | Peter Pope | 299 | 9.9 | -1.4 | |
Conservative | Daniel John | 260 | 8.6 | -6.2 | |
Majority | |||||
Turnout | |||||
Labour Co-op gain from Liberal Democrats | Swing | ||||
Party | Candidate | Votes | % | ±% | |
---|---|---|---|---|---|
Labour | Martin Smart | 831 | 41.2 | -7.2 | |
Liberal Democrats | Neale Upstone | 393 | 19.5 | -14.2 | |
Independent | Ian Tyes | 287 | 14.2 | +14.2 | |
Conservative | Anette Karimi | 266 | 13.2 | +1.5 | |
Green | Michael Potter | 242 | 12.0 | +12.0 | |
Majority | |||||
Turnout | |||||
Labour gain from Liberal Democrats | Swing | ||||
Party | Candidate | Votes | % | ±% | |
---|---|---|---|---|---|
Labour | Dan Ratcliffe | 903 | 32.2 | +2.9 | |
Green | Maximillian Fries | 721 | 25.7 | +5.5 | |
Liberal Democrats | Colin Rosenstiel | 678 | 24.2 | -11.4 | |
Conservative | Alex Boyd | 500 | 17.8 | +2.9 | |
Majority | |||||
Turnout | |||||
Labour gain from Liberal Democrats | Swing | ||||
Party | Candidate | Votes | % | ±% | |
---|---|---|---|---|---|
Liberal Democrats | Rod Cantrill | 1,056 | 35.6 | -8.9 | |
Labour | Sam Wolfe | 987 | 33.3 | +2.2 | |
Green | Julia Harrison | 526 | 17.8 | +6.1 | |
Conservative | Joanna Anscombe-Bell | 395 | 13.3 | +0.5 | |
Majority | |||||
Turnout | 2,964 | ||||
Liberal Democrats hold | Swing | ||||
Party | Candidate | Votes | % | ±% | |
---|---|---|---|---|---|
Labour | Ann Sinnott | 1,280 | 27.1 | ||
Labour | Richard Robertson | 1,223 | 25.9 | ||
Liberal Democrats | Sarah Brown | 720 | 15.3 | ||
Green | Matthew Hodgkinson | 688 | 14.6 | ||
Liberal Democrats | David Grace | 317 | 6.7 | ||
Conservative | Daniel Coughlan | 262 | 5.6 | ||
Conservative | Linda Yeatman | 228 | 4.8 | ||
Majority | |||||
Turnout | |||||
Labour gain from Liberal Democrats | Swing | ||||
Labour hold | Swing | ||||
Party | Candidate | Votes | % | ±% | |
---|---|---|---|---|---|
Liberal Democrats | Tim Moore | 1,362 | 42.6 | +6.9 | |
Labour Co-op | John Beresford | 951 | 29.7 | -9.2 | |
Conservative | Vince Marino | 522 | 16.3 | -2.7 | |
Green | Joel Chalfen | 363 | 11.4 | +5.0 | |
Majority | |||||
Turnout | |||||
Liberal Democrats hold | Swing | ||||
Party | Candidate | Votes | % | ±% | |
---|---|---|---|---|---|
Labour | Dave Baigent | 1,205 | 41.6 | +8.6 | |
Liberal Democrats | Paul Saunders | 1,093 | 37.7 | -3.7 | |
Green | Megan Parry | 394 | 13.6 | +13.6 | |
Conservative | Simon Lee | 206 | 7.1 | 0.0 | |
Majority | |||||
Turnout | |||||
Labour gain from Liberal Democrats | Swing | ||||
Party | Candidate | Votes | % | ±% | |
---|---|---|---|---|---|
Liberal Democrats | Nicholas Avery | 1,066 | 46.2 | +13.6 | |
Conservative | Richard Jeffs | 802 | 34.8 | -1.8 | |
Labour Co-op | Tim Sykes | 440 | 19.1 | +2.8 | |
Majority | |||||
Turnout | |||||
Liberal Democrats hold | Swing | ||||
Party | Candidate | Votes | % | ±% | |
---|---|---|---|---|---|
Liberal Democrats | Ysanne Austin | 1,294 | 39.6 | +2.9 | |
Labour | Mike Sargeant | 1,275 | 39.0 | +6.2 | |
Conservative | James Strachan | 353 | 10.8 | -5.5 | |
Green | Shayne Mitchell | 347 | 10.6 | -3.6 | |
Majority | |||||
Turnout | |||||
Liberal Democrats hold | Swing | ||||
A by-election was called due to the resignation of the incumbent Labour Party councillor Sue Birtles.
Party | Candidate | Votes | % | ±% | |
---|---|---|---|---|---|
Liberal Democrats | Viki Sanders | 933 | 36.5 | -6.1 | |
Labour | Rahima Ahammed | 790 | 30.9 | +1.2 | |
Conservative | Andrew Bower | 614 | 24.0 | +7.7 | |
Green | Joel Chalfen | 222 | 8.7 | -2.7 | |
Majority | 143 | 5.6 | |||
Turnout | 2,559 | ||||
Liberal Democrats gain from Labour | Swing | 3.7 | |||
Sefton Council is the governing body for the Metropolitan Borough of Sefton in the county of Merseyside, north-western England. The council was under no overall control from the 1980s until 2012 when the Labour Party took control. It is a constituent council of Liverpool City Region Combined Authority.
Elections for Cambridge City Council were held on Thursday 5 May 2011. As the council is elected by thirds, one seat in each of the wards was up for election, with the exception of Cherry Hinton ward where two seats were up for election due to the early retirement of Councillor Stuart Newbold. The vote took place alongside the 2011 United Kingdom Alternative Vote referendum and a Cambridgeshire County Council by-election for Arbury ward.
Elections for Cambridge City Council were held on Thursday 3 May 2012. One third of the council was up for election and the Liberal Democrats lost overall control of the council, to No Overall Control.
An election to Cambridgeshire County Council took place on 2 May 2013 as part of the 2013 United Kingdom local elections. 69 councillors were elected from 60 electoral divisions, which returned either one or two county councillors each by first-past-the-post voting for a four-year term of office. The electoral divisions were the same as those used at the previous election in 2009. No elections were held in Peterborough, which is a unitary authority outside the area covered by the County Council. The election saw the Conservative Party lose overall control of the council.
The 2014 St Albans City and District Council election took place on 22 May 2014 to elect members of St Albans District Council in Hertfordshire, England. One third of the council was up for election and the council stayed under no overall control.
The 2014 Westminster City Council election took place on 22 May 2014 to elect members of Westminster City Council in England. This was on the same day as other local elections.
The 2014 Birmingham City Council election took place on 22 May 2014 to elect members of Birmingham City Council in England. This was on the same day as other local elections.
The 2014 Newcastle City Council election took place on 22 May 2014 to elect members of Newcastle City Council in England. This was on the same day as other local elections.
The 2014 Peterborough City Council election took place on 22 May 2014 to elect members of Peterborough City Council in England. This was on the same day as other local elections.
The 2014 Plymouth City Council election took place on 22 May 2014 to elect members of Plymouth City Council in England. This was on the same day as other local elections. The election was won by the Labour Party, who maintained their overall majority. The UK Independence Party gained representation on the council for the first time, and this was the only election in which the party won seats in Plymouth.
The 2011 Huntingdonshire District Council election took place on 5 May 2011 to elect members of Huntingdonshire District Council in Cambridgeshire, England. One third of the council was up for election and the Conservative Party stayed in overall control of the council.
The 2012 Huntingdonshire District Council election took place on 3 May 2012 to elect members of Huntingdonshire District Council in Cambridgeshire, England. One third of the council was up for election and the Conservative Party stayed in overall control of the council.
The 2008 Castle Point Borough Council election took place on 1 May 2008 to elect members of Castle Point Borough Council in Essex, England. One third of the council was up for election and the Conservative party stayed in overall control of the council.
The 2014 Carlisle City Council election took place on 22 May 2014 to elect members of Carlisle District Council in Cumbria, England. One third of the council was up for election and the Labour Party stayed in overall control of the council.
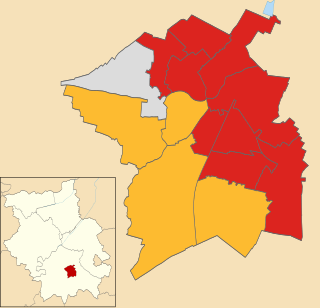
The 2016 Cambridge City Council election took place on 5 May 2016 to elect members of Cambridge City Council in England. This was on the same day as other nationwide local elections. The Labour Party grouping gained two seats from the Liberal Democrats, increasing their majority on the council from 6 to 10 seats.
The 2018 United Kingdom local elections were held on Thursday 3 May 2018, with local council elections taking place in all 32 London boroughs, 34 metropolitan boroughs, 67 district and borough councils and 17 unitary authorities. There were also direct elections for the mayoralties of Hackney, Lewisham, Newham, Tower Hamlets and Watford.
The 2018 Norwich City Council election took on 3 May 2018 to elect members of Norwich City Council in England. This was on the same day as other local elections. 13 of 39 seats (one-third) were up for election.
The 2018 Plymouth City Council election took place on 3 May 2018 to elect members of Plymouth City Council in England. The election was won by the Labour Party, who gained enough seats to achieve an overall majority and took control of the council.
The 2018 Oxford City Council election took place on 3 May 2018, to elect 24 of the 48 members of Oxford City Council in England. This was on the same day as other local elections in England. Each of Oxford's 24 wards elected one councillor, with the other seat in each ward next due for election in May 2020.
The 2021 Cambridgeshire County Council election took place on 6 May 2021 as part of the 2021 local elections in the United Kingdom. All 61 councillors were elected from 59 electoral divisions, which returned either one or two county councillors each by first-past-the-post voting for a four-year term of office. The election was held alongside a full election for Cambridge City Council, the Cambridgeshire Police and Crime Commissioner, Mayor of Cambridgeshire and Peterborough and one-third of Peterborough City Council.