The 2003 Cambridge City Council election took place on 1 May 2003 to elect members of Cambridge City Council in England. [1] This was on the same day as other nationwide local elections.
2003 Cambridge City Council election | ||||||||||
---|---|---|---|---|---|---|---|---|---|---|
Party | This election | Full council | This election | |||||||
Seats | Net | Seats % | Other | Total | Total % | Votes | Votes % | +/− | ||
Liberal Democrats | 11 | ![]() | 64.7 | 14 | 25 | 59.5 | 12,896 | 41.2 | +0.6 | |
Labour | 6 | ![]() | 35.3 | 9 | 15 | 35.7 | 8,183 | 26.1 | -3.0 | |
Conservative | 0 | ![]() | 0.0 | 2 | 2 | 4.8 | 7,366 | 23.5 | +2.2 | |
Green | 0 | ![]() | 0.0 | 0 | 0 | 0.0 | 2,491 | 8.0 | +0.7 | |
UKIP | 0 | ![]() | 0.0 | 0 | 0 | 0.0 | 243 | 0.8 | ±0.0 | |
Socialist Alliance | 0 | ![]() | 0.0 | 0 | 0 | 0.0 | 137 | 0.4 | -0.1 |
Party | Candidate | Votes | % | ±% | |
---|---|---|---|---|---|
Labour | John Durrant | 502 | 55.2 | -3.4 | |
Conservative | Vivian Ellis | 195 | 21.4 | +2.9 | |
Liberal Democrats | Thomas Yates | 142 | 15.6 | +4.0 | |
Green | John Collins | 71 | 7.8 | +1.6 | |
Majority | 307 | 33.7 | -6.4 | ||
Turnout | 910 | 19.2 | -1.4 | ||
Labour hold | Swing | ![]() | |||
Party | Candidate | Votes | % | ±% | |
---|---|---|---|---|---|
Liberal Democrats | Rhodri James | 739 | 36.4 | +7.7 | |
Labour | Ian Kidman | 689 | 33.9 | -7.1 | |
Conservative | Robert Boorman | 535 | 26.3 | +0.9 | |
Green | Peter Pope | 70 | 3.4 | -0.2 | |
Majority | 50 | 2.5 | |||
Turnout | 2,033 | 39.8 | ±0.0 | ||
Liberal Democrats hold | Swing | ![]() | |||
Party | Candidate | Votes | % | ±% | |
---|---|---|---|---|---|
Liberal Democrats | David Howarth | 1,226 | 58.2 | +6.8 | |
Conservative | Rhona Boorman | 445 | 21.1 | +0.1 | |
Labour | Gillian Richardson | 271 | 12.9 | -6.0 | |
Green | Stephen Lawrence | 163 | 7.7 | -0.9 | |
Majority | 781 | 37.1 | +6.7 | ||
Turnout | 2,105 | 30.1 | -0.9 | ||
Liberal Democrats hold | Swing | ![]() | |||
Party | Candidate | Votes | % | ±% | |
---|---|---|---|---|---|
Labour | Robert Dryden | 1,072 | 43.3 | +3.5 | |
Conservative | Justin Hinchcliffe | 1,021 | 41.2 | -8.1 | |
Liberal Democrats | Geoffrey Heathcock | 311 | 12.6 | +4.4 | |
Green | Shayne Mitchell | 73 | 2.9 | +0.2 | |
Majority | 51 | 2.1 | |||
Turnout | 2,477 | 45.8 | +1.7 | ||
Labour hold | Swing | ![]() | |||
Party | Candidate | Votes | % | ±% | |
---|---|---|---|---|---|
Labour | Berni Callaghan | 742 | 41.1 | -9.5 | |
Conservative | Martin Hall | 571 | 31.6 | +7.1 | |
Liberal Democrats | Laura Doherty | 254 | 14.1 | -0.3 | |
Green | Richard Rippin | 95 | 5.3 | +0.2 | |
Socialist Alliance | Simon Sedgwick-Jell | 74 | 4.1 | +1.6 | |
UKIP | Albert Watts | 70 | 3.9 | +1.0 | |
Majority | 171 | 9.5 | -16.6 | ||
Turnout | 1,806 | 31.1 | -0.6 | ||
Labour hold | Swing | ![]() | |||
Party | Candidate | Votes | % | ±% | |
---|---|---|---|---|---|
Liberal Democrats | Donald Adey | 912 | 40.8 | +0.3 | |
Labour | Patricia Johnston | 756 | 33.8 | -1.9 | |
Conservative | Mamunur Rashid | 332 | 14.8 | +1.5 | |
Green | Neil Hewett | 157 | 7.0 | +1.6 | |
UKIP | Marjorie Barr | 79 | 3.5 | -1.7 | |
Majority | 156 | 7.0 | +2.2 | ||
Turnout | 2,236 | 31.6 | -2.3 | ||
Liberal Democrats gain from Labour | Swing | ![]() | |||
Party | Candidate | Votes | % | ||
---|---|---|---|---|---|
Labour | Elizabeth Hughes | 473 | 50.1 | ||
Labour | Louise Downham | 438 | 46.3 | ||
Conservative | Hugh Mennie | 214 | 22.6 | ||
Conservative | Cyril Weinman | 202 | 21.4 | ||
Liberal Democrats | Evelyn Bradford | 182 | 19.3 | ||
Liberal Democrats | Jonathan Monroe | 129 | 13.7 | ||
Green | Gerhard Goldbeck-Wood | 95 | 10.1 | ||
Turnout | 945 | 19.7 | |||
Labour hold | |||||
Labour hold |
Party | Candidate | Votes | % | ±% | |
---|---|---|---|---|---|
Liberal Democrats | Michael Dixon | 817 | 56.7 | -0.3 | |
Conservative | James Orpin | 240 | 16.7 | +1.2 | |
Green | Martin Lucas-Smith | 213 | 14.8 | +2.7 | |
Labour | Paul Sales | 171 | 11.9 | -3.5 | |
Majority | 577 | 40.0 | -1.5 | ||
Turnout | 1,441 | 21.6 | -1.1 | ||
Liberal Democrats hold | Swing | ![]() | |||
Party | Candidate | Votes | % | ±% | |
---|---|---|---|---|---|
Liberal Democrats | Julie Smith | 987 | 54.3 | -1.2 | |
Conservative | Laurence Tailby | 334 | 18.4 | +2.5 | |
Labour | Miriam Lynn | 257 | 14.1 | -4.1 | |
Green | Anna Gomori-Woodcock | 239 | 13.2 | +3.9 | |
Majority | 653 | 35.9 | -1.4 | ||
Turnout | 1,817 | 23.6 | -3.0 | ||
Liberal Democrats hold | Swing | ![]() | |||
Party | Candidate | Votes | % | ±% | |
---|---|---|---|---|---|
Labour | Patricia Wright | 738 | 35.9 | -4.5 | |
Liberal Democrats | Kevin Wilkins | 604 | 29.3 | +5.0 | |
Green | Margaret Wright | 481 | 23.4 | +1.9 | |
Conservative | Daniel Whant | 235 | 11.4 | +0.6 | |
Majority | 134 | 6.5 | -9.6 | ||
Turnout | 2,058 | 26.5 | -4.1 | ||
Labour hold | Swing | ![]() | |||
Party | Candidate | Votes | % | ±% | |
---|---|---|---|---|---|
Liberal Democrats | Alan Baker | 1,497 | 63.8 | +4.0 | |
Conservative | Keith Henry | 395 | 16.8 | -1.2 | |
Labour | Susan Rosser | 242 | 10.3 | -2.8 | |
Green | Robert Milsom | 119 | 5.1 | -1.0 | |
UKIP | Helene Davies | 94 | 4.0 | +1.0 | |
Majority | 1,102 | 47.0 | |||
Turnout | 2,347 | 38.7 | -2.7 | ||
Liberal Democrats hold | Swing | ![]() | |||
Party | Candidate | Votes | % | ±% | |
---|---|---|---|---|---|
Liberal Democrats | Iain Coleman | 892 | 43.8 | -1.0 | |
Labour | Paul Gilchrist | 789 | 38.8 | -1.3 | |
Green | Vicky Russell | 146 | 7.2 | -1.8 | |
Conservative | Richard Normington | 145 | 7.1 | +1.0 | |
Socialist Alliance | Diana Minns | 63 | 3.1 | N/A | |
Majority | 103 | 5.0 | +0.3 | ||
Turnout | 2,035 | 34.0 | -1.9 | ||
Liberal Democrats gain from Labour | Swing | ![]() | |||
Party | Candidate | Votes | % | ||
---|---|---|---|---|---|
Liberal Democrats | Philippa Slatter | 1,225 | 50.4 | ||
Liberal Democrats | Edrich Adigun-Harris | 1,126 | 46.3 | ||
Conservative | Hannah Towns | 949 | 39.0 | ||
Conservative | Steven George | 914 | 37.6 | ||
Green | Neil Ford | 181 | 7.4 | ||
Labour | David Coulson | 150 | 6.2 | ||
Labour | Jonathan Goodacre | 135 | 5.6 | ||
Turnout | 2,432 | 40.4 | |||
Liberal Democrats hold | |||||
Liberal Democrats hold |
Party | Candidate | Votes | % | ||
---|---|---|---|---|---|
Liberal Democrats | Max Boyce | 941 | 50.2 | ||
Liberal Democrats | Nichola Harrison | 912 | 48.6 | ||
Labour | Mick Brown | 390 | 20.8 | ||
Labour | Michael Sargeant | 368 | 19.6 | ||
Conservative | James Strachan | 341 | 18.2 | ||
Conservative | Graham Palmer | 298 | 15.9 | ||
Green | Sarah Peake | 233 | 12.4 | ||
Green | Stephen Peake | 155 | 8.3 | ||
Turnout | 1,875 | 30.9 | |||
Liberal Democrats hold | |||||
Liberal Democrats hold |
Cambridge is a city in Middlesex County, Massachusetts, and part of the Boston metropolitan area. At the 2020 U.S. Census, the city's population was 118,403, making it the fourth most populous city in the state, behind Boston, Worcester, and Springfield. It is one of two de jure county seats of Middlesex County, although the county's executive government was abolished in 1997. Situated directly north of Boston, across the Charles River, it was named in honor of the University of Cambridge in England, once also an important center of the Puritan theology embraced by the town's founders.
South Cambridgeshire is a local government district of Cambridgeshire, England, with a population of 148,755 at the 2011 census. It was formed on 1 April 1974 by the merger of Chesterton Rural District and South Cambridgeshire Rural District. It completely surrounds the city of Cambridge, which is administered separately from the district by Cambridge City Council.
One third of Cambridge City Council is elected each year, followed by one year without election.
Cambridge City Council is a district council in the county of Cambridgeshire, which governs the City of Cambridge.
Elections for Cambridge City Council were held on Thursday 4 May 2006. As Cambridge City Council is elected by thirds, one seat in each of the city's 14 wards was up for election. The exception was Romsey, where two seats were up for election as a by-election for the other seat was held on the same day. Therefore, 15 of the 42 seats on the council were up for election. Overall turnout was 34.4%, down from 37.0% in 2004. The lowest turnout (28.4%) was in Abbey ward and the highest (40.8%) in Queen Edith's.
The United States Senate election of 1948 in Massachusetts was held on November 2, 1948, with Republican incumbent Leverett Saltonstall defeating his challengers.
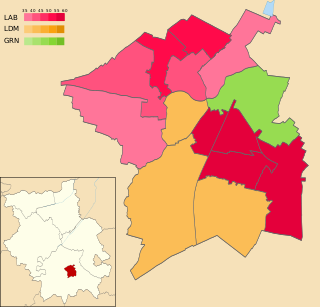
Elections for Cambridge City Council were held on Thursday 5 May 2011. As the council is elected by thirds, one seat in each of the wards was up for election, with the exception of Cherry Hinton ward where two seats were up for election due to the early retirement of Councillor Stuart Newbold. The vote took place alongside the 2011 United Kingdom Alternative Vote referendum and a Cambridgeshire County Council by-election for Arbury ward.
Elections for Cambridge City Council were held on Thursday 3 May 2012. One third of the council was up for election and the Liberal Democrats lost overall control of the council, to No Overall Control.
The 2014 Cambridge City Council election took place on 22 May 2014 to elect members of Cambridge City Council in England. This was on the same day as other local elections and the European Union elections.
Julie Elizabeth Smith, Baroness Smith of Newnham is an academic specialising in European politics and a Liberal Democrat politician. From 2003 to 2015, she was a local councillor on Cambridge City Council. Since September 2014, she has been a life peer and a member of the House of Lords.
The 2015 Cambridge City Council election took place on 7 May 2015 to elect members of Cambridge City Council in England as part of the English local elections of that year coinciding with the 2015 General Election.
The 2016 Cambridge City Council election took place on 5 May 2016 to elect members of Cambridge City Council in England. This was on the same day as other nationwide local elections. The Labour Party grouping gained two seats from the Liberal Democrats, increasing their majority on the council from 6 to 10 seats.
Doug Craig is a Canadian politician, who served as mayor of Cambridge, Ontario from 2000 to 2018. He was defeated in the 2018 municipal election, and was succeeded on December 1 by Kathryn McGarry.
The 2019 Cambridge City Council election took place on 2 May 2019 to elect members of Cambridge City Council in England. This was on the same day as other nationwide local elections.
The 2021 Cambridgeshire County Council election took place on 6 May 2021 as part of the 2021 local elections in the United Kingdom. All 61 councillors were elected from 59 electoral divisions, which returned either one or two county councillors each by first-past-the-post voting for a four-year term of office. The election was held alongside a full election for Cambridge City Council, the Cambridgeshire Police and Crime Commissioner, Mayor of Cambridgeshire and Peterborough and one-third of Peterborough City Council.
The 2021 Cambridge City Council election took place on 6 May 2021 to elect members of Cambridge City Council in England. This was on the same day as other nationwide local elections.
The 2002 Cambridge City Council election took place on 2 May 2002 to elect members of Cambridge City Council in England. This was on the same day as other nationwide local elections.
The 2007 Cambridge City Council election took place on 3 May 2007 to elect members of Cambridge City Council in England. This was on the same day as other nationwide local elections.
The 2008 Cambridge City Council election took place on 1 May 2008 to elect members of Cambridge City Council in England. This was on the same day as other nationwide local elections.
The 2022 Cambridge City Council election took place on 5 May 2022 to elect members of Cambridge City Council. This is on the same day as other local elections.