The 2003 Mid Sussex District Council election took place on 1 May 2003 to elect members of Mid Sussex District Council in England. [1] It was held on the same day as other local elections. The Conservatives won a majority of one on the council.
| |||||||||||||||||||||||||||||||||
All 54 seats to Mid Sussex District Council 28 seats needed for a majority | |||||||||||||||||||||||||||||||||
---|---|---|---|---|---|---|---|---|---|---|---|---|---|---|---|---|---|---|---|---|---|---|---|---|---|---|---|---|---|---|---|---|---|
| |||||||||||||||||||||||||||||||||
Winner of each seat |
After the election, the composition of the council was:
28 | 24 | 2 |
Con | LDem | Lab |
Party | Seats | Gains | Losses | Net gain/loss | Seats % | Votes % | Votes | +/− | |
---|---|---|---|---|---|---|---|---|---|
Conservative | 28 | 1 | 51.9 | 53.4 | 30,973 | ||||
Liberal Democrats | 24 | 3 | 44.4 | 40.1 | 23,289 | ||||
Labour | 2 | 3.7 | 5.2 | 3,036 | |||||
Green | 0 | 0.0 | 0.7 | 381 | |||||
Independent | 0 | 2 | 0.0 | 0.5 | 300 | ||||
Monster Raving Loony | 0 | 0.0 | 0.1 | 36 | |||||
Party | Candidate | Votes | % | ±% | |
---|---|---|---|---|---|
Conservative | Gary Marsh | 868 | 72.6 | ||
Conservative | Andrew MacNaughton | 706 | |||
Liberal Democrats | Donald Morrison | 328 | 27.4 | ||
Liberal Democrats | Ben Ross | 222 | |||
Turnout | |||||
Conservative win (new seat) | |||||
Conservative win (new seat) |
Party | Candidate | Votes | % | ±% | |
---|---|---|---|---|---|
Liberal Democrats | Stephen Barnett | 485 | 67.5 | ||
Conservative | John Saull | 234 | 32.5 | ||
Turnout | |||||
Liberal Democrats win (new seat) |
Party | Candidate | Votes | % | ±% | |
---|---|---|---|---|---|
Conservative | Susan Seward | 603 | 74.4 | -3.9 | |
Liberal Democrats | Anna Hodgetts | 112 | 13.8 | +4.0 | |
Labour | Dawn Houghton | 59 | 7.3 | -4.6 | |
Monster Raving Loony | Baron von Thunderclap | 36 | 4.4 | +4.4 | |
Turnout | |||||
Conservative hold | Swing | ||||
Party | Candidate | Votes | % | ±% | |
---|---|---|---|---|---|
Conservative | Suzanne Cosgrave | 453 | 53.7 | ||
Conservative | Andrew Barrett-Miles | 449 | |||
Liberal Democrats | David Drew | 391 | 46.3 | ||
Liberal Democrats | Betty Davies | 382 | |||
Turnout | |||||
Conservative win (new seat) | |||||
Conservative win (new seat) |
Party | Candidate | Votes | % | ±% | |
---|---|---|---|---|---|
Liberal Democrats | Heather Ross | 909 | 56.1 | +11.9 | |
Conservative | Michael Sullivan | 712 | 43.9 | -1.3 | |
Conservative | Barbara Selby | 645 | |||
Turnout | |||||
Liberal Democrats gain from Conservative | Swing | ||||
Conservative hold | Swing | ||||
Party | Candidate | Votes | % | ±% | |
---|---|---|---|---|---|
Liberal Democrats | Gillian Balsdon | 711 | 71.2 | ||
Liberal Democrats | Anne Jones | 711 | |||
Conservative | Peter Burgess | 288 | 28.8 | ||
Conservative | Alfred May | 235 | |||
Turnout | |||||
Liberal Democrats win (new seat) | |||||
Liberal Democrats win (new seat) |
Party | Candidate | Votes | % | ±% | |
---|---|---|---|---|---|
Liberal Democrats | Kathleen Dumbovic | 690 | 66.5 | ||
Liberal Democrats | Patrick Cutler | 626 | |||
Conservative | John Boulter | 348 | 33.5 | ||
Conservative | Julian Wadey | 324 | |||
Turnout | |||||
Liberal Democrats win (new seat) | |||||
Liberal Democrats win (new seat) |
Party | Candidate | Votes | % | ±% | |
---|---|---|---|---|---|
Liberal Democrats | David Shevels | 563 | 63.1 | -0.9 | |
Liberal Democrats | Diane Shevels | 522 | |||
Conservative | Jacqueline Landriani | 329 | 36.9 | +13.1 | |
Turnout | |||||
Liberal Democrats hold | Swing | ||||
Party | Candidate | Votes | % | ±% | |
---|---|---|---|---|---|
Liberal Democrats | Graham Knight | 471 | 61.2 | ||
Liberal Democrats | Lyn Williams | 451 | |||
Conservative | Edward Holland | 299 | 38.8 | ||
Conservative | Geraldine May | 289 | |||
Turnout | |||||
Liberal Democrats win (new seat) | |||||
Liberal Democrats win (new seat) |
Party | Candidate | Votes | % | ±% | |
---|---|---|---|---|---|
Conservative | Martin Forde | Unopposed | |||
Conservative | Edward Livesey | Unopposed | |||
Turnout | N/A | ||||
Conservative hold | Swing | ||||
Party | Candidate | Votes | % | ±% | |
---|---|---|---|---|---|
Conservative | Phillip Coote | 804 | 56.8 | ||
Conservative | Ian Scotland | 795 | |||
Conservative | Julian Calvert | 794 | |||
Liberal Democrats | Andrew Fynn | 612 | 43.2 | ||
Liberal Democrats | Felicity Bunting | 603 | |||
Liberal Democrats | Janette Wilson | 530 | |||
Turnout | |||||
Conservative win (new seat) | |||||
Conservative win (new seat) |
Party | Candidate | Votes | % | ±% | |
---|---|---|---|---|---|
Conservative | David King | 717 | 55.2 | -11.0 | |
Conservative | Brenda Binge | 687 | |||
Independent | Peter Davis | 300 | 23.1 | +23.1 | |
Liberal Democrats | Marianne Griffin | 281 | 21.6 | +1.7 | |
Liberal Democrats | Mira McMichael | 255 | |||
Turnout | |||||
Conservative hold | Swing | ||||
Party | Candidate | Votes | % | ±% | |
---|---|---|---|---|---|
Liberal Democrats | Roland Lord | 541 | 55.4 | ||
Liberal Democrats | Paul Johnson | 536 | |||
Conservative | Margaret Ball | 435 | 44.6 | ||
Conservative | Matthew Madgwick | 427 | |||
Turnout | |||||
Liberal Democrats win (new seat) | |||||
Liberal Democrats win (new seat) |
Party | Candidate | Votes | % | ±% | |
---|---|---|---|---|---|
Liberal Democrats | Deborah Adams | 506 | 58.0 | ||
Liberal Democrats | Bernard Gillbard | 502 | |||
Conservative | Sally Beal | 366 | 42.0 | ||
Conservative | hillip Coote | 314 | |||
Turnout | |||||
Liberal Democrats win (new seat) | |||||
Liberal Democrats win (new seat) |
Party | Candidate | Votes | % | ±% | |
---|---|---|---|---|---|
Liberal Democrats | David Heasman | 631 | 50.2 | ||
Liberal Democrats | Ian Dixon | 626 | |||
Conservative | Edward Belsey | 626 | 49.8 | ||
Conservative | Andrew Lea | 563 | |||
Turnout | |||||
Liberal Democrats win (new seat) | |||||
Liberal Democrats win (new seat) |
Second seat decided on drawing of lots due to second and third place getting the same number of votes. Ian Dixon, the Liberal Democrat won therefore Edward Belsey was not elected.
Party | Candidate | Votes | % | ±% | |
---|---|---|---|---|---|
Liberal Democrats | Jean Glynn | 624 | 57.4 | ||
Liberal Democrats | Barry Starmer | 565 | |||
Conservative | Allan Beal | 464 | 42.6 | ||
Conservative | Brian Sparkes | 429 | |||
Turnout | |||||
Liberal Democrats win (new seat) | |||||
Liberal Democrats win (new seat) |
Party | Candidate | Votes | % | ±% | |
---|---|---|---|---|---|
Liberal Democrats | James Joyce-Nelson | 258 | 60.7 | ||
Liberal Democrats | Edward Matthews | 254 | |||
Conservative | Margaret Belsey | 167 | 39.3 | ||
Turnout | |||||
Liberal Democrats win (new seat) | |||||
Liberal Democrats win (new seat) |
Party | Candidate | Votes | % | ±% | |
---|---|---|---|---|---|
Conservative | Peter Martin | 1,263 | 54.9 | ||
Conservative | Gordon Marples | 1,224 | |||
Conservative | Patrick Shanahan | 1,164 | |||
Liberal Democrats | Nigel Cook | 811 | 35.2 | ||
Liberal Democrats | Jonathan Kemp | 768 | |||
Liberal Democrats | Stephen Mulligan | 729 | |||
Labour | Jennifer Epstein | 227 | 9.9 | ||
Labour | Arleene Piercy | 212 | |||
Labour | Stephen Lewis | 187 | |||
Turnout | |||||
Conservative win (new seat) | |||||
Conservative win (new seat) |
Party | Candidate | Votes | % | ±% | |
---|---|---|---|---|---|
Liberal Democrats | Brian Hall | 748 | 63.2 | +7.0 | |
Liberal Democrats | Richard Bates | 742 | |||
Conservative | Gerald Madden | 435 | 36.8 | +13.2 | |
Conservative | Rodney Ransom | 413 | |||
Turnout | |||||
Liberal Democrats hold | Swing | ||||
Party | Candidate | Votes | % | ±% | |
---|---|---|---|---|---|
Labour | Paddy Henry | 633 | 55.3 | -7.1 | |
Labour | Richard Goddard | 609 | |||
Conservative | Clare Steele | 325 | 28.4 | +6.6 | |
Conservative | James Horsman | 322 | |||
Liberal Democrats | John Riddington | 186 | 16.3 | +0.5 | |
Liberal Democrats | Philip Brown | 172 | |||
Turnout | |||||
Labour hold | Swing | ||||
Party | Candidate | Votes | % | ±% | |
---|---|---|---|---|---|
Conservative | Clive Chapman | 548 | 54.2 | +14.8 | |
Conservative | Ian Ellis | 521 | |||
Liberal Democrats | Paul Lucraft | 330 | 32.6 | +3.6 | |
Liberal Democrats | Anthony Mercer | 324 | |||
Labour | Denis Nyman | 134 | 13.2 | -18.4 | |
Labour | Pascal Atkins | 133 | |||
Turnout | |||||
Conservative hold | Swing | ||||
Party | Candidate | Votes | % | ±% | |
---|---|---|---|---|---|
Liberal Democrats | Irene Wilkins | 789 | 56.5 | +8.1 | |
Liberal Democrats | Julia Brown | 774 | |||
Conservative | Margaret Baker | 608 | 43.5 | +5.2 | |
Conservative | Timothy Hartley | 604 | |||
Turnout | |||||
Liberal Democrats hold | Swing | ||||
Party | Candidate | Votes | % | ±% | |
---|---|---|---|---|---|
Conservative | Terence Gillard | 695 | 53.8 | ||
Conservative | Derek Booker | 642 | |||
Liberal Democrats | Irene Balls | 597 | 46.2 | ||
Liberal Democrats | Elizabeth Rodgers | 493 | |||
Turnout | |||||
Conservative win (new seat) | |||||
Conservative win (new seat) |
Party | Candidate | Votes | % | ±% | |
---|---|---|---|---|---|
Conservative | Christine Field | 775 | 44.6 | ||
Conservative | Christopher Hersey | 591 | |||
Liberal Democrats | Patricia Webster | 581 | 33.4 | ||
Green | Paul Brown | 381 | 21.9 | ||
Liberal Democrats | Leslie Camplisson | 347 | |||
Turnout | |||||
Conservative win (new seat) | |||||
Conservative win (new seat) |
Party | Candidate | Votes | % | ±% | |
---|---|---|---|---|---|
Conservative | Susanna Kemp | 1,136 | 46.6 | ||
Conservative | David Hampson | 1,084 | |||
Conservative | James Worsley | 1,030 | |||
Liberal Democrats | Rodney Jackson | 827 | 33.9 | ||
Labour | Ann Morgan | 474 | 19.5 | ||
Labour | Malcolm Uhlhorn | 368 | |||
Turnout | |||||
Conservative win (new seat) | |||||
Conservative win (new seat) |
Party | Candidate | Votes | % | ±% | |
---|---|---|---|---|---|
Conservative | Margaret Hersey | 1,101 | 54.7 | ||
Conservative | George Snowling | 1,093 | |||
Conservative | Mark Sharman | 1,029 | |||
Liberal Democrats | Anne-Marie Lucraft | 910 | 45.3 | ||
Liberal Democrats | Cyril Povey | 824 | |||
Liberal Democrats | Gillian House | 807 | |||
Turnout | |||||
Conservative win (new seat) | |||||
Conservative win (new seat) |
Mid Sussex is a local government district in West Sussex, England. The largest town is Haywards Heath, where the council is based. The district also contains the towns of Burgess Hill and East Grinstead plus surrounding rural areas, including many villages. The district includes part of the South Downs National Park and part of the designated Area of Outstanding Natural Beauty of High Weald, including sections of Ashdown Forest. The district contains most headwaters of the River Ouse. Its largest body of water is Ardingly reservoir which is used by watersports clubs. At the 2021 census the district had a population of 152,949.
Lewes District Council in East Sussex, England is elected every four years. Since the last boundary changes in 2019, 41 councillors are elected from 21 wards.
Half of Adur District Council in West Sussex, England is elected every two years. Until 2003, the council was elected by thirds. Since the last boundary changes in 2004, 29 councillors have been elected from 14 wards.
Chichester District Council in West Sussex, England is elected every four years. Since the last boundary changes in 2019, 36 councillors have been elected from 21 wards.
West Sussex County Council in England is elected every four years.
Mid Sussex District Council is elected every four years.
East Sussex County Council is the upper tier local authority for the non-metropolitan county of East Sussex in England.
Horsham District Council in West Sussex, England, is elected every four years.
West Sussex County Council is the upper tier local authority for the non-metropolitan county of West Sussex in England.
The 2003 Wealden District Council election took place on 1 May 2003 to elect members of Wealden District Council in East Sussex, England. The whole council was up for election with boundary changes since the last election in 1999 reducing the number of seats by 3. The Conservative Party stayed in overall control of the council.
The 2007 Wealden District Council election took place on 3 May 2007 to elect members of Wealden District Council in East Sussex, England. The whole council was up for election and the Conservative Party stayed in overall control of the council.
The 2012 North East Lincolnshire Council election took place on 3 May 2012 to elect members of North East Lincolnshire Council in England. This was on the same day as other 2012 United Kingdom local elections.
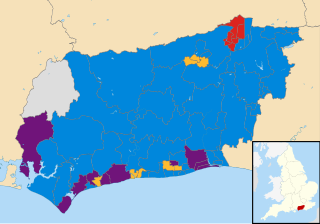
The West Sussex County Council election, 2013 took place on 2 May 2013, as part of the 2013 United Kingdom local elections. All 71 electoral divisions were up for election, which returned one county councillor each by first-past-the-post voting for a four-year term of office. At this election, the Conservative Party was seeking to retain overall control of the council, and the Liberal Democrats to maintain their position as the main opposition party.
The 2015 Mid Sussex District Council election took place on 7 May 2015 to elect members of the Mid Sussex District Council in England. It was held on the same day as other local elections.
The 2015 Rother District Council election took place on 7 May 2015 to elect members of Rother District Council in East Sussex, England. The whole council was up for election and the Conservative Party stayed in overall control of the council.
The 2017 West Sussex County Council election took place as part of the 2017 local elections in the UK. All councillors were elected for single-member electoral divisions for a four-year term. The voting system used was first-past-the-post.
Elections to Mid Bedfordshire District Council were held in May 2007. These were the last elections to council, with all 53 seats being up for election. Councillors elected would serve a two-year term, expiring in 2009, when Mid Bedfordshire District Council was replaced by Central Bedfordshire Council. The Conservative Party retained overall control of the council, winning 37 of 53 seats on the council. The Conservatives won 8 seats unopposed, as did an Independent candidate in one ward.
Elections to Mid Bedfordshire District Council were held on 1 May 2003. All 53 seats were up for election. Councillors elected would serve a four-year term, expiring in 2007. The Conservative Party retained overall control of the council, winning 37 of 53 seats on the council. The Conservatives won 7 seats unopposed.
Daisy Cooper is a British Liberal Democrat politician who has served as the Member of Parliament (MP) for St Albans since 2019. She has served as the Deputy Leader of the Liberal Democrats since 2020, and as the Liberal Democrat spokesperson for Health, Wellbeing and Social Care since 2021.
The 2007 Mid Sussex District Council election took place on 3 May 2007 to elect members of Mid Sussex District Council in England. It was held on the same day as other local elections.