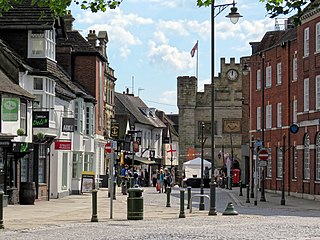
Horsham is a local government district in West Sussex, England. It is named after the town of Horsham, which is its largest settlement and where the council is based. The district also includes the surrounding rural area and contains many villages, the largest of which are Southwater and Billingshurst. The district includes part of the South Downs National Park and part of the designated Area of Outstanding Natural Beauty of High Weald. At the 2021 census the district had a population of 147,487.

Crawley is a constituency in West Sussex represented in the House of Commons of the UK Parliament since 2024 by Peter Lamb of the Labour Party.

Horsham is a constituency represented in the House of Commons of the UK Parliament, centred on the eponymous town in West Sussex. The seat was won in 2024 by John Milne of the Liberal Democrats, making it the first time since 1876 that a non-Conservative Party candidate has held the seat.
An election to Slough Borough Council was held on 10 June 2004. The whole council was up for election. This was the 120th Slough general local authority election, since Slough became a local government unit in 1863, including both whole Council elections and elections by thirds.

Horsham District Council in West Sussex, England, is elected every four years.

The 1983 Bolton Metropolitan Borough Council election took place on 5 May 1983 to elect members of Bolton Metropolitan Borough Council in Greater Manchester, England. One third of the council was up for election and the Labour Party kept overall control of the council
The 2015 Horsham District Council election took place on 7 May 2015 to elect members of Horsham District Council in England. It was held on the same day as other local elections and the 2015 United Kingdom general election. The Conservatives secured a majority of 17, which was the largest majority any party has ever achieved at a Horsham District Council election.

Sir Jeremy Mark Quin is a British Conservative politician who served as the Member of Parliament (MP) for Horsham from 2015–2024. He served as Minister of State for Defence Procurement from February 2020 to September 2022 before briefly serving as Minister of State for Crime, Policing and Fire during which time he oversaw security arrangements for Queen Elizabeth II's funeral.

The 2019 Horsham District Council election took place on 2 May 2019 to elect members of Horsham District Council in England. It was held on the same day as other local elections. Every seat was contested and the Conservatives retained control of the council with a majority of 8.
The 1973 Horsham District Council election was the first ever for the council and took place on 7 June 1973 to elect members of Horsham District Council in England. It was held on the same day as other local elections. Independent councillors secured a majority of two with 23 seats, the Conservatives won 17 and the Liberal Party won 2. Labour also took part in the elections, fielding candidates in Horsham South & Horsham North only. The Liberal Party were successful in Broadbridge Heath and they were able to secure a seat in Storrington. The Conservative Party achieved good results in some rural areas but they were able to win the vast amount of their seats in the town. Independent councillors won a majority of seats in the villages in the district, sometimes unopposed, some later stood as a Conservative candidate three years later in the next set of elections for the Council.
The 1976 Horsham District Council election took place on 6 May 1976 to elect members of Horsham District Council in England. It was held on the same day as other local elections. The Conservatives won a majority of 9 on the council, gaining from Independent. In a number of seats, candidates who stood as an Independent in 1973, when these seats were last contested, stood again as a Conservative Party candidate. Residents' association won their first seat to the council, winning a seat in Henfield. The Liberal Party lost both of their seats from the previous election three years ago.
The 1979 Horsham District Council election took place on 3 May 1979 to elect members of Horsham District Council in England. It was held on the same day as other local elections and the 1979 United Kingdom general election. The Conservatives retained control of the council with 33 seats, a majority of 12. The Independents had eight councillors elected, a decrease of three from last time. The Liberals gained a seat in Bramber & Upper Beeding and the Residents' association held on to their Henfield seat.
The 1987 Horsham District Council election took place on 7 May 1987 to elect members of Horsham District Council in England. It was held on the same day as other local elections. The Conservatives retained control of the council with 33 seats, a majority of 12. The SDP–Liberal Alliance won 6 seats and Independents won 4.
The 1991 Horsham District Council election took place on 2 May 1991 to elect members of Horsham District Council in England. It was held on the same day as other local elections. The Conservatives retained control of the council with a reduced majority. The Liberal Democrats gained a net total of 7 and Independent candidates had 2 councillors elected.
The 1995 Horsham District Council election took place on 4 May 1995 to elect members of Horsham District Council in England. It was held on the same day as other local elections. The Liberal Democrats gained control of the council from the Conservatives with a 3 seat majority. This was the first time ever the Conservative Party lost control of Horsham District Council since they first won overall control in 1976.
The 1999 Horsham District Council election took place on 6 May 1999 to elect members of Horsham District Council in England. It was held on the same day as other local elections. The Conservatives won a majority of 3 on the council, gaining from the Liberal Democrats.
The 2003 Horsham District Council election took place on 1 May 2003 to elect members of Horsham District Council in England. It was held on the same day as other local elections. The result left the council with no overall control with the Conservatives one seat short of a majority.
The 2007 Horsham District Council election took place on 3 May 2007 to elect members of Horsham District Council in England. It was held on the same day as other local elections. The Conservatives won a majority on the council, gaining from no overall control.
The 2011 Horsham District Council election took place on 5 May 2011 to elect members of Horsham District Council in England. It was held on the same day as other local elections and the 2011 United Kingdom Alternative Vote referendum. The Conservatives increased their majority on the council to 12, winning a total of 34 seats.
The 2023 Horsham District Council election took place on 4 May 2023 to elect members of Horsham District Council in West Sussex, England. It was held on the same day as other local elections in England.