1982 Adur District Council election

Last updated
1982 Adur District Council election
Flag of England.svg
  1980 6 May 1982 1983  

One third of seats (15 of 39) to Adur District Council
20 seats needed for a majority
 First partySecond partyThird party
 
Party Conservative Alliance Residents
Seats won861
Seat changeIncrease2.svg2Decrease2.svg2Steady2.svg

Adur UK local election 1982 map.png
Map showing the results of the 1982 Adur council elections.

Majority party before election

Alliance

Majority party after election

Alliance

Elections to the Adur District Council were held on 6 May 1982, with one third of the council up for election. There was additional vacancies in the Mash Barn and Peverel wards, but no elections for the single-member ward St Marys and Residents stronghold, Marine, went uncontested. In the intervening years, the newly formed Alliance had gained three seats at the expense of the Conservatives. Overall turnout fell to 42.4%. [1]

Non-metropolitan district Type of local government district in England

Non-metropolitan districts, or colloquially "shire districts", are a type of local government district in England. As created, they are sub-divisions of non-metropolitan counties in a two-tier arrangement.

Conservative Party (UK) Political party in the United Kingdom

The Conservative Party, officially the Conservative and Unionist Party, sometimes informally called the Tories, is a centre-right political party in the United Kingdom. The governing party since 2010, it is the largest in the House of Commons, with 313 Members of Parliament, and also has 249 members of the House of Lords, 4 members of the European Parliament, 31 Members of the Scottish Parliament, 11 members of the Welsh Assembly, eight members of the London Assembly and 8,916 local councillors.

Contents

The election resulted in the SDP-Liberal Alliance retaining control of the council. [2] [3]

Election result

Adur District Council Election Result 1982 [2]
PartySeatsGainsLossesNet gain/lossSeats %Votes %Votes+/−
  Conservative 820+253.344.77,478+7.4
  Alliance 602-240.043.27,221-1.5
  Residents 10006.70.00-4.0
  Labour 00000.012.22,033-1.8

This resulted in the following composition of the council: [2]

PartyPrevious councilNew council
SDP-Liberal Alliance2321
Conservative1315
Independent Residents22
Labour11
Total3939
Working majority 7  3 

Ward results

+/- figures represent changes from the last time these wards were contested.

Buckingham (4017) [2]
PartyCandidateVotes%±
Conservative Morris H. Ms.1,16066.2+3.5
Alliance Miller A.59233.8+6.7
Majority56832.4-3.2
Turnout 1,75243.6
Conservative hold Swing -1.6
Churchill (3735) [2]
PartyCandidateVotes%±
Conservative Kemp C.67645.7+9.2
Alliance Blunkett R.66344.8-9.7
Labour Cosgrave L.1419.5+0.5
Majority130.9-17.2
Turnout 1,48039.6-9.7
Conservative hold Swing +9.4
Cokeham (3550) [2]
PartyCandidateVotes%±
Alliance Brooks J.86886.2+27.2
Labour Taylor M.13913.8+5.8
Majority72972.4+46.5
Turnout 1,00728.4-16.7
Alliance hold Swing +10.7
Eastbrook (3635) [2]
PartyCandidateVotes%±
Conservative Dunn R.79144.1+10.0
Labour Barnard D.64536.0-5.4
Alliance Williams A. Ms.35719.9-4.7
Majority1468.1+0.9
Turnout 1,79349.3-0.1
Conservative hold Swing +7.7
Hillside (3819) [2]
PartyCandidateVotes%±
Conservative Wey G.86560.2+18.8
Alliance James G.31121.6-2.3
Labour Backwell J. Ms.26218.2-16.5
Majority55438.5+31.8
Turnout 1,43837.7-6.7
Conservative hold Swing +10.5
Manor (3284) [2]
PartyCandidateVotes%±
Conservative Lewis J.79751.6+10.3
Alliance Beales W.65142.1-11.1
Labour Aldrich G.986.3+0.8
Majority1469.4-2.5
Turnout 1,54647.1-2.2
Conservative gain from Alliance Swing +10.7
Marine (2617) [2]
PartyCandidateVotes%±
Residents Shephard P.UnopposedN/AN/A
Residents hold Swing N/A
Mash Barn (2963) [2]
PartyCandidateVotes%±
Alliance Beresford P.69787.2+20.2
Alliance Hartley J. Ms.688
Labour Harwood R.10212.8+4.7
Labour Atkins H. Ms.84
Majority59574.5+32.4
Turnout 79927.0-17.0
Alliance hold Swing
Alliance hold Swing +7.7
Peverel (3167) [2]
PartyCandidateVotes%±
Alliance Meeten J.72061.1+1.6
Alliance Megginson J. Ms.687
Conservative Titley T.37031.4+2.0
Labour Atkins B.887.5-3.6
Labour Atkins H. Ms.82
Majority35029.7-0.5
Turnout 1,17837.2-3.0
Alliance hold Swing
Alliance hold Swing -0.2
Southlands (3294) [2]
PartyCandidateVotes%±
Alliance Edwards A.62952.5-5.0
Conservative Hart E.39132.6+6.4
Labour Matthews M. Ms.17814.9-1.4
Majority23819.9-11.3
Turnout 1,19836.4-6.4
Alliance hold Swing -5.7
Southwick Green (3459) [2]
PartyCandidateVotes%±
Conservative Ferrers-Guy B. Ms.82156.7+16.0
Alliance Watson W.47532.8-15.6
Labour Edwards E. Ms.15310.6-0.4
Majority34623.9+16.1
Turnout 1,44941.9-8.4
Conservative gain from Alliance Swing +15.8
St. Nicolas (3583) [2]
PartyCandidateVotes%±
Conservative Huber J.88157.0+8.0
Alliance Attrill D. Ms.54735.4-7.3
Labour Bridson J. Ms.1177.6-0.7
Majority33421.6+15.3
Turnout 1,54543.1-1.8
Conservative hold Swing +7.6
Widewater (4085) [2]
PartyCandidateVotes%±
Conservative Moulton B.72646.9+13.0
Alliance Mantey B. Ms.71146.0-14.2
Labour Jacques W.1107.1+1.2
Majority151.0-25.2
Turnout 1,54737.9-6.1
Conservative hold Swing +13.6

Related Research Articles

Arun District Council in West Sussex, England is elected every four years. Since the last boundary changes in 2015, 54 councillors have been elected from 23 wards.

Half of Adur District Council in West Sussex, England is elected every two years. Until 2003, the council was elected by thirds. Since the last boundary changes in 2004, 29 councillors have been elected from 14 wards.

2003 Wigan Metropolitan Borough Council election

Elections to Wigan Council were held on 1 May 2003 with one-third of the council was up for election. Prior to the election, there had been two vacancies in Leigh Central, with Labour winning a by-election in June and the seat being fought in this election filled unopposed by Barbara Jarvis.

2008 Adur District Council election

Elections to Adur District Council in West Sussex, England were held on 1 May 2008. Half of the council was up for election and the Conservative party held overall control of the council.

Worthing Borough Council

Worthing Borough Council is a district council in the county of West Sussex, based in the borough of Worthing. The borough council was created in 1974 under the Local Government Act 1972 out of the existing Worthing Municipal Council, which also had borough status. It forms the lower tier of local government in Worthing, responsible for local services such as housing, planning, leisure and tourism.

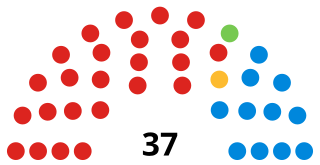
One third of Worthing Borough Council in Worthing, West Sussex, England is elected each year, followed by one year without election. Since the last boundary changes in 2003, 37 councillors are elected from 13 wards.

2010 Adur District Council election

The 2010 Adur District Council election took place on 6 May 2010 to elect members of Adur District Council in West Sussex, England. Half of the council was up for election and the Conservative party stayed in overall control of the council.

1979 United Kingdom local elections

Local elections were held in the United Kingdom on 3 May 1979. The results provided some source of comfort to the Labour Party (UK), who recovered some lost ground from local election reversals in previous years, despite losing the general election to the Conservative Party on the same day.

2012 Adur District Council election

The 2012 Adur District Council elections took place on 3 May 2012 to elect members of Adur District Council in West Sussex, England. Half of the council was up for election, and the Conservative Party remained in overall control of the council.

1986 Barnsley Metropolitan Borough Council election

Elections to Barnsley Metropolitan Borough Council were held on 8 May 1986, with one third of the council up for election as well as vacancies in Athersley and South West wards. Prior to the election Labour gained a seat from Alliance in a Penistone East by-election. The election resulted in Labour retaining control of the council.

The first elections to the newly created Adur District Council established by the Local Government Act 1972 in England and Wales were held 7 June 1973. Overall turnout was recorded at 46.6%.

Elections to the Adur District Council were held on 6 May 1976, with the entire council up for election. The two councillors in Marine elected as Residents were defending their seats as Independents. Overall turnout was recorded at 51.8%.

1979 Adur District Council election

Elections to the Adur District Council were held on 3 May 1979, alongside the general election. The entire council was up for election, following boundary changes that reduced the number of wards by one, but altogether had added an additional two seats. Overall turnout was recorded at 74.4%.

1980 Adur District Council election

Elections to the Adur District Council were held on 1 May 1980, with one third of the council up for election. There was an additional vacancy in the Southwick Green ward, and no elections for the single-member ward St Marys. Overall turnout dropped to 48.7%.

1983 Adur District Council election

Elections to the Adur District Council were held on 5 May 1983, with one third of the council up for election. There was an additional vacancy in the Peverel ward and no elections for the Marine ward. Overall turnout climbed to 47.6%.

1984 Adur District Council election

Elections to the Adur District Council were held on 3 May 1984, with one third of the council up for election. There was no elections held for the single-member St Mary's ward. Overall turnout was recorded at 45.6%.

1986 Adur District Council election

Elections to the Adur District Council were held on 8 May 1986, with minor boundary changes taking effect, impacting the Peverel ward. One third of the council was due for re-election, with additional vacancies in Buckingham, Churchill and Mash Barn wards. No elections were to be held for the single-member St Mary's ward. The formerly Conservative councillor for Southwick Green was defending the seat as an Independent, with no Conservative contesting that ward. Overall turnout was down slightly to 45.3%.

1987 Adur District Council election

Elections to the Adur District Council were held on 7 May 1987, with one third of the council up for election. There were additional vacancies in the Churchill and Widewater wards and no elections for the two-member Marine ward. Overall turnout climbed to 48.3%.

1988 Adur District Council election

Elections to the Adur District Council were held on 5 May 1988, with one third of the council up for election however no elections were held for the single-member ward St Mary's. Overall turnout dropped to 42.5%.

1990 Adur District Council election

Elections to the Adur District Council were held on 3 May 1990, with one third of the council up for election, as well as vacancies in the Churchill and Manor wards. No elections were held for the single-member St Mary's ward. The sitting Resident councillor in Overall turnout jumped to 49.8%.

References

  1. Local elections in Britain: a statistical digest, edited by Colin Rallings and Michael Thrasher. 2nd Edition 2003
  2. 1 2 3 4 5 6 7 8 9 10 11 12 13 14 15 16 "Elections Centre: Adur 1973-2012" (PDF). electionscentre.co.uk/plymouth.ac.uk. Retrieved 2017-07-25.
  3. "Vote 2012: Adur". bbc.co.uk. Retrieved 2018-03-18.