| ||||||||||||||||||||||
| ||||||||||||||||||||||
All 50 seats to Chichester District Council 26 seats needed for a majority | ||||||||||||||||||||||
---|---|---|---|---|---|---|---|---|---|---|---|---|---|---|---|---|---|---|---|---|---|---|
| ||||||||||||||||||||||
|
Elections to Chichester District Council in West Sussex, United Kingdom were held on 3 May 1979, the same day as the general election.
The whole council was up for election and resulted in a Conservative majority.
Boundary changes resulted in the creation of three new wards: Chichester North, Selsey North and Selsey South. The number of councillors representing Chichester West and Southbourne were reduced, from 5 to 3 and 4 to 3 respectively. The Selsey ward was abolished.
Boundary changes in effect from May 1979 | |||||
---|---|---|---|---|---|
Old wards | New wards | ||||
Chichester East | Chichester North‡ | ||||
Chichester West | |||||
Selsey* | Selsey North‡ | ||||
Selsey South‡ | |||||
* Abolished | ‡ New creation |
Party | Seats | Gains | Losses | Net gain/loss | Seats % | Votes % | Votes | +/− | |
---|---|---|---|---|---|---|---|---|---|
Conservative | 27 | 2 | 8 | 6 | 54.0 | 40.0 | 25,365 | –9.5 | |
Liberal | 11 | 10 | 0 | 10 | 22.0 | 28.1 | 17,894 | +6.9 | |
Independent | 7 | 1 | 2 | 1 | 14.0 | 11.5 | 7,325 | +1.4 | |
Residents | 3 | 0 | 1 | 1 | 6.0 | 9.6 | 6,106 | –4.1 | |
Ind. Conservative | 2 | 2 | 0 | 2 | 4.0 | 3.6 | 2,278 | N/A | |
Labour | 0 | 0 | 0 | 0.0 | 4.7 | 2,996 | +2.6 | ||
Ind. Ratepayers | 0 | 0 | 0 | 0.0 | 1.4 | 905 | –2.0 | ||
SPA (UK) | 0 | 0 | 0 | 0.0 | 1.3 | 833 | N/A |
27 | 11 | 7 | 3 | 2 |
Conservative | Liberal | Independent | Res. | I.C. |
Party | Candidate | Votes | % | ± | |
---|---|---|---|---|---|
Conservative | J. Darley | Unopposed | |||
Turnout | 0 | 0.0 | N/A | ||
Registered electors | 1,432 | ||||
Conservative hold |
Party | Candidate | Votes | % | ±% | |
---|---|---|---|---|---|
Conservative | H. Rycroft | 1,332 | 36.8 | N/A | |
Independent | D. Yden | 1,254 | 34.6 | N/A | |
Independent | J. Lillywhite | 1,037 | 28.6 | N/A | |
Turnout | 3,623 | 75.3 | N/A | ||
Registered electors | 3,099 | ||||
Conservative hold | Swing | ||||
Independent hold | Swing | ||||
Party | Candidate | Votes | % | ± | |
---|---|---|---|---|---|
Conservative | E. Kirkby-Bott | Unopposed | |||
Turnout | 0 | 0.0 | N/A | ||
Registered electors | 1,334 | ||||
Conservative hold |
Party | Candidate | Votes | % | ± | |
---|---|---|---|---|---|
Conservative | C. Roberts | Unopposed | |||
Turnout | 0 | 0.0 | N/A | ||
Registered electors | 1,238 | ||||
Conservative hold |
Party | Candidate | Votes | % | ±% | |
---|---|---|---|---|---|
Liberal | A. French | 1,194 | 40.9 | +12.3 | |
Conservative | P. Combes | 1,184 | 35.4 | –12.9 | |
Liberal | C. Tupper | 1,183 | |||
Liberal | E. French | 1,066 | |||
Conservative | M. Gowing | 910 | |||
Conservative | D. Myers | 894 | |||
Labour | D. Morrison | 725 | 23.7 | +10.7 | |
Labour | T. Rooth | 642 | |||
Labour | P. Norris | 629 | |||
Turnout | 8,428 | 71.9 | +28.5 | ||
Registered electors | 4,379 | ||||
Liberal gain from Conservative | Swing | ||||
Conservative hold | Swing | ||||
Liberal gain from Conservative | Swing | ||||
Party | Candidate | Votes | % | ±% | |
---|---|---|---|---|---|
Liberal | J. Rankin | 1,307 | 51.0 | N/A | |
Conservative | T. France | 1,289 | 49.0 | N/A | |
Liberal | L. Eyles | 1,266 | |||
Liberal | A. Bird | 1,263 | |||
Conservative | E. Craig | 1,219 | |||
Conservative | D. Hoult | 1,183 | |||
Turnout | 7,527 | 74.1 | N/A | ||
Registered electors | 3,778 | ||||
Liberal win (new seat) | |||||
Conservative win (new seat) | |||||
Liberal win (new seat) |
Party | Candidate | Votes | % | ±% | |
---|---|---|---|---|---|
Liberal | P. Weston | 1,743 | 63.6 | +13.9 | |
Liberal | K. Smith | 1,549 | |||
Liberal | A. Scicluna | 1,546 | |||
Conservative | A. Black | 1,003 | 36.4 | –13.9 | |
Conservative | J. Rankin | 925 | |||
Conservative | F. Robertson | 839 | |||
Turnout | 7,605 | 71.8 | |||
Registered electors | 4,054 | ||||
Liberal gain from Conservative | Swing | ||||
Liberal hold | Swing | ||||
Party | Candidate | Votes | % | ±% | |
---|---|---|---|---|---|
Liberal | L. Holden | 1,627 | 53.2 | +21.8 | |
Liberal | M. Clough | 1,564 | |||
Liberal | S. Lawrence | 1,470 | |||
Conservative | W. Doody | 1,455 | 46.8 | –14.5 | |
Conservative | U. Hogg | 1,413 | |||
Conservative | A. Slade | 1,240 | |||
Turnout | 8,769 | 72.5 | +28.4 | ||
Registered electors | 4,723 | ||||
Liberal gain from Conservative | Swing | ||||
Party | Candidate | Votes | % | ± | |
---|---|---|---|---|---|
Conservative | J. Laird | Unopposed | |||
Turnout | 0 | 0.0 | N/A | ||
Registered electors | 1,428 | ||||
Conservative hold |
Party | Candidate | Votes | % | ±% | |
---|---|---|---|---|---|
Conservative | J. Wood | 647 | 61.4 | –8.0 | |
Labour | A. Groves | 406 | 38.6 | +8.0 | |
Turnout | 1,053 | 71.8 | +29.6 | ||
Registered electors | 1,477 | ||||
Conservative hold | Swing | ||||
Party | Candidate | Votes | % | ± | |
---|---|---|---|---|---|
Conservative | C. Craven | Unopposed | |||
Turnout | 0 | 0.0 | N/A | ||
Registered electors | 2,370 | ||||
Conservative hold |
Party | Candidate | Votes | % | ±% | |
---|---|---|---|---|---|
Independent | M. Gilbert | 1,047 | 40.3 | +16.5 | |
Conservative | S. Hamilton | 792 | 30.5 | +4.5 | |
Independent | C. Barkman | 757 | 29.2 | N/A | |
Turnout | 2,596 | 72.1 | +21.1 | ||
Registered electors | 2,319 | ||||
Independent hold | Swing | ||||
Conservative hold | Swing | ||||
Party | Candidate | Votes | % | ± | |
---|---|---|---|---|---|
Independent | D. Gauntlett | Unopposed | |||
Turnout | 0 | 0.0 | N/A | ||
Registered electors | 1,821 | ||||
Independent hold |
Party | Candidate | Votes | % | ± | |
---|---|---|---|---|---|
Independent | K. Murray | Unopposed | |||
Turnout | 0 | 0.0 | N/A | ||
Registered electors | 1,466 | ||||
Independent hold |
Party | Candidate | Votes | % | ± | |
---|---|---|---|---|---|
Conservative | H. Booker | Unopposed | |||
Turnout | 0 | 0.0 | N/A | ||
Registered electors | 1,387 | ||||
Conservative hold |
Party | Candidate | Votes | % | ±% | |
---|---|---|---|---|---|
Conservative | M. Nicholson | 764 | 59.6 | N/A | |
Liberal | W. Sherlock | 518 | 40.4 | N/A | |
Turnout | 1,282 | 74.3 | N/A | ||
Registered electors | 1,738 | ||||
Conservative hold | Swing | ||||
Party | Candidate | Votes | % | ±% | |
---|---|---|---|---|---|
Liberal | F. Heald | 598 | 54.5 | +16.9 | |
Conservative | F. Longmore | 499 | 45.5 | –5.5 | |
Turnout | 1,097 | 73.0 | +24.0 | ||
Registered electors | 1,484 | ||||
Liberal gain from Conservative | Swing | ||||
Party | Candidate | Votes | % | ± | |
---|---|---|---|---|---|
Conservative | R. Gibson | Unopposed | |||
Turnout | 0 | 0.0 | N/A | ||
Registered electors | 1,194 | ||||
Conservative gain from Independent |
Party | Candidate | Votes | % | ± | |
---|---|---|---|---|---|
Conservative | R. Hancock | Unopposed | |||
Turnout | 0 | 0.0 | N/A | ||
Registered electors | 1,415 | ||||
Conservative hold |
Party | Candidate | Votes | % | ±% | |
---|---|---|---|---|---|
Independent | P. Burne | 1,525 | 34.7 | N/A | |
Ind. Conservative | D. Mott | 1,260 | 28.6 | N/A | |
Conservative | P. Stonehouse | 586 | 26.3 | N/A | |
Conservative | M. Smith | 572 | N/A | ||
Labour | P. Pritchard | 455 | 10.3 | N/A | |
Turnout | 4,398 | 74.8 | N/A | ||
Registered electors | 3,395 | ||||
Independent hold | Swing | ||||
Ind. Conservative gain from Independent | Swing | ||||
Party | Candidate | Votes | % | ±% | |
---|---|---|---|---|---|
Conservative | N. Best | 638 | 62.9 | +4.8 | |
Independent | J. Stapleford | 377 | 37.1 | N/A | |
Turnout | 1,015 | 71.3 | +36.6 | ||
Registered electors | 1,401 | ||||
Conservative hold | Swing | ||||
Party | Candidate | Votes | % | ± | |
---|---|---|---|---|---|
Conservative | C. Linton | Unopposed | |||
Conservative | J. Duncton | Unopposed | |||
Turnout | 0 | 0.0 | N/A | ||
Registered electors | 2,851 | ||||
Conservative hold | |||||
Conservative hold |
Party | Candidate | Votes | % | ± | |
---|---|---|---|---|---|
Conservative | P. Luttman-Johnson | Unopposed | |||
Conservative | T. Micklem | Unopposed | |||
Turnout | 0 | 0.0 | N/A | ||
Registered electors | 3,024 | ||||
Conservative hold | |||||
Conservative hold |
Party | Candidate | Votes | % | ±% | |
---|---|---|---|---|---|
Conservative | R. Alexander | 816 | 75.7 | N/A | |
Independent | A. Jackson | 262 | 24.3 | N/A | |
Turnout | 1,078 | 75.1 | N/A | ||
Registered electors | 1,427 | ||||
Conservative hold | Swing | ||||
Party | Candidate | Votes | % | ± | |
---|---|---|---|---|---|
Conservative | B. Ager | Unopposed | |||
Conservative | T. Robinson | Unopposed | |||
Turnout | 0 | 0.0 | N/A | ||
Registered electors | 3,231 | ||||
Conservative win (new seat) | |||||
Conservative win (new seat) |
Party | Candidate | Votes | % | ±% | |
---|---|---|---|---|---|
Ind. Conservative | P. Hammond | 1,018 | 27.9 | N/A | |
Conservative | J. Whiteman | 925 | 49.2 | N/A | |
Conservative | R. Seaman | 868 | N/A | ||
SPA | H. Van Raat | 833 | 22.9 | N/A | |
Turnout | 3,644 | 74.9 | N/A | ||
Registered electors | 2,957 | ||||
Ind. Conservative win (new seat) | |||||
Conservative win (new seat) |
Party | Candidate | Votes | % | ±% | |
---|---|---|---|---|---|
Independent | A. Petrie-Hay | 572 | 80.5 | N/A | |
Labour | R. Norris | 139 | 19.5 | N/A | |
Turnout | 711 | 74.1 | +21.1 | ||
Registered electors | 959 | ||||
Independent gain from Residents | Swing | ||||
Party | Candidate | Votes | % | ±% | |
---|---|---|---|---|---|
Residents | L. Denby | 2,322 | 62.4 | –8.3 | |
Residents | I. Sutherland | 1,952 | |||
Residents | C. Singer | 1,832 | |||
Conservative | P. Warren | 986 | 28.4 | +17.3 | |
Conservative | P. Blake | 950 | |||
Conservative | M. Higgins | 842 | |||
Ind. Ratepayers | G. Feltham | 489 | 9.2 | –9.0 | |
Ind. Ratepayers | D. Feltham | 416 | |||
Turnout | 9,789 | 74.3 | +27.4 | ||
Registered electors | 4,742 | ||||
Residents hold | Swing | ||||
Party | Candidate | Votes | % | ± | |
---|---|---|---|---|---|
Conservative | A. Burdett | Unopposed | |||
Turnout | 0 | 0.0 | N/A | ||
Registered electors | 1,556 | ||||
Conservative hold |
Party | Candidate | Votes | % | ± | |
---|---|---|---|---|---|
Independent | J. Mann | Unopposed | |||
Turnout | 0 | 0.0 | N/A | ||
Registered electors | 1,321 | ||||
Independent hold |
Party | Candidate | Votes | % | ± | |
---|---|---|---|---|---|
Conservative | H. Allen | Unopposed | |||
Turnout | 0 | 0.0 | N/A | ||
Registered electors | 2,271 | ||||
Conservative hold |
Party | Candidate | Votes | % | ±% | |
---|---|---|---|---|---|
Conservative | S. Bray | 594 | 54.6 | –1.4 | |
Independent | D. Rudkin | 494 | 45.4 | N/A | |
Turnout | 1,088 | 73.7 | +25.0 | ||
Registered electors | 1,476 | ||||
Conservative hold | Swing | ||||
Party | Candidate | Votes | % | ± | |
---|---|---|---|---|---|
Conservative | J. Illius | Unopposed | |||
Turnout | 0 | 0.0 | N/A | ||
Registered electors | 1,858 | ||||
Conservative hold |
Chichester is a local government district in West Sussex, England. It is named after the city of Chichester, which is its largest settlement and where the council is based. The district includes the towns of Midhurst, Petworth and Selsey and surrounding rural areas, including many villages. The district includes part of the South Downs National Park, and Chichester Harbour is a designated Area of Outstanding Natural Beauty. At the 2021 census the district had a population of 124,531.
St Albans is a constituency represented in the House of Commons of the UK Parliament since 2019 by Daisy Cooper, a Liberal Democrat.
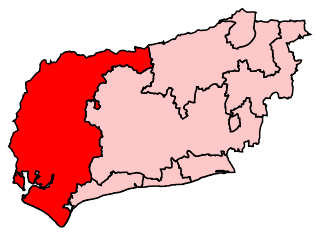
Chichester is a constituency in West Sussex, represented in the House of Commons of the UK Parliament since 2017 by Gillian Keegan, a Conservative.
Arun District Council in West Sussex, England is elected every four years. Since the last boundary changes in 2015, 54 councillors have been elected from 23 wards.
Chichester District Council in West Sussex, England is elected every four years. Since the last boundary changes in 2019, 36 councillors have been elected from 21 wards.
West Lancashire Borough Council elections are generally held three years out of every four, with a third of the council elected each time. West Lancashire Borough Council is the local authority for the non-metropolitan district of West Lancashire in Lancashire, England. Since the last boundary changes in 2023 the council has comprised 45 councillors representing 15 wards, with each ward electing three councillors.
West Berkshire Council is the local authority for West Berkshire, a unitary authority in Berkshire, England. Until 1 April 1998 it was a non-metropolitan district called Newbury.
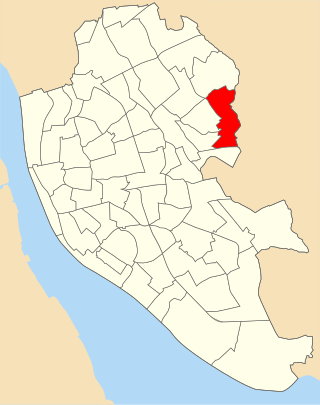
Yew Tree ward is an electoral division of Liverpool City Council within the Liverpool West Derby Parliamentary constituency.
The Manhood Peninsula is in the southwest of West Sussex in England. It has the English Channel to its south and Chichester to the north. It is bordered to its west by Chichester Harbour and to its east by Pagham Harbour, its southern headland being Selsey Bill.
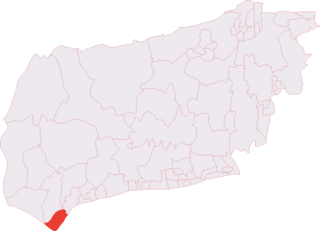
Selsey is an electoral division of West Sussex in the United Kingdom, and returns one member to sit on West Sussex County Council.
Selsey North was an electoral ward of Chichester District, West Sussex, England that returned three members to sit on Chichester District Council.
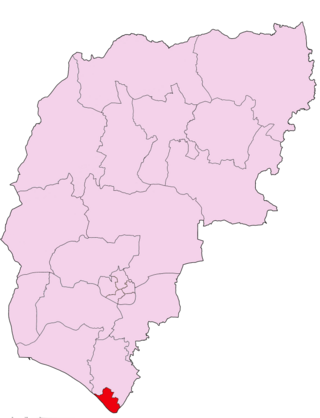
Selsey South is an electoral ward of Chichester District, West Sussex, England and returns two members to sit on Chichester District Council.
Sidlesham was an electoral ward of Chichester District, West Sussex, England that returned one member to sit on Chichester District Council.
Elections to Chichester District Council in West Sussex, United Kingdom were held on 2 May 2019. The whole council was up for election and the Conservative Party had its majority wiped out.
Sidlesham with Selsey North is an electoral ward of Chichester District, West Sussex, England and returns two members to sit on Chichester District Council.
The Local Alliance is a political party based in Chichester, England. The party was founded in 2019 and has successfully contested local elections to Chichester District Council and West Sussex County Council.